
Sales Performance Management Market Size, Share, Trends and Forecast by Solution, Services, Organization Size, Deployment Model, End User, and Region, 2026-2034
Sales Performance Management Market Size and Share:
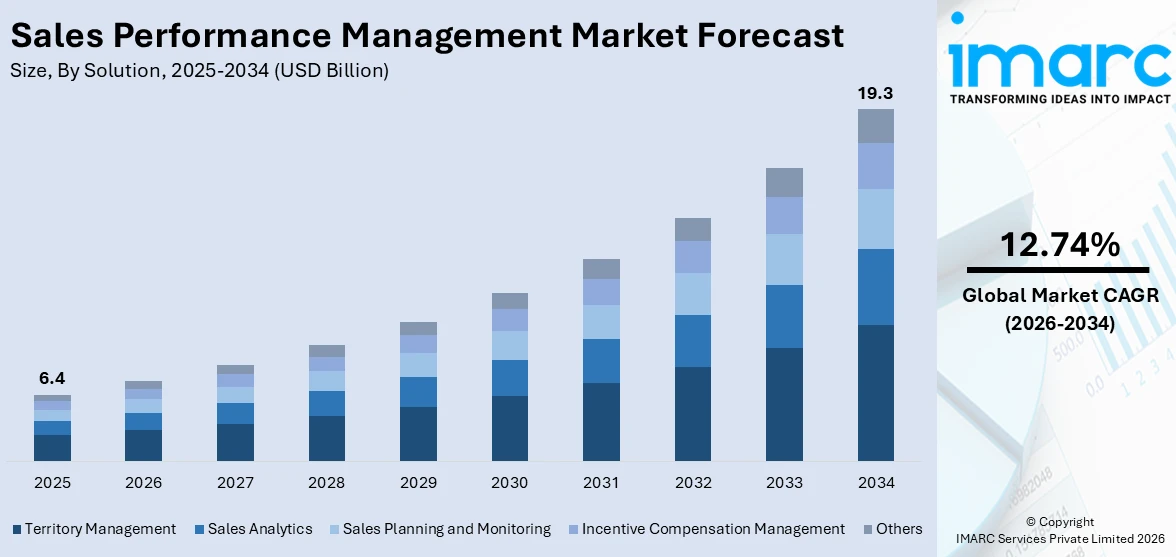
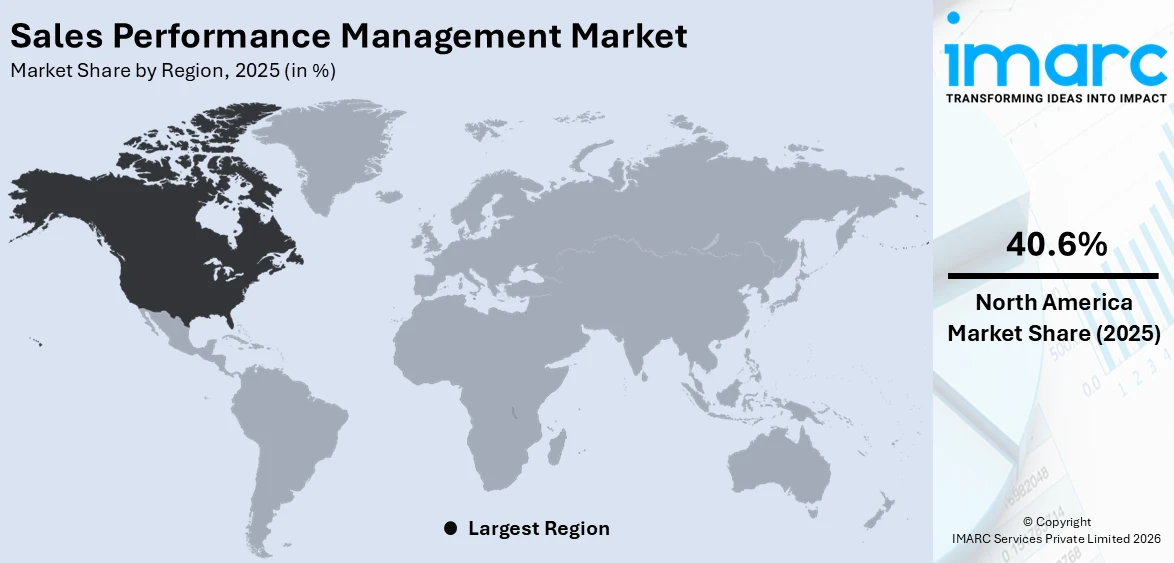
The global sales performance management market size was valued at USD 6.4 Billion in 2025. Looking forward, IMARC Group estimates the market to reach USD 19.3 Billion by 2034, exhibiting a CAGR of 12.74% from 2026-2034. North America currently dominates the market, holding a market share of 40.6% in 2025. The market is driven by the increasing demand for enhanced sales efficiency and productivity. Organizations are placing greater emphasis on data-driven decision-making, which supports better strategic planning. Integration with CRM and ERP systems streamlines operations and improves data accessibility. Additionally, ongoing technological advancements particularly in artificial intelligence and machine learning are transforming business processes, enabling automation, deeper insights, and smarter customer interactions thus bolstering the sales performance management market share.
|
Report Attribute
|
Key Statistics
|
|---|---|
|
Base Year
|
2025
|
|
Forecast Years
|
2026-2034
|
|
Historical Years
|
2020-2025
|
| Market Size in 2025 | USD 6.4 Billion |
| Market Forecast in 2034 | USD 19.3 Billion |
| Market Growth Rate 2026-2034 | 12.74% |
A major driver in the sales performance management (SPM) market is the growing demand for greater sales efficiency and productivity. With increasing competition and changing customer needs, organizations are looking for solutions that streamline sales processes, maximize resource utilization, and improve sales team performance. SPM solutions assist in automating core activities like incentive compensation, quota management, and performance monitoring. This minimizes administrative overhead and enables sales teams to concentrate on strategic selling. In addition, real-time reporting and analytics generate useful information, which allows managers to make effective decisions, drive revenue in the market, and align sales strategies with business goals.
To get more information on this market Request Sample
The U.S. dominates the sales performance management market outlook because of its robust technological infrastructure and strong emphasis on sales effectiveness with a market share of 85.90%. SPM solutions are being increasingly used by U.S. businesses to automate operations, enhance incentive compensation, and achieve improved sales results. The widespread adoption of cloud-based systems and integration with CRM and ERP solutions has further spurred adoption. Also, American businesses are utilizing artificial intelligence and data analytics to drive actionable insights, enhance performance, and synchronize sales strategy with business objectives. This forward-looking strategy places the U.S. as a primary driver and trendsetter of the international SPM industry.
Sales Performance Management Market Trends:
Technological advancements and integration
One of the major drivers of the sales performance management market trends is the technological advancements and integration. Advanced analytics, AI, and ML are changing how sales data is captured, analyzed, and used. For instance, in May 2024, Richardson Sales Performance launched its new Accelerate Sales Performance System, a metrics-driven approach to sales capability development that combines comprehensive analytics that highlight the most important skill gaps affecting revenue with exceptionally tailored training experiences to enhance overall company performance. These technologies make understanding, in real-time, sales performance possible, thereby enabling companies to drive data-driven decisions while tailoring their strategies for efficiency and productivity. Therefore, this is significantly supporting the market growth. Along with this, the SPM solutions are integrated into other enterprise systems, including Customer Relationship Management and Enterprise Resource Planning, for flawless process flow, hence adopting a holistic approach towards sales management. Cloud-based, the SPM solutions come with flexibility, scalability, and cost-effectiveness, hence opening their doors to all businesses regardless of size. Moreover, the escalating demand for sophisticated SPM tools as their competitive strength works in direct relation with modern technology, hence driving sales performance management market size.
Increasing Need for Enhanced Sales Efficiency and Productivity
The ability to optimize sales efficiency and productivity is one of the key drivers of growth in the global SPM market. Business organizations are striving to optimize the potential of sales and revenue generation and simultaneously trying to keep operational costs as low as possible. SPM solutions provide end-to-end management of sales performance, including quota management, incentive compensation, and territory planning. For instance, in September 2024, CaptivateIQ launched CaptivateIQ Planning, a data-driven solution that supports overall Sales Performance Management (SPM) strategies by making sure territories and quotas are in line with larger sales incentives, helping companies promote consistent and targeted execution across the whole salesforce. By automating and streamlining these processes, SPM solutions help sales teams focus on core selling activities, reduce administrative burdens, and improve overall performance. With this enhanced ability to have insight into sales activities and performance metrics, managers can know the strengths and weaknesses of their staff, which is a basis for more focused training and development. Thus, this is propelling the sales performance management market growth. In addition, proper SPM practices are appropriately aligning sales strategies with organizational goals, ensuring efficient resource allocation while meeting sales targets consistently. Furthermore, the investment in SPM solutions is for higher sales productivity and operational excellence and drives the market.
Growing emphasis on data-driven decision making
Data-based decision-making is providing a major impetus to the global SPM market. For instance, according to reports, 26.5% of organizations reported the establishment of a data-driven organization. In the data-centric world of business, organizations make strategic decisions with the available data and seek a better competitive edge which is favoring the market. SPM solutions enable businesses with robust data analytics capabilities to track and analyze several sales performance metrics, such as sales quotas, revenues, and incentive compensation. These insights present a clear view of the trends in sales, customer behavior, and market dynamics, hence allowing businesses to make informed decisions and adopt strategies in reaction. With these, a business is in a better position to accurately forecast sales performance, model scenarios, proactively deal with difficulties, and capitalize on emerging opportunities. Along with this, the increasing need for data-driven decisions is positively influencing the demand for advanced SPM solutions, which are all-inclusive offerings enhanced by analytics and reporting capabilities, thereby fueling the sales performance management market demand.
Sales Performance Management Industry Segmentation:
IMARC Group provides an analysis of the key trends in each segment of the global sales performance management market, along with forecast at the global, regional, and country levels from 2026-2034. The market has been categorized based on solution, services, organization size, deployment model, and end user.
Analysis by Solution:
- Territory Management
- Sales Analytics
- Sales Planning and Monitoring
- Incentive Compensation Management
- Others
Territory management optimizes sales coverage by strategically assigning geographic or account-based regions to sales reps. It ensures balanced workloads, reduces overlap, and improves customer engagement. This solution enhances sales efficiency, aligns resources with market potential, and helps organizations achieve better performance across regions and sales teams.
Additionally, the sales analytics provides real-time insights into sales performance, customer behavior, and market trends. It empowers decision-makers to identify opportunities, forecast accurately, and address performance gaps. By leveraging data-driven strategies, organizations can refine sales tactics, monitor KPIs, and improve overall sales effectiveness and revenue growth.
Moreover, the sales planning and monitoring involve setting realistic targets, designing effective sales strategies, and continuously tracking progress. This solution aligns organizational goals with individual performance, allowing managers to adjust plans dynamically. It promotes transparency, accountability, and proactive management of sales processes, ultimately improving goal attainment.
Besides this, the incentive compensation management automates the design and administration of commission and bonus plans. It ensures accuracy, transparency, and timely payments, boosting sales motivation and trust. This solution reduces disputes, aligns incentives with business objectives, and drives consistent, high-performance behavior across sales teams.
Also, the other category includes additional tools such as quota management, gamification, and coaching platforms. These solutions support comprehensive performance development by fostering engagement, improving skill sets, and aligning individual efforts with business strategy. They enhance the overall effectiveness of Sales Performance Management systems by addressing niche organizational needs.
Analysis by Services:
- Consulting Services
- Managed Services
- Training and Support
- Others
Consulting services guide organizations in designing and implementing effective SPM strategies. Experts assess business needs, recommend appropriate solutions, and help align sales processes with goals. These services ensure optimal deployment, system integration, and maximize return on investment through tailored planning and performance improvement initiatives.
Likewise, the managed services involve outsourcing day-to-day operations of SPM systems to third-party providers. These services include system maintenance, updates, data management, and performance monitoring. Organizations benefit from reduced operational burden, improved system reliability, and access to expert support, enabling them to focus on core business functions and strategic growth.
Apart from this, the training and support services ensure that users effectively adopt and utilize SPM solutions. This includes onboarding, customized training programs, troubleshooting, and ongoing technical assistance. These services help maximize system efficiency, reduce user errors, and increase confidence in using the platform, leading to improved sales performance and productivity.
Furthermore, the other category includes integration services, custom development, and performance auditing. These specialized services address unique business requirements, ensuring seamless interoperability with existing systems, tailored functionality, and compliance with regulatory standards. They enhance the overall effectiveness and flexibility of SPM implementations across diverse organizational environments.
Analysis by Organization Size:
- Small and Medium-sized Enterprises
- Large Enterprises
Based on the sales performance management market forecast, the large Enterprises account for the majority of shares of 63.2% due to their complex sales operations, larger salesforces, and greater need for performance tracking and incentive management. These organizations often operate across multiple regions and product lines, requiring robust SPM solutions to manage compensation plans, quotas, and territory alignment effectively. Additionally, large enterprises have the financial resources to invest in advanced technologies, including AI and analytics, to optimize their sales strategies. They also prioritize data-driven decision-making, which is supported by real-time dashboards and performance metrics provided by SPM tools. This need for scalability, automation, and strategic alignment drives higher adoption of SPM solutions among large enterprises.
Analysis by Deployment Model:
- On-premises
- Cloud-based
On-premises deployment represents the largest market share in the Sales Performance Management (SPM) market due to several factors. Many large organizations prefer on-premises solutions for greater control over data security, customization, and system integration. This model allows companies to tailor the software to specific business needs and maintain strict compliance with industry regulations, especially in sectors like finance and healthcare. Additionally, organizations with existing IT infrastructure often find on-premises deployment more compatible and cost-effective in the long run. Concerns over data privacy and the need for real-time access to sensitive sales performance data also contribute to this preference. As a result, despite the rise of cloud-based models, on-premises remains dominant, particularly among enterprises with complex requirements.
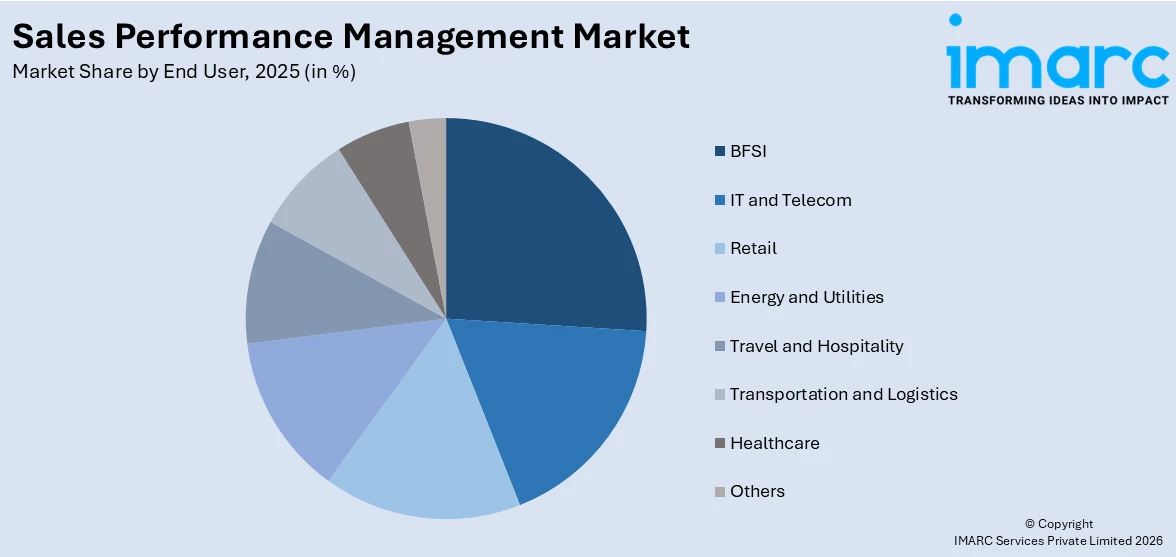
Analysis by End User:
Access the comprehensive market breakdown Request Sample
- BFSI
- IT and Telecom
- Retail
- Energy and Utilities
- Travel and Hospitality
- Transportation and Logistics
- Healthcare
- Others
BFSI dominate the market with a share of 22.8% due to its highly structured and target-driven sales environment. Financial institutions rely heavily on large, distributed sales teams and require precise tracking of performance metrics, incentive compensation, and regulatory compliance. SPM solutions help streamline complex commission structures, align sales goals with organizational strategies, and ensure transparency and accountability. The industry's stringent regulatory landscape also demands robust data security and audit capabilities, which SPM platforms can provide. Additionally, the rising demand for digital transformation and data-driven decision-making in BFSI further accelerates adoption. These factors make SPM tools essential in enhancing productivity, motivation, and overall efficiency in the BFSI sector.
Regional Analysis:
To get more information on the regional analysis of this market Request Sample
- North America
- United States
- Canada
- Asia Pacific
- China
- Japan
- India
- South Korea
- Australia
- Indonesia
- Others
- Europe
- Germany
- France
- United Kingdom
- Italy
- Spain
- Russia
- Others
- Latin America
- Brazil
- Mexico
- Others
- Middle East and Africa
North America is the leading region with a market share of 40.6% owing to its early adoption of advanced technologies and strong focus on sales optimization. The region is home to many of the world’s largest enterprises and key SPM solution providers, which fosters rapid innovation and implementation. Businesses in North America prioritize data-driven decision-making, real-time analytics, and AI integration, all of which are central to modern SPM platforms. Additionally, the widespread adoption of CRM and ERP systems enhances the effectiveness of SPM solutions. The region's mature IT infrastructure, high investment capacity, and regulatory focus on performance transparency further support market growth. These factors collectively position North America as the dominant force in the sales performance management market analysis.
Key Regional Takeaways:
United States Sales Performance Management Market Analysis
The United States sales performance management (SPM) market is primarily driven by several ongoing changes across technology, business strategy, and workforce expectations. Companies are increasingly under pressure to improve the accuracy of sales forecasting, commission tracking, and quota setting, which has heightened the demand for data-driven SPM tools. There has also been a shift toward cloud-based platforms that allow real-time analytics, customizable dashboards, and mobile access, features increasingly favored by sales teams and leadership alike. The growing reliance on hybrid and remote sales models has also made automation and visibility into team performance more critical than ever. Moreover, numerous organizations are investing in SPM software to reduce disputes in incentive payouts and align compensation with business goals. At the same time, integration with CRM, SOM, and ERP systems has become essential, driving the adoption of platforms that offer seamless interoperability. For instance, in May 2025, California-based Xactly established a partnership with ServiceNow to offer the sales sector better insight into Sales Performance Management through integration with ServiceNow Sales and Order Management (SOM). By seamlessly matching sales incentives with sales performance, this integration will enable ServiceNow clients to generate profitable revenue while achieving new levels of efficiency and strategic impact. Other than this, regulatory compliance around compensation transparency and auditability are further prompting enterprises to adopt structured SPM systems.
Asia Pacific Sales Performance Management Market Analysis
The Asia Pacific sales performance management (SPM) market is expanding due to the region's ongoing digital transformation and the increasing adoption of cloud-based solutions. For instance, cloud technology is expected to account for 8% of the GDP of India by 2026, as per the India Brand Equity Foundation (IBEF). Organizations are increasingly seeking data-driven insights to enhance sales effectiveness and align strategies with business objectives. The proliferation of smartphones and mobile-first solutions is also contributing substantially to the adoption of SPM tools, as they offer sales teams greater flexibility and real-time data access. For instance, with 660 Million smartphone users across the country, India reached a robust smartphone penetration rate of 46.5% in 2024, as per recent industry reports. Besides this, the demand for automation to improve visibility and avoid calculation inaccuracies is also propelling the market forward. Companies are increasingly investing in SPM solutions to optimize sales operations and achieve higher operational excellence.
Europe Sales Performance Management Market Analysis
The growth of the sales performance management (SPM) market in Europe is largely fueled by the increasing adoption of advanced technologies such as artificial intelligence (AI) and machine learning (ML), which enables organizations to optimize their sales processes through predictive analytics and data-driven decision-making. The rising demand for metric-driven sales tools and the need for improved visibility and accuracy in sales performance are further propelling the market forward. Moreover, the increasing shift toward cloud-based solutions is offering scalability and flexibility, allowing businesses to adapt to changing market conditions. According to the European Commission, 45.2% of businesses in Europe utilized cloud-based services for their operations in 2023, recording a growth of 4.2% in comparison to 2021. Out of these, 77.6% were large enterprises, 59% were medium enterprises, and 41.7% were small businesses. In addition to this, the growing emphasis on compliance and regulatory requirements in various industries is propelling the need for robust SPM systems to ensure transparency and accountability. The integration of SPM solutions with existing enterprise systems is also enhancing data synchronization and streamlining sales operations. These factors are collectively contributing to the robust expansion of the SPM market in Europe as organizations seek to enhance sales performance and achieve strategic objectives.
Latin America Sales Performance Management Market Analysis
The Latin America sales performance management market is experiencing robust growth due to rapid digital transformation across industries, which is prompting organizations to adopt advanced tools for managing sales performance, compensation, and forecasting. The digital transformation market in Latin America reached USD 53.40 Million in 2024 and is forecasted to grow at a CAGR of 17.70% during 2025-2033, as per a report published by the IMARC Group. In addition to this, the increasing emphasis on data-driven decision-making is encouraging businesses to implement analytics-enabled sales performance tools. Rising competition among local and global companies is also prompting organizations to optimize sales processes and enhance productivity through better performance tracking and incentive management. Besides this, regulatory changes and compliance requirements in sectors such as finance and healthcare are also encouraging businesses to adopt transparent and auditable performance systems.
Middle East and Africa Sales Performance Management Market Analysis
The Middle East and Africa sales performance management market is significantly influenced by the expanding retail, telecommunications, and financial services sectors in the region, which require streamlined sales operations and effective workforce motivation strategies. The increasing penetration of smartphones and internet connectivity is also enabling more widespread use of mobile-based SPM applications, particularly among field sales teams. For instance, Qatar has an internet penetration rate of 99%, making it one of the highest globally, according to the International Trade Administration (ITA). Moreover, the country reached a smartphone penetration rate of 144% in 2021. Other than this, numerous organizations are prioritizing customer-centric sales models, which require detailed performance analytics and customer interaction tracking. International partnerships and the entry of global tech vendors are introducing advanced SPM solutions and best practices, supporting industry expansion.
Competitive Landscape:
The sales performance management companies are self-managing their products and extending them to create differentiation. These companies, including SAP, Oracle, Salesforce, and IBM, in this area, invest heavily in research and development to transform advanced technologies such as AI, Machine Learning, and Predictive Analytics into their SPM offerings. All these enhancements bring forth a more accurate sales forecast, real-time performance insights, and automated processes. Furthermore, strategic mergers and acquisitions have been exercised by most of the major participants to extend their competency and geographic presence. Furthermore, they are developing flexible deployment models such as cloud-based ones to fulfill the disparate business requirements belonging to different industrial verticals.
The report provides a comprehensive analysis of the competitive landscape in the Sales Performance Management market with detailed profiles of all major companies, including:
- Anaplan Inc.
- Axtria Inc.
- beqom SA
- Iconixx Software Corporation
- International Business Machines Corporation
- Microsoft Corporation
- NICE Ltd.
- Oracle Corporation
- Salesforce.com Inc.
- SAP SE
- Xactly Corporation
Latest News and Developments:
- June 2025: CaptivateIQ, a provider of sales performance management solutions, launched its new Guided Plan Builder. With a quicker time to value, internal ownership, and a flatter administrative learning curve, this significant product innovation is expected to contribute substantially to a reduction in the cost of handling incentive compensation.
- June 2025: Everstage, a sales performance management platform, launched Everstage Planning, a novel solution tailored to enterprise requirements. This novel product enables businesses to precisely manage territory, quota, and capacity, extending Everstage's product line beyond Incentive Compensation Management (ICM) to include comprehensive Sales Performance Management (SPM).
- June 2025: Fullcast successfully acquired Commissionly, incorporating Commissionly's user-friendly, automated solutions for compensation management and commission monitoring into Fullcast's RevOps platform. This acquisition represents a significant advancement in Fullcast's goal to integrate all facets of GTM operations, upgrading it from a RevOps solution into an integrated sales performance management platform.
- March 2025: Xactly introduced Xactly Intelligence, a platform that combines cutting-edge Generative AI capabilities with Xactly's distinguished Predictive AI models, to transform the sales performance management landscape completely. This innovation represents a significant turning point in Xactly's dedication to achieving the future of AI-first sales performance, establishing the foundation for integrating Agentic AI capabilities across the revenue lifecycle.
- October 2024: Everstage, a renowned provider of sales performance management solutions, successfully secured USD 30 Million in a Series-B funding round, bringing Everstage’s total financing to USD 45 Million. With this funding, the company will be able to further invest in product innovation and provide the best possible customer service.
- December 2023: beqom, a provider of compensation and performance management solutions, announced that it intends to acquire innovative pay and workplace equity software startup PayAnalytics. This acquisition is expected to integrate advanced pay equity analytics with core compensation processes, thus enabling companies to create a culture of fair pay while complying with global wage fairness regulations. This also positions beqom uniquely in the market as a provider of the most complete advanced total compensation and pay equity solution.
- October 2023: Axtria Inc. received recognition for six technologies in the Gartner, Hype CycleTM for Life Sciences (LS) Commercial Operations for 2023. Hype Cycle offers CIOs strategic guidance by monitoring the adoption and maturity rates of important technologies, which helps direct investments and planning for commercialization.
Sales Performance Management Market Report Scope:
| Report Features | Details |
|---|---|
| Base Year of the Analysis | 2025 |
| Historical Period | 2020-2025 |
| Forecast Period | 2026-2034 |
| Units | Billion USD |
| Scope of the Report |
Exploration of Historical Trends and Market Outlook, Industry Catalysts and Challenges, Segment-Wise Historical and Future Market Assessment:
|
| Solutions Covered | Territory Management, Sales Analytics, Sales Planning and Monitoring, Incentive Compensation Management, Others |
| Services Covered | Consulting Services, Managed Services, Training and Support, Others |
| Organization Sizes Covered | Small and Medium-sized Enterprises, Large Enterprises |
| Deployment Models Covered | On-premises, Cloud-based |
| End Users Covered | BFSI, IT and Telecom, Retail, Energy and Utilities, Travel and Hospitality, Transportation and Logistics, Healthcare, Others |
| Regions Covered | Asia Pacific, Europe, North America, Latin America, Middle East and Africa |
| Countries Covered | United States, Canada, Germany, France, United Kingdom, Italy, Spain, Russia, China, Japan, India, South Korea, Australia, Indonesia, Brazil, Mexico |
| Companies Covered | Anaplan Inc., Axtria Inc., beqom SA, Iconixx Software Corporation, International Business Machines Corporation, Microsoft Corporation, NICE Ltd., Oracle Corporation, Salesforce.com Inc., SAP SE, Xactly Corporation, etc. |
| Customization Scope | 10% Free Customization |
| Post-Sale Analyst Support | 10-12 Weeks |
| Delivery Format | PDF and Excel through Email (We can also provide the editable version of the report in PPT/Word format on special request) |
Key Benefits for Stakeholders:
- IMARC’s industry report offers a comprehensive quantitative analysis of various market segments, historical and current market trends, market forecasts, and dynamics of the sales performance management market from 2020-2034.
- The research report provides the latest information on the market drivers, challenges, and opportunities in the global sales performance management market.
- The study maps the leading, as well as the fastest-growing, regional markets. It further enables stakeholders to identify the key country-level markets within each region.
- Porter's five forces analysis assists stakeholders in assessing the impact of new entrants, competitive rivalry, supplier power, buyer power, and the threat of substitution. It helps stakeholders to analyze the level of competition within the sales performance management industry and its attractiveness.
- The competitive landscape allows stakeholders to understand their competitive environment and provides insight into the current positions of key players in the market.
Frequently Asked Questions About the Sales Performance Management Market Report
The sales performance management market was valued at USD 6.4 Billion in 2025.
The sales performance management market is projected to exhibit a CAGR of 12.74% during 2026-2034, reaching a value of USD 19.3 Billion by 2034.
Key factors driving the sales performance management market include the growing need for improved sales efficiency, increased adoption of data-driven decision-making, integration with CRM and ERP systems, and advancements in AI and machine learning. These enable better performance tracking, automation, and strategic alignment of sales processes.
North America currently dominates the sales performance management market, accounting for a share of 40.6% due to its advanced technological infrastructure, early adoption of cloud-based solutions, and strong focus on sales optimization. The presence of major market players and growing demand for data-driven tools further support regional market leadership.
Some of the major players in the Sales Performance Management market include Anaplan Inc., Axtria Inc., beqom SA, Iconixx Software Corporation, International Business Machines Corporation, Microsoft Corporation, NICE Ltd., Oracle Corporation, Salesforce.com Inc., SAP SE, Xactly Corporation, etc.
Need more help?
- Speak to our experienced analysts for insights on the current market scenarios.
- Include additional segments and countries to customize the report as per your requirement.
- Gain an unparalleled competitive advantage in your domain by understanding how to utilize the report and positively impacting your operations and revenue.
- For further assistance, please connect with our analysts.
 Request Customization
 Speak to an Analyst
 Request Brochure
 Inquire Before Buying
Benefits of Customization
- Personalize this research
- Triangulate with your data
- Get data as per your format and definition
- Gain a deeper dive into a specific application, geography, customer, or competitor
- Any level of personalization
Get in Touch With Us
UNITED STATES
Phone: +1-201-971-6302
INDIA
Phone: +91-120-433-0800
UNITED KINGDOM
Phone: +44-753-714-6104
Email: [email protected]
Client Testimonials


.webp)


