
Samarium Prices, Trend, Chart, Demand, Market Analysis, News, Historical and Forecast Data Report 2026 Edition
Samarium Price Trend, Index and Forecast
Track real-time and historical samarium prices across global regions. Updated monthly with market insights, drivers, and forecasts.
Samarium Prices June 2026
| Region | Price (USD/Kg) | Latest Movement |
|---|---|---|
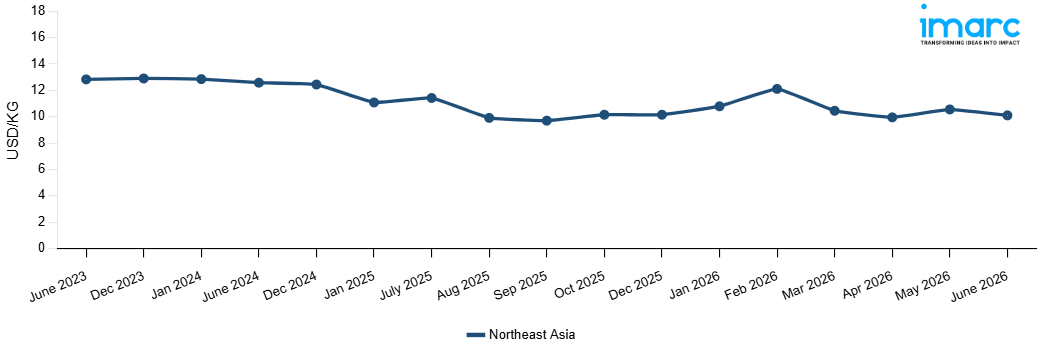
| Northeast Asia | 10.1 | -4.3% ↓ Down |
Samarium Price Index (USD/KG):
The chart below highlights monthly samarium prices across different regions.
Get Access to Monthly/Quarterly/Yearly Prices, Request Sample
Market Overview Q1 Ending March 2026
Northeast Asia: The samarium prices in Northeast Asia reached 10.45 USD/KG in March 2026. The upward pricing movement registered between December and March 2026 was 3.0%. Marginally firming demand from the permanent magnet, nuclear reactor, and specialty catalyst manufacturing sectors provided modest procurement support and contributed to mildly bullish conditions across Northeast Asian markets during the review period. Slightly elevated upstream rare earth ore mining and separation costs at regional production facilities exerted incremental upward pressure on samarium manufacturing expenses and supported the prevailing marginal price increase throughout the quarter. Steady domestic production from Chinese rare earth mining and separation facilities maintained an adequate supply and limited upward price movement during the period. Measured restocking activity by downstream magnet and specialty catalyst buyers, reflecting cautious but positive market sentiment, contributed to the prevailing mildly bullish pricing conditions throughout the review period.
Market Overview Q4 Ending December 2025
Northeast Asia: The samarium prices in Northeast Asia reached 10.15 USD/KG in December 2025. The upward pricing movement registered between September and December 2025 was 4.6%. The fabrication of defense electronics and samarium cobalt permanent magnets, which had strong procurement activity throughout the quarter, were the key drivers of the slight price increase. Regional refiners' production costs increased due to higher upstream rare earth ore mining and separation processing prices, which reinforced upward pricing dynamics. Excess market availability was avoided by maintaining balanced supply demand dynamics through controlled production output from dominating extraction and processing plants. Firm offtake fundamentals were also maintained by consistent consumption from the aerospace guidance system, precision instrument, and high temperature motor segments, while procurement competition increased due to tightening supply conditions and recurring production adjustments at key separation facilities related to environmental compliance. Purchasing activity was further strengthened by downstream magnet makers' strategic inventory buildup in anticipation of future regulatory changes, which maintained a somewhat optimistic pricing trend throughout the quarter.
Market Overview Q3 Ending September 2025
Northeast Asia: Key factors influencing the trend included a moderate slowdown in demand from high-tech manufacturing sectors, particularly in magnet and electronics production. Supply-side dynamics were affected by reduced exports from local producers due to temporary maintenance at processing facilities. Cost components, such as international shipping and port handling, remained relatively stable; however, fluctuations in regional currency exchange rates slightly impacted import costs. Domestic logistics constraints, including increased transportation fees and limited warehousing availability, also contributed to marginal price adjustments.
Samarium Price Trend, Market Analysis, and News
IMARC's latest publication, “Samarium Prices, Trend, Chart, Demand, Market Analysis, News, Historical and Forecast Data Report 2026 Edition,” presents a detailed examination of the samarium market, providing insights into both global and regional trends that are shaping prices. This report delves into the spot price of samarium at major ports and analyzes the composition of prices, including FOB and CIF terms. It also presents detailed samarium prices trend analysis by region, covering North America, Europe, Asia Pacific, Latin America, and Middle East and Africa. The factors affecting samarium pricing, such as the dynamics of supply and demand, geopolitical influences, and sector-specific developments, are thoroughly explored. This comprehensive report helps stakeholders stay informed with the latest market news, regulatory updates, and technological progress, facilitating informed strategic decision-making and forecasting.
Samarium Industry Analysis
The global samarium industry size reached 2,458.1 Tons in 2025. By 2034, IMARC Group expects the market to reach 3,183.7 Tons, at a projected CAGR of 2.83% during 2026-2034. The market is driven by the increasing demand for rare earth magnets in electronics and automotive sectors, advancements in green technologies, expanding renewable energy applications, and ongoing research in high performance materials requiring samarium based compounds.
Latest developments in the samarium industry:
- September 2025: Permag, a US-based producer of samarium cobalt (SmCo) magnets, announced a multi-million-dollar investment to double its production capacity at the Electron Energy Corporation facility in Lancaster, Pennsylvania. This expansion aims to bolster the domestic supply chain for critical magnets and components, addressing the growing demand from defense, clean energy, and high-tech industries.
- June 2024: Nissan Motor's goal to drive down the cost of electric vehicles is expected to hinge on a motor magnet it created using inexpensive material, samarium-iron, a rare-earth alloy. The Japanese automaker plans to bring the magnet to commercial feasibility by fiscal year 2030, which ends March 2031.
- May 2024: The Leningrad NPP (a branch of Rosenergoatom JSC, Rosatom Power Division) included samarium-153 in the range of isotopes produced for medical purposes. Today, radiopharmaceuticals with samarium-153 are widely used in palliative care to relieve pain that occurs with bone metastases, as well as in traumatology in the case of chronic musculoskeletal diseases. Samarium-153 isotope treatment can make it possible to avoid opioid analgesic use, while also inhibiting the progression of bone metastases and ensuring a lasting pain relief.
Product Description
Samarium is a metallic rare-earth element with silvery-white appearance, classified among the lanthanides. It is recognized for its magnetic properties, particularly in high-strength permanent magnets, and plays a significant role in the global rare-earth consumption hierarchy. Samarium is extensively used in manufacturing high-performance magnets for electric vehicles, wind turbines, and electronic devices. Its unique ability to retain magnetism at elevated temperatures enhances product efficiency and reliability, making it essential in critical industrial and technological applications.
Report Coverage
| Key Attributes | Details |
|---|---|
| Product Name | Samarium |
| Report Features | Exploration of Historical Trends and Market Outlook, Industry Demand, Industry Supply, Gap Analysis, Challenges, Samarium Price Analysis, and Segment-Wise Assessment. |
| Currency/Units | US$ (Data can also be provided in local currency) or Metric Tons |
| Region/Countries Covered | The current coverage includes analysis at the global and regional levels only. Based on your requirements, we can also customize the report and provide specific information for the following countries: Asia Pacific: China, India, Indonesia, Pakistan, Bangladesh, Japan, Philippines, Vietnam, Thailand, South Korea, Malaysia, Nepal, Taiwan, Sri Lanka, Hongkong, Singapore, Australia, and New Zealand Europe: Germany, France, United Kingdom, Italy, Spain, Russia, Turkey, Netherlands, Poland, Sweden, Belgium, Austria, Ireland, Switzerland, Norway, Denmark, Romania, Finland, Czech Republic, Portugal and Greece North America: United States and Canada Latin America: Brazil, Mexico, Argentina, Columbia, Chile, Ecuador, and Peru Middle East & Africa: Saudi Arabia, UAE, Israel, Iran, South Africa, Nigeria, Oman, Kuwait, Qatar, Iraq, Egypt, Algeria, and Morocco The list of countries presented is not exhaustive. Information on additional countries can be provided if required by the client. |
| Information Covered for Key Suppliers |
|
| Customization Scope | The report can be customized as per the requirements of the customer |
| Report Price and Purchase Option |
Plan A: Monthly Updates - Annual Subscription
Plan B: Quarterly Updates - Annual Subscription
Plan C: Biannually Updates - Annual Subscription
|
| Post-Sale Analyst Support | 360-degree analyst support after report delivery |
| Delivery Format | PDF and Excel through email (We can also provide the editable version of the report in PPT/Word format on special request) |
Key Benefits for Stakeholders:
- IMARC’s report presents a detailed analysis of samarium pricing, covering global and regional trends, spot prices at key ports, and a breakdown of FOB and CIF prices.
- The study examines factors affecting samarium price trend, including input costs, supply-demand shifts, and geopolitical impacts, offering insights for informed decision-making.
- The competitive landscape review equips stakeholders with crucial insights into the latest market news, regulatory changes, and technological advancements, ensuring a well-rounded, strategic overview for forecasting and planning.
- IMARC offers various subscription options, including monthly, quarterly, and biannual updates, allowing clients to stay informed with the latest market trends, ongoing developments, and comprehensive market insights. The samarium price charts ensure our clients remain at the forefront of the industry.
Frequently Asked Questions About the Samarium Price Trend Report
The samarium price in June 2026 was 10.1 USD/Kg in Northeast Asia.
The samarium pricing data is updated on a monthly basis.
We provide the pricing data primarily in the form of an Excel sheet and a PDF.
Yes, our report includes a forecast for samarium prices.
The regions covered include North America, Europe, Asia Pacific, Middle East, and Latin America. Countries can be customized based on the request (additional charges may be applicable).
Yes, we provide both FOB and CIF prices in our report.
Need more help?
- Speak to our experienced analysts for insights on the current market scenarios.
- Include additional segments and countries to customize the report as per your requirement.
- Gain an unparalleled competitive advantage in your domain by understanding how to utilize the report and positively impacting your operations and revenue.
- For further assistance, please connect with our analysts.
 Request Customization
 Inquire Before Buying
 Speak to an Analyst
 Request Brochure
Benefits of Customization
- Personalize this research
- Triangulate with your data
- Get data as per your format and definition
- Gain a deeper dive into a specific application, geography, customer, or competitor
- Any level of personalization
Get in Touch With Us
UNITED STATES
Phone: +1-201-971-6302
INDIA
Phone: +91-120-433-0800
UNITED KINGDOM
Phone: +44-753-714-6104
Email: [email protected]
Client Testimonials


.webp)


Why Choose Us
IMARC offers trustworthy, data-centric insights into commodity pricing and evolving market trends, enabling businesses to make well-informed decisions in areas such as procurement, strategic planning, and investments. With in-depth knowledge spanning more than 1000 commodities and a vast global presence in over 150 countries, we provide tailored, actionable intelligence designed to meet the specific needs of diverse industries and markets.
1000
+Commodities
150
+Countries Covered
3000
+Clients
20
+Industry
Robust Methodologies & Extensive Resources
IMARC delivers precise commodity pricing insights using proven methodologies and a wealth of data to support strategic decision-making.
Subscription-Based Databases
Our extensive databases provide detailed commodity pricing, import-export trade statistics, and shipment-level tracking for comprehensive market analysis.
Primary Research-Driven Insights
Through direct supplier surveys and expert interviews, we gather real-time market data to enhance pricing accuracy and trend forecasting.
Extensive Secondary Research
We analyze industry reports, trade publications, and market studies to offer tailored intelligence and actionable commodity market insights.
Trusted by 3000+ industry leaders worldwide to drive data-backed decisions. From global manufacturers to government agencies, our clients rely on us for accurate pricing, deep market intelligence, and forward-looking insights.