
Silver Prices, Trend, Chart, Demand, Market Analysis, News, Historical and Forecast Data Report 2025 Edition
Silver Price Trend, Index and Forecast
Track real-time and historical silver prices across global regions. Updated monthly with market insights, drivers, and forecasts.
Silver Prices October 2025
| Region | Price (USD/KG) | Latest Movement |
|---|---|---|
| Northeast Asia | 1126.08 | 1.8% ↑ Up |
| India | 1033.52 | 1.8% ↑ Up |
| Europe | 1054.19 | 1.8% ↑ Up |
| Southeast Asia | 1007.38 | 1.5% ↑ Up |
| North America | 1069.34 | 1.8% ↑ Up |
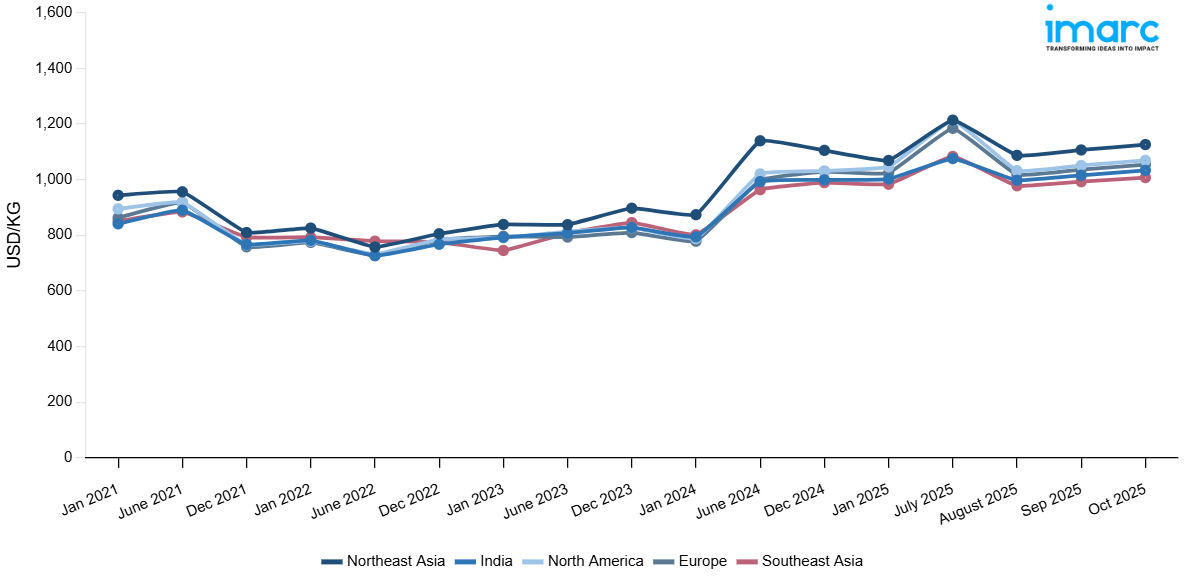
Silver Price Index (USD/KG):
The chart below highlights monthly silver prices across different regions.
Get Access to Monthly/Quaterly/Yearly Prices, Request Sample
Market Overview Q3 Ending September 2025
Northeast Asia: A number of factors, including strong demand from important industrial sectors in nations like China, South Korea, and Japan, contributed to the price increase. The price was further raised by supply-side factors like delays in transit and growing raw material prices. Another factor was the rising demand for silver in high-tech sectors, especially in the manufacturing of electronics and solar panels. The cost dynamics of importing silver were affected by currency movements, particularly the depreciation of the Japanese yen relative to the US dollar, which resulted in higher local pricing. Besides logistical issues, such as rising shipping costs and port congestion, also had a big impact on final pricing.
India: Silver prices increased in India as well. This was primarily due to growing demand in the jewelry sector, which remains one of India’s largest consumers of silver. Moreover, the Indian government's push towards promoting solar energy further bolstered silver consumption in the manufacturing of photovoltaic cells. Supply-side factors, including import restrictions and rising customs duties on precious metals, contributed to higher costs. Additionally, a weakening Indian Rupee against the US Dollar made silver imports more expensive, further pushing domestic prices higher. The festive season, starting to ramp up in late Q3, also drove demand in the retail market, creating upward pressure on prices.
Europe: One of the key drivers in this region was the significant demand for silver in industrial applications, particularly in the automotive and renewable energy sectors. As European nations push forward with green energy initiatives, silver is increasingly being used in the production of electric vehicle batteries and solar panels. Moreover, geopolitical tensions and inflationary pressures across the Eurozone led to increased investment in silver as a safe-haven asset. Supply disruptions, particularly from key mining regions, were exacerbated by logistical delays and higher shipping costs, further influencing price increases. Additionally, the euro's relative depreciation against the dollar contributed to the rise in silver prices, making it more expensive for European buyers.
Southeast Asia: The increase can be attributed to a combination of factors, including the growing demand for silver in electronics, as major producers like China and Taiwan continue to invest heavily in high-tech industries. The demand from jewelry sectors in Thailand and Indonesia remained stable, though not as robust as in India. Rising logistics costs, particularly due to port congestion and shipping delays, played a key role in pushing up silver prices across the region. Furthermore, fluctuations in the value of regional currencies, such as the Indonesian Rupiah and Malaysian Ringgit, contributed to higher import costs, indirectly driving prices upwards. The regional supply chain challenges, coupled with global economic pressures, resulted in a relatively slower price growth in Southeast Asia compared to other regions.
North America: In North America, silver prices saw an increase. The increase was mainly driven by the rising demand from the electronics industry, particularly for silver used in the production of advanced electronic components and renewable energy technologies. The growing push for green energy solutions in the US and Canada has been a major contributor to silver consumption in solar panels and electric vehicle batteries. Additionally, inflationary pressures and supply chain disruptions from key mining regions like Mexico have affected silver availability, pushing up prices. Furthermore, the strengthening of the US Dollar, relative to other global currencies, made imports more expensive, contributing to higher silver prices in the region. As a result, silver's role as both an industrial metal and a safe-haven investment led to its price rise in North America.
Silver Price Trend, Market Analysis, and News
IMARC's latest publication, “Silver Prices, Trend, Chart, Demand, Market Analysis, News, Historical and Forecast Data Report 2025 Edition,” presents a detailed examination of the silver market, providing insights into both global and regional trends that are shaping prices. This report delves into the spot price of silver at major ports and analyzes the composition of prices, including FOB and CIF terms. It also presents detailed silver prices trend analysis by region, covering North America, Europe, Asia Pacific, Latin America, and Middle East and Africa. The factors affecting silver pricing, such as the dynamics of supply and demand, geopolitical influences, and sector-specific developments, are thoroughly explored. This comprehensive report helps stakeholders stay informed with the latest market news, regulatory updates, and technological progress, facilitating informed strategic decision-making and forecasting.
Silver Industry Analysis
The global silver industry size reached 26,702.00 Tons in 2024. By 2033, IMARC Group expects the market to reach 33,937.33 Tons, at a projected CAGR of 2.57% during 2025-2033. The market is driven by the increasing demand for silver in renewable energy applications, particularly solar panels, the growing use of silver in electric vehicle batteries, strong investment interest as a safe-haven asset, and rising industrial demand across electronics and medical sectors.
Latest developments in the silver industry:
- September 2025: Vizsla Silver Corp. announced the successful execution of a mandate letter with Macquarie Bank Limited, which will serve as the lead arranger for a senior secured project finance facility. The financing, totaling up to US$ 220 million, will be used to fund the construction and development of the high-grade underground Panuco silver-gold project, located in Sinaloa, Mexico. The Panuco project is a significant silver-gold exploration and development asset in Mexico, known for its high-grade mineralization.
- May 2024: India imported more silver in 4 months of 2024 than in all of 2023. The nation imported 4,172 metric tons of silver during January to April, up from 455 tons in the same period.
Product Description
Silver is a precious metallic element, characterized by its high reflectivity, conductivity, and malleability. It holds a critical position in global production and consumption due to its significant industrial applications. Silver’s defining attribute is its unparalleled conductivity, making it an essential component in electrical, electronics, and photovoltaic applications. Beyond these sectors, silver plays a vital role in jewelry and investment markets. Its unique properties also extend to medical technologies, where it is used in wound care and antimicrobial applications. Silver’s versatility and importance in high-tech industries ensure its continued relevance in global markets.
Report Coverage
| Key Attributes | Details |
|---|---|
| Product Name | Silver |
| Report Features | Exploration of Historical Trends and Market Outlook, Industry Demand, Industry Supply, Gap Analysis, Challenges, Silver Price Analysis, and Segment-Wise Assessment. |
| Currency/Units | US$ (Data can also be provided in local currency) or Metric Tons |
| Region/Countries Covered | The current coverage includes analysis at the global and regional levels only. Based on your requirements, we can also customize the report and provide specific information for the following countries: Asia Pacific: China, India, Indonesia, Pakistan, Bangladesh, Japan, Philippines, Vietnam, Thailand, South Korea, Malaysia, Nepal, Taiwan, Sri Lanka, Hongkong, Singapore, Australia, and New Zealand* Europe: Germany, France, United Kingdom, Italy, Spain, Russia, Turkey, Netherlands, Poland, Sweden, Belgium, Austria, Ireland, Switzerland, Norway, Denmark, Romania, Finland, Czech Republic, Portugal and Greece* North America: United States and Canada Latin America: Brazil, Mexico, Argentina, Columbia, Chile, Ecuador, and Peru* Middle East & Africa: Saudi Arabia, UAE, Israel, Iran, South Africa, Nigeria, Oman, Kuwait, Qatar, Iraq, Egypt, Algeria, and Morocco* *The list of countries presented is not exhaustive. Information on additional countries can be provided if required by the client. |
| Information Covered for Key Suppliers |
|
| Customization Scope | The report can be customized as per the requirements of the customer |
| Report Price and Purchase Option |
Plan A: Monthly Updates - Annual Subscription
Plan B: Quarterly Updates - Annual Subscription
Plan C: Biannually Updates - Annual Subscription
|
| Post-Sale Analyst Support | 360-degree analyst support after report delivery |
| Delivery Format | PDF and Excel through email (We can also provide the editable version of the report in PPT/Word format on special request) |
Key Benefits for Stakeholders:
- IMARC’s report presents a detailed analysis of silver pricing, covering global and regional trends, spot prices at key ports, and a breakdown of ex-works, FOB, and CIF prices.
- The study examines factors affecting silver price trend, including supply-demand shifts and geopolitical impacts, offering insights for informed decision-making.
- The competitive landscape review equips stakeholders with crucial insights into the latest market news, regulatory changes, and technological advancements, ensuring a well-rounded, strategic overview for forecasting and planning.
- IMARC offers various subscription options, including monthly, quarterly, and biannual updates, allowing clients to stay informed with the latest market trends, ongoing developments, and comprehensive market insights. The silver price charts ensure our clients remain at the forefront of the industry.
Frequently Asked Questions About the Silver Price Chart 2025 Report
The silver prices in October 2025 were 1,126.08 USD/KG in Northeast Asia, 1,033.52 USD/KG in India, 1,054.19 USD/KG in Europe, 1,007.38 USD/KG in Southeast Asia, and 1,069.34 USD/KG in North America.
The silver pricing data is updated on a monthly basis.
We provide the pricing data primarily in the form of an Excel sheet and a PDF.
Yes, our report includes a forecast for silver prices.
The regions covered include North America, Europe, Asia Pacific, Middle East, and Latin America. Countries can be customized based on the request (additional charges may be applicable).
Yes, we provide both FOB and CIF prices in our report.
Need more help?
- Speak to our experienced analysts for insights on the current market scenarios.
- Include additional segments and countries to customize the report as per your requirement.
- Gain an unparalleled competitive advantage in your domain by understanding how to utilize the report and positively impacting your operations and revenue.
- For further assistance, please connect with our analysts.
 Request Customization
 Inquire Before Buying
 Speak to an Analyst
 Request Brochure
Benefits of Customization
- Personalize this research
- Triangulate with your data
- Get data as per your format and definition
- Gain a deeper dive into a specific application, geography, customer, or competitor
- Any level of personalization
Get in Touch With Us
UNITED STATES
Phone: +1-201-971-6302
INDIA
Phone: +91-120-433-0800
UNITED KINGDOM
Phone: +44-753-714-6104
Email: [email protected]
Client Testimonials


.webp)


Why Choose Us
IMARC offers trustworthy, data-centric insights into commodity pricing and evolving market trends, enabling businesses to make well-informed decisions in areas such as procurement, strategic planning, and investments. With in-depth knowledge spanning more than 1000 commodities and a vast global presence in over 150 countries, we provide tailored, actionable intelligence designed to meet the specific needs of diverse industries and markets.
1000
+Commodities
150
+Countries Covered
3000
+Clients
20
+Industry
Robust Methodologies & Extensive Resources
IMARC delivers precise commodity pricing insights using proven methodologies and a wealth of data to support strategic decision-making.
Subscription-Based Databases
Our extensive databases provide detailed commodity pricing, import-export trade statistics, and shipment-level tracking for comprehensive market analysis.
Primary Research-Driven Insights
Through direct supplier surveys and expert interviews, we gather real-time market data to enhance pricing accuracy and trend forecasting.
Extensive Secondary Research
We analyze industry reports, trade publications, and market studies to offer tailored intelligence and actionable commodity market insights.
Trusted by 3000+ industry leaders worldwide to drive data-backed decisions. From global manufacturers to government agencies, our clients rely on us for accurate pricing, deep market intelligence, and forward-looking insights.