
Smart Demand Response Market Size, Share, Trends and Forecast by Application and Region, 2026-2034
Smart Demand Response Market Size and Share:
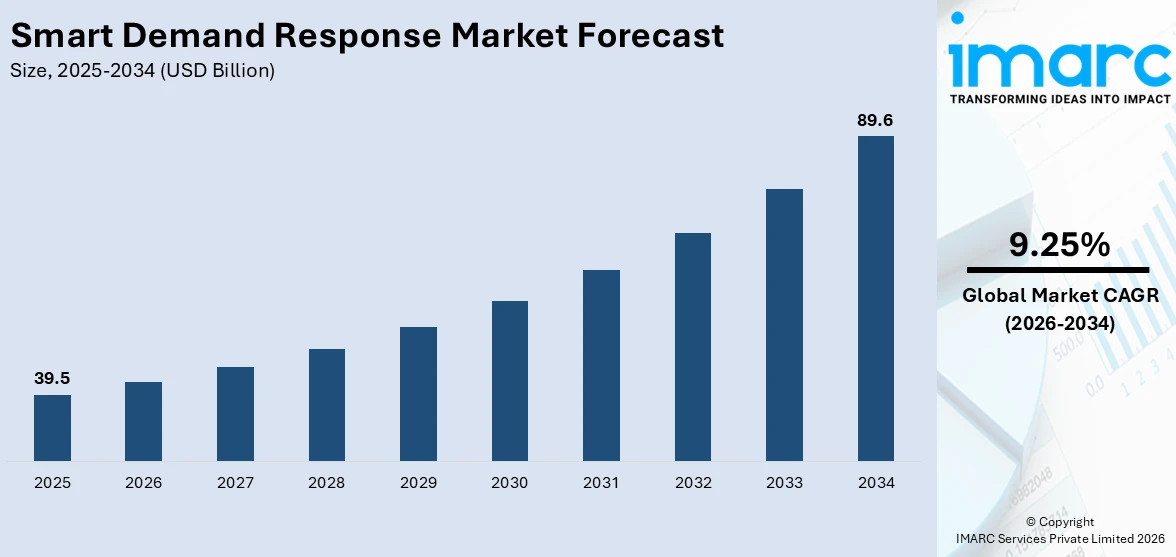
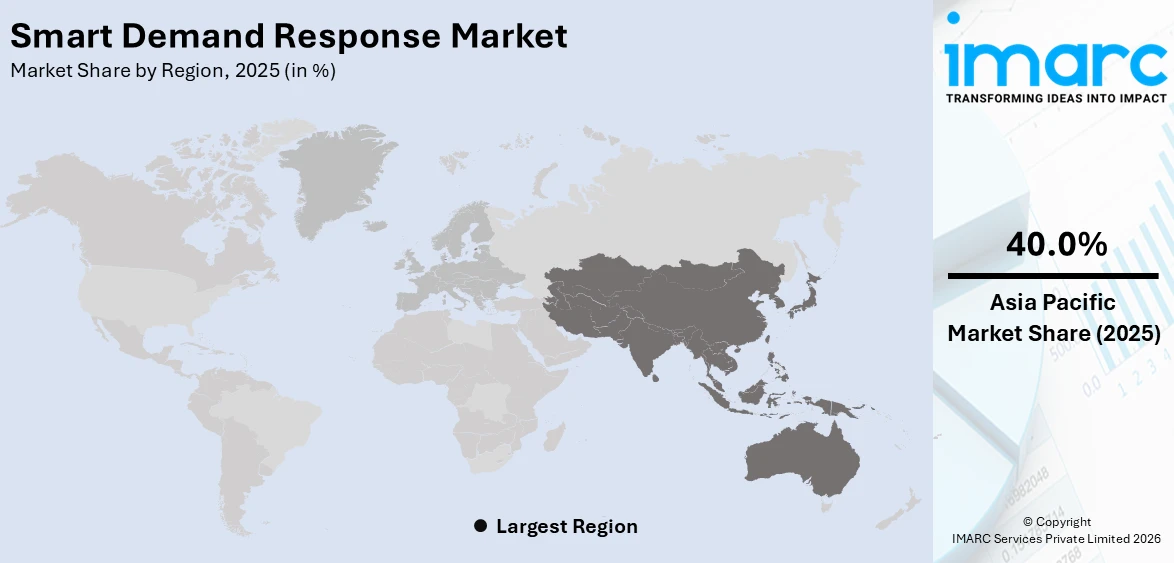
The global smart demand response market size was valued at USD 39.5 Billion in 2025. Looking forward, IMARC Group estimates the market to reach USD 89.6 Billion by 2034, exhibiting a CAGR of 9.25% during 2026-2034. Asia-Pacific currently dominates the market, holding a significant market share of over 40.0% in 2025. This is due to fast urbanization, increasing power consumption, and supportive government policies towards smart grid technologies. Increased adoption of IoT and smart meters in countries like China, Japan, and South Korea also fuels the industry. This leads to a dominant smart demand response market share.
|
Report Attribute
|
Key Statistics
|
|---|---|
|
Base Year
|
2025 |
|
Forecast Years
|
2026-2034
|
|
Historical Years
|
2020-2025
|
| Market Size in 2025 | USD 39.5 Billion |
| Market Forecast in 2034 | USD 89.6 Billion |
| Market Growth Rate (2026-2034) | 9.25% |
The market is propelled by the rising penetration of advanced metering infrastructure (AMI) and the growing use of cloud-based energy management platforms. For instance, 75F offers an AI-enabled smart Automated Demand Response (ADR) solution that optimizes energy use in commercial buildings by prioritizing real-time occupancy and air quality. Their low-cost system integrates with existing HVAC equipment to reduce peak energy consumption without compromising comfort. Unlike traditional ADR, it addresses occupant needs by targeting occupied zones during load-shed events. The cloud-based solution requires no extra hardware and helps utilities and customers save money through efficient energy management. The increasing complexity of modern power systems, coupled with the need for real-time load balancing, is driving adoption across utilities. The emergence of dynamic pricing models and time-of-use tariffs is encouraging both commercial and residential users to engage in demand response programs. Additionally, the proliferation of connected devices and edge computing is enabling granular control over electricity usage. Government-backed incentives for energy efficiency and the development of cross-border energy networks in Europe and Asia further reinforce the market’s upward trajectory.
To get more information on this market Request Sample
In the United States, the smart demand response market growth is being driven by regulatory mandates aimed at reducing peak demand and improving grid reliability. Increasing integration of decentralized energy resources, including rooftop solar and battery storage systems, has elevated the importance of responsive load management. The rising adoption of electric vehicles (EVs) is creating new demand profiles that require flexible, intelligent energy systems. Utility investments in grid modernization, combined with Federal Energy Regulatory Commission (FERC) policies promoting open access to demand response participation, are strengthening the market foundation. Furthermore, growing corporate sustainability initiatives and participation in capacity markets by industrial consumers are bolstering the expansion of smart demand response programs. For instance, in May 2024, Honeywell and Enel North America partnered to automate demand response (DR) processes via Honeywell’s building automation systems and Enel’s FlexUp program. This allows commercial and industrial facilities to reduce peak energy use without manual intervention, improving grid reliability and cutting energy costs. The system targets distributed energy challenges from solar, EVs, and storage. Automation enhances DR participation, especially as buildings represent ~30% of global energy use.
Smart Demand Response Market Trends:
Growing Energy Demand and Climate-Driven Load Pressures
The global smart demand response market outlook remains positive due to surging electricity consumption, largely driven by extreme weather conditions. Rising global temperatures and intensified heatwaves are increasing the need for cooling, putting immense pressure on aging power infrastructure. In response, utilities are turning to smart demand response systems to manage peak load stress, balance demand fluctuations, and avoid blackouts. These systems optimize power flow during critical periods by leveraging automated load adjustments and demand-shifting strategies. This trend is especially pronounced in developing economies, where urban expansion is rapidly escalating energy demand. According to reports, global electricity demand rose by 4.0% in 2024, further emphasizing the urgency for scalable, intelligent energy management solutions.
Integration of Smart Grids with IoT and Cloud Technologies
Smart grid expansion is being strategically aligned with IoT and cloud-integrated demand response systems to create more responsive and efficient energy ecosystems. These integrations enable real-time monitoring, predictive analytics, and remote control of consumer-side energy usage. The adoption of smart thermostats, lighting systems, and HVAC controls embedded with intelligent sensors is enhancing end-user participation in demand-side management. This interconnected infrastructure not only improves energy efficiency but also provides grid operators with the flexibility to respond swiftly to load variability. The seamless communication between devices and central systems facilitates real-time pricing adjustments and optimizes consumption based on system constraints. Smart thermostats, for example, can reduce annual heating and cooling costs by 10–12%, according to the U.S. Department of Energy.
Policy-Driven Investments and Market Liberalization
Governments and regulatory bodies across regions represent one of the crucial smart demand response market trends through favorable policies and large-scale infrastructure funding. These initiatives aim to modernize outdated grid systems and promote decentralized, consumer-centric power models. In Europe, robust legislative frameworks support open access to demand response programs and provide incentives for digital grid enhancements. The European Union, for instance, has committed to substantial grid modernization, focusing heavily on digital distribution networks and demand-side solutions. This policy backing not only ensures regulatory certainty for investors but also accelerates the deployment of next-gen technologies across utilities. The EU plans to invest EUR 584 billion (USD 633 billion) in electricity grids by 2030, including EUR 170 billion (USD 184 billion) specifically for digitalization.
Smart Demand Response Industry Segmentation:
IMARC Group provides an analysis of the key trends in each segment of the global smart demand response market, along with forecasts at the global, regional, and country levels from 2026-2034. The market has been categorized based on application.
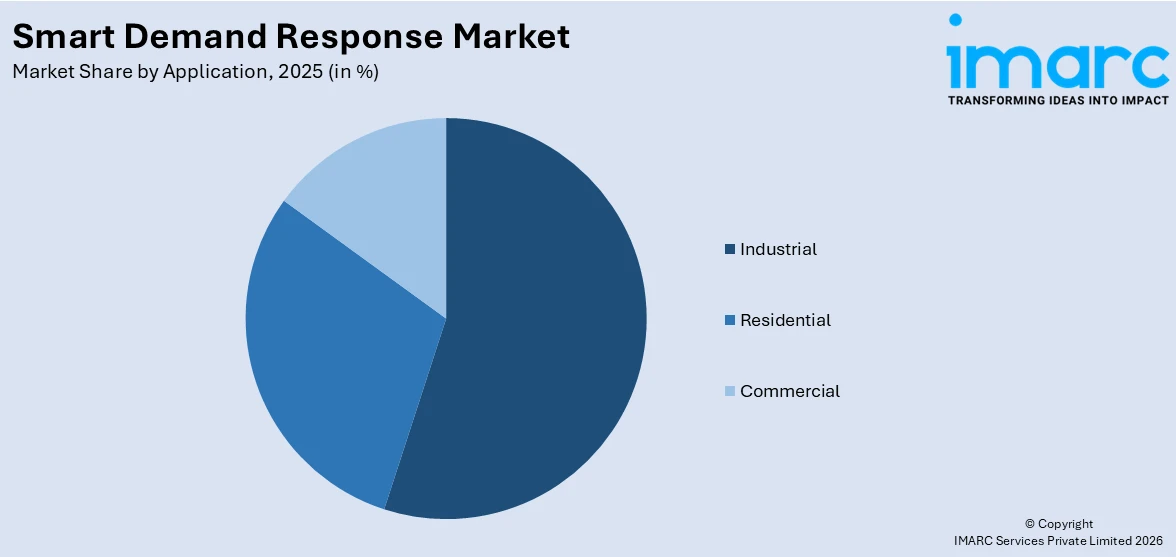
Analysis by Application:
Access the comprehensive market breakdown Request Sample
- Residential
- Commercial
- Industrial
Industrial leads the market with around 53.2% of market share in 2025. The industrial segment dominates the smart demand response market due to its high and consistent energy consumption, which presents significant opportunities for load shifting and cost savings. Industrial facilities often operate heavy machinery and energy-intensive processes, making them ideal candidates for demand response participation. These enterprises benefit from flexible load management, reduced peak demand charges, and enhanced grid stability. Moreover, industries are increasingly adopting automation, IoT-based energy monitoring systems, and real-time analytics, enabling seamless integration with demand response platforms. Regulatory incentives and time-based pricing models further encourage industrial players to engage in smart demand response programs, reinforcing their leadership in market participation.
Regional Analysis:
To get more information on the regional analysis of this market Request Sample
- North America
- United States
- Canada
- Asia-Pacific
- China
- Japan
- India
- South Korea
- Australia
- Indonesia
- Others
- Europe
- Germany
- France
- United Kingdom
- Italy
- Spain
- Russia
- Others
- Latin America
- Brazil
- Mexico
- Others
- Middle East and Africa
In 2025, Asia-Pacific accounted for the largest market share of over 40.0%. Asia-Pacific dominates the smart demand response market due to its rapid urbanization, escalating energy demand, and significant investments in smart grid infrastructure. The Asia Pacific grid modernization market was valued at USD 12,683.42 Million in 2024 and is projected to grow to USD 51,572.06 Million by 2032, reflecting a CAGR of 19.16% over the forecast period from 2024 to 2032. Countries like China, India, Japan, and South Korea are leading large-scale deployments of advanced metering infrastructure and grid modernization projects. Government initiatives focused on energy efficiency, emissions reduction, and the integration of renewable energy sources have accelerated the adoption of demand response technologies. Additionally, rising incidences of extreme weather events, such as heatwaves, are intensifying power loads, prompting utilities to adopt flexible demand management solutions. The region's strong industrial base and expanding residential sectors further contribute to its dominant smart demand response market share.
Key Regional Takeaways:
United States Smart Demand Response Market Analysis
The United States smart demand response market is primarily driven by the rapid integration of renewable energy sources such as wind and solar. In line with this, the increasing electrification of transportation and building systems is straining grid infrastructure, prompting increased market demand. According to the U.S. Department of Transportation, in early 2020, state regulators authorized more than USD 760 Million in utility investments to advance transportation electrification, focusing mainly on utility-owned EVSE projects and “make-ready” site infrastructure enhancements. The various federal incentives, including provisions in the Inflation Reduction Act, are further accelerating product deployments. Furthermore, the widespread rollout of advanced metering infrastructure (AMI), enabling precise, real-time energy usage data, supporting dynamic load control, is impelling the market. The rising popularity of smart thermostats and connected home devices is encouraging consumer participation in demand response programs, fostering market expansion. Additionally, utility-led virtual power plant (VPP) initiatives aggregating distributed energy resources for grid reliability are stimulating market appeal. Apart from this, the continual technological advancements in AI and machine learning, enhancing predictive capabilities for load forecasting, are creating lucrative market opportunities.
Europe Smart Demand Response Market Analysis
The smart demand response market in Europe is experiencing growth due to the region’s ambitious decarbonization targets under the European Green Deal. In accordance with this, the expansion of cross-border energy trading frameworks supporting efficient load balancing across member states is propelling the market growth. Similarly, the widespread rollout of smart meters in countries like France, Spain, and Italy is facilitating real-time energy usage monitoring and consumer engagement. The UK government reported that by the end of 2024, Great Britain had installed 38 million smart and advanced meters in homes and small businesses, making up 66% of all meters, with 34 million (60%) functioning in smart mode. The increasing deployment of dynamic pricing models is incentivizing residential and commercial users to shift loads during peak hours, supporting market stability. Additionally, growing investments in distributed energy resources such as rooftop solar and battery storage are driving the need for responsive demand-side management. The rising penetration of heat pumps and EV charging infrastructure, elevating the importance of coordinated load control, is facilitating market expansion. Furthermore, various EU-funded innovation projects are accelerating demand response technology adoption, while enhanced cybersecurity frameworks are reinforcing digital trust across the energy sector.
Asia Pacific Smart Demand Response Market Analysis
The Asia Pacific market for smart demand response is significantly influenced by rising investments in advanced metering infrastructure. Similarly, rapid urbanization in nations such as India, China, and Vietnam are increasing the demand for intelligent grid systems to support expanding energy needs, which is impelling the market. The growing deployment of rooftop solar and distributed energy resources, promoting grid interactivity and responsiveness, is driving the market growth. As such, the PM Surya Ghar: Muft Bijli Yojana, launched in 2024, is nearing 9 lakh rooftop solar installations, empowering households across India to adopt clean energy solutions and significantly contributing to the nation’s renewable energy transition. Furthermore, the widespread use of electric vehicles, fueling the need for load balancing solutions through flexible demand management, is stimulating market accessibility. Moreover, favorable government initiatives such as Japan’s Green Transformation (GX) program and South Korea’s Smart Grid roadmap are accelerating higher regional adoption of the product.
Latin America Smart Demand Response Market Analysis
In Latin America, the market is expanding due to the rising integration of distributed energy resources, which require more flexible and responsive grid management. In addition to this, the increasing deployment of advanced metering infrastructure (AMI) is enabling real-time energy monitoring and supporting market demand. In 2023, the Latin America region had approximately 14 million smart meters, with projections estimating nearly 43 million units by 2029, increasing penetration from 6.5% to over 18%, according to an industry report. Furthermore, favorable government initiatives aimed at promoting energy efficiency and achieving carbon neutrality are further encouraging investments in smart grid technologies. Moreover, growing concerns over grid stability caused by extreme weather events are driving utilities to adopt intelligent systems for improved load balancing and outage prevention.
Middle East and Africa Smart Demand Response Market Analysis
The Middle East and Africa smart demand response market is significantly driven by increasing investments in renewable energy integration, which enhances grid stability and efficiency. As such, in June 2025, ADFD committed AED 752 Million (USD 205 Million) to expand the GCC power grid with a 96 km, 400kV UAE-Saudi link, supporting renewable energy integration and a USD 20 Billion regional electricity market under UAE’s Energy Strategy 2050. Furthermore, rising government initiatives promoting energy efficiency are accelerating market adoption and regulatory support. Additionally, the ongoing deployment of advanced metering infrastructure (AMI) is improving real-time energy monitoring and demand management capabilities. Besides this, the rapid expansion of smart city projects across the region is fostering intelligent energy system implementation, contributing to the development of a more resilient and responsive electricity grid.
Competitive Landscape:
The competitive landscape of the smart demand response market is characterized by rapid technological advancements, strategic collaborations, and increasing investments in digital energy solutions. Companies are focusing on integrating AI, machine learning, and IoT into demand response platforms to enhance grid efficiency and real-time energy management. Innovation in dynamic pricing models and automation tools is reshaping market competition. Additionally, players are expanding their offerings to cater to diverse end-users, including residential, commercial, and industrial sectors. For instance, in May 2024, Siemens, in collaboration with Emporia, launched the Inhab Energy Monitor, a smart home solution that enables real-time tracking of household energy consumption, including EV charging and solar generation. The device helps optimize energy use, reduce costs, and identify abnormal usage through a mobile app. Available across North America, it supports demand response programs and integrates with IoT technologies. Regulatory support and the push for carbon neutrality are encouraging new entrants and intensifying rivalry. The smart demand response market forecast projects continued expansion, driven by the growing need for grid flexibility, decentralized energy resources, and rising electricity demand across both developed and emerging economies.
The report provides a comprehensive analysis of the competitive landscape in the smart demand response market with detailed profiles of all major companies, including:
- ABB Ltd
- Eaton Corporation plc
- Enel S.p.A.
- General Electric Company
- Hitachi Ltd
- Honeywell International Inc.
- Itron Inc.
- Johnson Controls International plc
- Oracle Corporation
- Schneider Electric SE
- Siemens AG.
Latest News and Developments:
- May 2025: Macquarie agreed to acquire Iberdrola’s UK smart meter business, SP Smart Meters Asset Limited, for GBP 900 Million. The deal adds 2.7 million meters to Macquarie’s portfolio, expanding its UK footprint to over 13 million meters and supporting Britain’s smart energy transition and infrastructure modernization goals.
- March 2025: SPAN launched SPAN Edge, an at-the-meter Intelligent Service Point device helping utilities manage load growth and support electrification. It offers real-time power control, reduces infrastructure costs by up to 50%, and enhances grid reliability, integrating seamlessly with existing utility systems for scalable, efficient energy management.
- September 2024: TeraHive launched three AI-powered energy management solutions in the U.S.: the Energy Suite for residential backup and optimization, the scalable Charging Station Management Solution for EV networks, and Enterprise Energy Management for commercial efficiency. Backed by LITEON, TeraHive aims to advance sustainable energy control.
- September 2024: TELUS launched SmartEnergy, a SmartHome+ app that helps Canadians save up to 15% on energy bills by optimizing connected devices. Subscribers earn rewards, monitor usage, and support grid demand response. The USD 12/month service includes smart device incentives and environmental benefits like tree planting.
- August 2024: Siemens Smart Infrastructure launched the SICAM Enhanced Grid Sensor (EGS), a plug-and-play solution enhancing distribution grid transparency. Built on SICAM A8000 technology, it enables real-time monitoring, asset management, and secure cloud connectivity, accelerating digital transformation and supporting efficient energy transition and renewable integration.
Smart Demand Response Market Report Scope:
| Report Features | Details |
|---|---|
| Base Year of the Analysis | 2025 |
| Historical Period | 2020-2025 |
| Forecast Period | 2026-2034 |
| Units | Billion USD |
| Scope of the Report |
Exploration of Historical Trends and Market Outlook, Industry Catalysts and Challenges, Segment-Wise Historical and Future Market Assessment:
|
| Applications Covered | Residential, Commercial, Industrial |
| Regions Covered | Asia Pacific, Europe, North America, Latin America, Middle East and Africa |
| Countries Covered | United States, Canada, Germany, France, United Kingdom, Italy, Spain, Russia, China, Japan, India, South Korea, Australia, Indonesia, Brazil, Mexico |
| Companies Covered | ABB Ltd, Eaton Corporation plc, Enel S.p.A., General Electric Company, Hitachi Ltd, Honeywell International Inc., Itron Inc., Johnson Controls International plc, Oracle Corporation, Schneider Electric SE and Siemens AG |
| Customization Scope | 10% Free Customization |
| Post-Sale Analyst Support | 10-12 Weeks |
| Delivery Format | PDF and Excel through Email (We can also provide the editable version of the report in PPT/Word format on special request) |
Key Benefits for Stakeholders:
- IMARC’s report offers a comprehensive quantitative analysis of various market segments, historical and current market trends, market forecasts, and dynamics of the smart demand response market from 2020-2034.
- The research study provides the latest information on the market drivers, challenges, and opportunities in the global smart demand response market.
- The study maps the leading, as well as the fastest-growing, regional markets. It further enables stakeholders to identify the key country-level markets within each region.
- Porter's Five Forces analysis assists stakeholders in assessing the impact of new entrants, competitive rivalry, supplier power, buyer power, and the threat of substitution. It helps stakeholders to analyze the level of competition within the smart demand response industry and its attractiveness.
- Competitive landscape allows stakeholders to understand their competitive environment and provides an insight into the current positions of key players in the market.
Frequently Asked Questions About the Smart Demand Response Market Report
The smart demand response market was valued at USD 39.5 Billion in 2025.
The smart demand response market is projected to exhibit a CAGR of 9.25% during 2026-2034, reaching a value of USD 89.6 Billion by 2034.
The market is driven by growing energy consumption, rising electricity costs, and the need for improved grid reliability. Increased adoption of smart grid technologies, real-time energy monitoring systems, and integration of renewable energy sources are further accelerating market growth. Regulatory support, environmental sustainability goals, and demand for load optimization in industrial, commercial, and residential sectors also contribute significantly. Additionally, rising investments in smart infrastructure and digital transformation across utilities and power companies enhance the overall demand response ecosystem.
Asia-Pacific currently dominates the market, holding a significant market share of over 40.0% in 2025. This is due to rapid urbanization, increasing electricity demand, and government initiatives promoting smart energy systems across countries like China, Japan, and South Korea. Expanding smart grid deployment and high penetration of IoT-based solutions further strengthen the region's leadership in the market.
Some of the major players in smart demand response market include ABB Ltd, Eaton Corporation plc, Enel S.p.A., General Electric Company, Hitachi Ltd, Honeywell International Inc., Itron Inc., Johnson Controls International plc, Oracle Corporation, Schneider Electric SE, Siemens AG, etc.
Need more help?
- Speak to our experienced analysts for insights on the current market scenarios.
- Include additional segments and countries to customize the report as per your requirement.
- Gain an unparalleled competitive advantage in your domain by understanding how to utilize the report and positively impacting your operations and revenue.
- For further assistance, please connect with our analysts.
 Request Customization
 Speak to an Analyst
 Request Brochure
 Inquire Before Buying
Benefits of Customization
- Personalize this research
- Triangulate with your data
- Get data as per your format and definition
- Gain a deeper dive into a specific application, geography, customer, or competitor
- Any level of personalization
Get in Touch With Us
UNITED STATES
Phone: +1-201-971-6302
INDIA
Phone: +91-120-433-0800
UNITED KINGDOM
Phone: +44-753-714-6104
Email: [email protected]
Client Testimonials


.webp)


