
Sodium Alginate Prices, Trend, Chart, Demand, Market Analysis, News, Historical and Forecast Data Report 2026 Edition
Sodium Alginate Price Trend, Index and Forecast
Track the latest insights on sodium alginate price trend and forecast with detailed analysis of regional fluctuations and market dynamics across North America, Latin America, Central Europe, Western Europe, Eastern Europe, Middle East, North Africa, West Africa, Central and Southern Africa, Central Asia, Southeast Asia, South Asia, East Asia, and Oceania.
Sodium Alginate Prices Outlook Q1 2026
- USA: USD 13.56/KG
- Spain: USD 8.33/KG
- Japan: USD 11.09/KG
- France: USD 10.37/KG
- Germany: USD 10.67/KG
Sodium Alginate Price Chart

Get real-time access to monthly/quarterly/yearly prices Request Sample
During the first quarter of 2026, the sodium alginate prices in the USA reached 13.56 USD/KG in March. The market experienced a downward trend driven by sufficient supply and moderated demand from the food processing and pharmaceutical industries. Stable seaweed harvesting supported consistent raw material availability, reducing supply pressure. Demand from thickening and stabilizing applications remained steady but lacked strong growth. Buyers maintained cautious procurement strategies, avoiding bulk purchasing.
During the first quarter of 2026, the sodium alginate prices in Spain reached 8.33 USD/KG in March. The market observed a decline due to ample supply and subdued demand from the food and textile industries. Strong availability of raw seaweed ensured stable production levels. Consumption remained consistent but did not show significant expansion. Buyers adopted conservative purchasing behavior, limiting inventory buildup.
During the first quarter of 2026, the sodium alginate prices in Japan reached 11.09 USD/KG in March. The market recorded a moderate decline influenced by sufficient supply and soft demand from the food processing and pharmaceutical sectors. Import reliance ensured stable availability, while domestic consumption remained steady. Buyers maintained cautious inventory management, avoiding excess procurement.
During the first quarter of 2026, the sodium alginate prices in France reached 10.37 USD/KG in March. The market experienced a slight decline driven by balanced supply and moderated demand from the food and cosmetic industries. Production levels remained stable, ensuring consistent availability of sodium alginate. Consumption patterns remained steady but lacked strong momentum. Buyers followed cautious procurement strategies, limiting large purchases.
During the first quarter of 2026, the sodium alginate prices in Germany reached 10.67 USD/KG in March. The market saw a gradual decline due to sufficient supply and subdued demand from the industrial and food sectors. Import availability remained stable, ensuring adequate inventory levels. Consumption remained consistent but did not support price growth. Buyers maintained conservative procurement practices, avoiding excessive stock accumulation.
Sodium Alginate Prices Outlook Q4 2025
- USA: USD 13.73/KG
- Spain: USD 8.53/KG
- Japan: USD 11.31/KG
- France: USD 10.51/KG
- Germany: USD 10.79/KG
During the fourth quarter of 2025, the sodium alginate prices in the USA reached 13.73 USD/KG in December. Prices increased supported by firm demand from food processing, pharmaceutical formulations, and personal care applications. Additionally, steady consumption from thickening and stabilizing segments influenced procurement behavior, while buyers aligned sourcing with structured distribution contracts and seasonal manufacturing cycles.
During the fourth quarter of 2025, the sodium alginate prices in Spain reached 8.53 USD/KG in December. Prices declined as demand from food manufacturing and textile printing applications softened. Moreover, adequate regional availability and cautious inventory management shaped purchasing strategies, encouraging buyers to limit procurement to confirmed production requirements.
During the fourth quarter of 2025, the sodium alginate prices in Japan reached 11.31 USD/KG in December. Prices moved lower influenced by moderated demand from specialty food additives and pharmaceutical excipient segments. Furthermore, stable import flows and disciplined stock positioning reduced urgency in fresh buying activity across industrial consumers.
During the fourth quarter of 2025, the sodium alginate prices in France reached 10.51 USD/KG in December. Prices rose driven by consistent demand from processed food manufacturers and cosmetic formulation industries. In addition to this, structured supply agreements and regulated quality standards influenced sourcing decisions aligned with downstream operational schedules.
During the fourth quarter of 2025, the sodium alginate prices in Germany reached 10.79 USD/KG in December. Prices edged higher supported by steady demand from pharmaceutical, food stabilization, and industrial thickening applications. Apart from this, coordinated distributor networks and stable supply positioning influenced procurement strategies across key manufacturing hubs.
Sodium Alginate Prices Outlook Q3 2025
- USA: USD 13.17/KG
- Spain: USD 8.88/KG
- Japan: USD 11.45/KG
- France: USD 10.17/KG
- Germany: USD 10.57/KG
During the third quarter of 2025, the sodium alginate prices in the USA reached 13.17 USD/KG in September. Market conditions were shaped by steady demand from food processing, textile printing, and pharmaceutical manufacturing. Raw material supply from seaweed processors strengthened, but operational costs increased due to elevated labor expenses and regulatory compliance for food grade materials. These factors collectively supported the upward pricing trajectory in Q3.
During the third quarter of 2025, the sodium alginate prices in Spain reached 8.88 USD/KG in September. Moderate increases in consumption from the food additives sector supported price stability, while textile demand fluctuated seasonally. Local manufacturers experienced higher processing costs due to elevated energy tariffs affecting drying and purification stages. Imported seaweed-derived feedstock faced additional logistics expenses related to shipping and inland distribution.
During the third quarter of 2025, the sodium alginate prices in Japan reached 11.45 USD/KG in September. Rising requirements from the pharmaceutical and biotechnology sectors drove demand, supported by stable consumption from food and textile manufacturers. Domestic processors faced increased production expenses associated with energy-intensive extraction and purification operations. Imported seaweed feedstock incurred higher freight costs and customs charges, contributing to upward price movements.
During the third quarter of 2025, the sodium alginate prices in France reached 10.17 USD/KG in September. Demand from food thickening applications remained steady, while industrial-grade requirements from paper and textile operations supported market activity. Higher handling charges at ports and increased packaging material costs influenced producer expenses. Environmental compliance requirements under European regulations added further cost elements to manufacturing operations.
During the third quarter of 2025, the sodium alginate prices in Germany reached 10.57 USD/KG in September. Strong demand from food, pharmaceutical, and technical applications supported market firmness. Producers experienced rising production expenditures due to energy costs and strict environmental directives. Imported raw materials incurred higher logistics expenses, including freight and port processing charges. Domestic transport surcharges and labor-related operational costs contributed to incremental price increases. These combined structural factors sustained an upward price trend across the quarter.
Sodium Alginate Prices Outlook Q2 2025
- USA: USD 12.78/KG
- Spain: USD 8.75/KG
- Turkey: USD 10.97/KG
- France: USD 9.92/KG
- Germany: USD 10.44/KG
During the second quarter of 2025, the sodium alginate prices in the USA reached 12.78 USD/KG in June. As per the sodium alginate price chart, prices were shaped largely by raw material availability and steady demand from the food and pharmaceutical industries. Limited seaweed harvests and reliance on imports added cost pressures, keeping supply relatively tight. Regulatory standards for food- and pharma-grade material raised production costs, restricting quick supply adjustments. Domestic demand from clean-label food products and wound care applications provided consistent support, while textile usage showed moderate growth. Competition from alternative stabilizers prevented any sharp spikes, but overall sentiment leaned cautious as producers balanced supply management with maintaining competitiveness in a market sensitive to substitution.
During the second quarter of 2025, the sodium alginate prices in Spain reached 8.75 USD/KG in June. Spain relied heavily on brown seaweed imports to produce sodium alginate. Fluctuating raw material costs, especially from disruptions or delays in harvesting and evolving energy prices within the EU shaped the cost base. Environmental trends affecting seaweed supply, due to weather, climate, and over-harvesting also rippled into pricing. Besides, demand across multiple end‑use sectors also played a stabilizing role. Spain’s food and beverage sector, known for its reliance on alginate for products like sauces, dairy, and confectionery, provided steady demand.
During the second quarter of 2025, sodium alginate prices in Turkey reached 10.97 USD/KG in June. Supply constraints tied to fluctuations in brown seaweed harvests played a decisive role. Environmental shifts, climate variations and seasonal disruptions also rippled through production cycles. At the same time, growing interest in clean-label and natural ingredients, especially for food, pharmaceutical, and textile applications, heightened demand, reinforcing pressure on local prices.
During the second quarter of 2025, the sodium alginate prices in France reached 9.92 USD/KG in June. Inventory across Europe, including in France, began to build, easing the urgency for repeat orders. Seaweed availability remained decent, but the sustained pressure from earlier months eased, nudging the market into a more balanced or slightly softer price range. Pressure from alternative gelling agents put subtle downward pressure on negotiations. Overall, France featured firm pricing backed by healthy demand and cost pressures. This gave way to stabilization by mid-quarter and a gentler tone in June as supply chains and buyer strategies adjusted.
During the second quarter of 2025, the sodium alginate prices in Germany reached 10.44 USD/KG in June. Germany’s production and pricing were shaped by rising energy tariffs and stricter environmental rules across the EU. Costs ticked upward as producers absorbed the burden of compliance and elevated power expenses, reinforcing firm pricing trends. Besides, domestic demand also played a stabilizing role. The food additives, pharmaceuticals, and emerging biotech sectors in Germany, nourished by steady industrial consumption, lent price resilience, anchoring expectations even when supply chains wavered.
Sodium Alginate Prices Outlook Q1 2025
- USA: USD 12.5/Kg
- Spain: USD 8.6/Kg
- Turkey: USD 10.8/Kg
- France: USD 9.8/Kg
- Germany: USD 10.3/Kg
During the first quarter of 2025, sodium alginate prices in the USA reached 12.5 USD/Kg in March. Sodium alginate prices experienced mild volatility, driven by fluctuations in the costs of seaweed-derived raw materials and rising energy prices. Production costs were further impacted by increased regulatory scrutiny around food-grade and pharmaceutical processing standards. While demand from the food, pharmaceutical, and packaging sectors remained steady, occasional supply chain disruptions and limited domestic sourcing created intermittent pricing pressure. Overall, the market exhibited a cautiously stable trend, with pricing closely tied to fluctuations in input costs and global dynamics of the seaweed supply.
During the first quarter of 2025, sodium alginate prices in Spain reached 8.6 USD/Kg in March. Sodium alginate prices exhibited moderate fluctuations, influenced by variable seaweed import costs and fluctuations in energy prices within the EU. The country’s reliance on imported brown seaweed, primarily from Asia and South America, made pricing sensitive to global shipping delays and raw material availability. Steady demand from the food, pharmaceutical, and textile sectors provided price support, while compliance with EU sustainability and quality standards added to production costs. Overall, the market maintained a stable firm sentiment amid shifting input dynamics.
During the first quarter of 2025, sodium alginate prices in Turkey reached 10.8 USD/Kg in March. Sodium alginate prices experienced moderate fluctuations during the first quarter of 2025, primarily due to currency volatility and the reliance on imported seaweed-based raw materials. Geopolitical trade disruptions and elevated logistics costs added pressure on supply chains. Despite these challenges, domestic demand from the food processing and textile sectors remained steady, offering some price stability. However, rising energy and compliance costs contributed to an overall firm pricing sentiment across the quarter.
During the first quarter of 2025, sodium alginate prices in France reached 9.8 USD/Kg in March. Sodium alginate prices remained relatively stable with slight upward movement, supported by strong demand in the food, pharmaceutical, and cosmetic industries. The market was influenced by higher energy costs and tightening EU sustainability regulations, which affected production. While supply remained uninterrupted, dependence on imported seaweed and transportation bottlenecks occasionally added to cost pressures. Overall, the market maintained a cautiously firm trend in line with regional input cost dynamics.
During the first quarter of 2025, sodium alginate prices in Germany reached 10.3 USD/Kg in March. Sodium alginate prices displayed a firm to slightly upward trend, shaped by consistent demand from the food additive and biomedical sectors. The impact of increased energy tariffs and stricter EU regulatory compliance added to production costs. While Germany benefits from strong intra-EU logistics, global raw material sourcing and shipment delays introduced mild volatility. The overall market environment remained resilient, with prices reflecting a balance between supply-side constraints and stable demand from end-users.
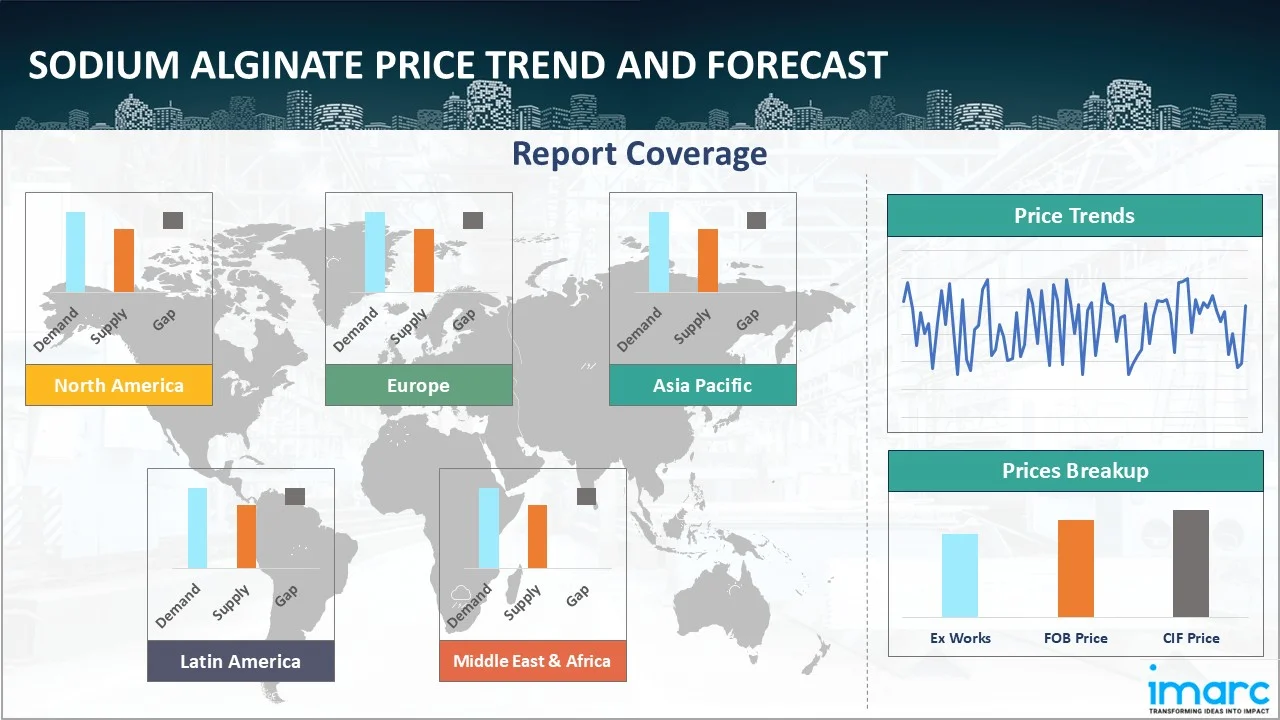
Regional Coverage
The report provides a detailed analysis of the market across different regions, each with unique pricing dynamics influenced by localized market conditions, supply chain intricacies, and geopolitical factors. This includes price trends, price forecast and supply and demand trends for each region, along with spot prices by major ports. The report also provides coverage of FOB and CIF prices, as well as the key factors influencing sodium alginate prices.
Europe Sodium Alginate Price Trend
Q1 2026:
The sodium alginate price index in Europe showed a consistent downward trend driven by ample supply and moderated demand from the food, textile, and cosmetic sectors. Strong availability of raw seaweed across key producing regions supported uninterrupted production activity, ensuring a continuous flow of material into the market. This steady supply environment reduced any potential supply side pressure and limited opportunities for price recovery. At the same time, consumption across major end use industries remained stable but did not exhibit strong growth, which further weakened pricing support.
Q4 2025:
As per the sodium alginate price index, European prices showed mixed movement reflecting upward adjustments in certain Western markets alongside downward corrections in others. Demand from processed food manufacturing, pharmaceutical excipients, and cosmetic formulation segments remained varied across the region. Additionally, inventory rebalancing and distributor-level stock adjustments influenced procurement pacing. Buyers adopted selective sourcing strategies, aligning purchases closely with application-specific demand visibility.
Q3 2025:
During Q3 2025, the sodium alginate price index in Europe reflected steady upward movement across major markets. The region experienced consistent demand from food, pharmaceutical, paper, and industrial users. Producers faced higher operational costs due to stringent environmental standards and energy-intensive processing. Imports of seaweed feedstock encountered increased logistics costs related to handling and inland transport. Compliance expenses under European regulatory frameworks contributed to production overhead.
Q2 2025:
In Europe during Q2 2025, sodium alginate prices were guided by a balance of steady demand and constrained supply. Food processors, textile finishers, and pharmaceutical firms maintained consistent consumption, ensuring a stable floor for the market. On the supply side, reliance on imported seaweed created vulnerability, as any delays or weather disruptions at source translated into tighter availability and higher costs for European producers. Regulatory compliance also added weight, with strict EU quality and safety standards elevating operational expenses. Logistics across regional ports functioned without major disruption, yet cautious purchasing patterns limited bulk deals. By late quarter, sentiment leaned steady rather than bullish, with producers carefully aligning output to demand to avoid surplus and protect pricing discipline.
Q1 2025:
In Europe, sodium alginate prices have remained relatively stable, driven by the availability of raw materials and consistent demand from the food, pharmaceutical, and textile sectors. Major producing countries maintained steady pricing with occasional adjustments reflecting changes in seaweed supply and processing capacity. Other markets across the region exhibited similar trends, supported by ongoing industrial consumption and efficient supply chains. Overall, the pricing landscape in Europe remains balanced yet responsive, aligning with regional production cycles and evolving demand from diverse end-use industries.
This analysis can be extended to include detailed sodium alginate price information for a comprehensive list of countries.
| Region | Countries Covered |
|---|---|
| Europe | Germany, France, United Kingdom, Italy, Spain, Russia, Turkey, Netherlands, Poland, Sweden, Belgium, Austria, Ireland, Switzerland, Norway, Denmark, Romania, Finland, Czech Republic, Portugal, and Greece, among other European countries. |
North America Sodium Alginate Price Trend
Q1 2026:
The sodium alginate price index in North America reflected a slight decline influenced by sufficient supply and stable demand from the food processing and pharmaceutical industries. Domestic production remained consistent, supported by steady raw material availability and regular processing activity. Import flows also remained stable, ensuring that supply levels were adequate to meet market requirements. Demand from applications such as thickening, stabilizing, and emulsifying remained steady, supporting ongoing consumption.
Q4 2025:
As per the sodium alginate price index, prices in North America increased supported by consistent demand from food stabilization, pharmaceutical formulations, and personal care production. Furthermore, stable supply chains and structured distribution agreements shaped market dynamics. Buyers maintained disciplined procurement aligned with scheduled manufacturing output and long-term contractual supply commitments.
Q3 2025:
During Q3 2025, the sodium alginate price index in North America exhibited moderate growth supported by stable consumption from food processing and biotechnology segments. Domestic producers contended with rising labor, energy, and regulatory compliance expenses. Imported materials were affected by increased freight charges and higher port handling costs. Local distribution experienced cost adjustments tied to transportation surcharges. These combined forces preserved upward pricing momentum in the region.
Q2 2025:
As per the sodium alginate price index, prices were shaped by steady demand and balanced supply conditions. Food and beverage producers continued to rely on the ingredient for clean-label formulations, while pharmaceutical and textile applications added further stability to consumption. Domestic production remained limited, keeping the region dependent on imports of seaweed-based raw materials, which exposed buyers to fluctuations in global supply. Energy and compliance costs added mild upward pressure, though this was offset by relatively stable logistics across the US and Canadian markets. Buyers adopted cautious procurement strategies, purchasing steadily without building excess inventories. Overall, the quarter reflected a market that was firm yet restrained, supported by consistent demand but checked by supply chain dependencies.
Q1 2025:
In North America, sodium alginate prices have remained fairly steady, influenced by regional seaweed supply and consistent demand from the food, pharmaceutical, and textile industries. Domestic production is nascent, with supply chains still stabilizing, which kept pricing balanced overall. Major markets across the U.S. and Canada mirrored this trend, with occasional local cost adjustments tied to raw material changes. Overall, the price environment in North America has been stable yet adaptive, responding smoothly to shifts in supply conditions and industrial consumption patterns.
Specific sodium alginate historical data within the United States and Canada can also be provided.
| Region | Countries Covered |
|---|---|
| North America | United States and Canada |
Middle East and Africa Sodium Alginate Price Trend
Q1 2026:
According to the sodium alginate price chart, supply chain interruptions, seasonal changes in demand, and geopolitical influences were the main causes of the price fluctuations in the Middle East and Africa.
Q4 2025:
As per sodium alginate price chart, the prices in the Middle East and Africa fluctuated due to a complex interplay of factors, primarily driven by supply chain disruptions, seasonal demand shifts, and geopolitical influences.
Q3 2025:
The report explores the sodium alginate pricing trends and sodium alginate price chart in the Middle East and Africa, considering factors like regional industrial growth, the availability of natural resources, and geopolitical tensions that uniquely influence market prices.
Q2 2025:
As per the sodium alginate price chart, prices were influenced mainly by their dependence on imported raw materials. Demand from the food and beverage sector stayed firm, as the additive remained essential for stabilizers and thickeners in processed foods. Pharmaceutical and textile industries in key Middle Eastern markets also maintained steady uptake, further tightening availability. In Africa, weaker logistics networks and currency fluctuations raised procurement costs, making prices more volatile. Overall, the region experienced cautious buying, with suppliers balancing inventory carefully to avoid overstocking amid uncertain import schedules.
In addition to region-wise data, information on sodium alginate prices for countries can also be provided.
| Region | Countries Covered |
|---|---|
| Middle East & Africa | Saudi Arabia, UAE, Israel, Iran, South Africa, Nigeria, Oman, Kuwait, Qatar, Iraq, Egypt, Algeria, and Morocco, among other Middle Eastern and African countries. |
Asia Pacific Sodium Alginate Price Trend
Q1 2026:
In the Asia Pacific region, sodium alginate prices showed a gradual decline driven by sufficient supply and subdued demand from food processing and pharmaceutical sectors. Production levels across major manufacturing countries remained stable, supported by consistent access to raw seaweed resources. Export demand showed limited expansion, which allowed more material to remain within domestic markets, contributing to comfortable inventory levels. Consumption from key industries continued at a steady pace but lacked strong growth momentum.
Q4 2025:
Across Asia Pacific, sodium alginate prices moved downward influenced by softened demand from food additive applications and moderated procurement from pharmaceutical and specialty industrial segments. Additionally, stable regional production capacity and consistent import availability reduced supply-side pressure. Buyers adjusted sourcing volumes conservatively, prioritizing inventory optimization and short-term manufacturing visibility across key consuming sectors.
Q3 2025:
During Q3 2025, sodium alginate prices across the Asia Pacific region saw a moderate upward trend driven by active consumption in food, textile printing, and pharmaceutical sectors. Production hubs encountered rising energy and labor expenses tied to extraction and refinement steps. Export-driven markets faced increased shipping and port-related costs. Regulatory quality compliance and domestic distribution costs contributed to overall price strength in the region.
Q2 2025:
During Q2 2025, strong demand for natural, clean‑label ingredients likely supported sodium alginate pricing. The food industry’s need for gelling and thickening agents and the expanding usage in pharmaceuticals, textiles, and personal care helped anchor cost levels. Besides, rapid industrialization, growing consumer demand for sustainable ingredients, and a large production base contributed to ongoing upward pricing pressure. Technological progress in extraction and processing methods also gradually eased manufacturing costs. Innovations such as enzymatic extraction or improved biotechnology techniques also help producers operate more efficiently and potentially moderate price increases.
Q1 2025:
In the Asia-Pacific region, sodium alginate prices exhibited moderate fluctuations, primarily driven by seasonal variations in seaweed harvest and steady demand from the food and textile industries. Major producing countries in the region maintained relatively stable pricing, with occasional adjustments influenced by local supply conditions. Other key markets followed similar trends, supported by steady industrial demand and regional consumption patterns. Overall, the market remained balanced, with pricing influenced by raw material availability and production cycles, reflecting a stable yet responsive environment.
This sodium alginate price analysis can be expanded to include a comprehensive list of countries within the region.
| Region | Countries Covered |
|---|---|
| Asia Pacific | China, India, Indonesia, Pakistan, Bangladesh, Japan, Philippines, Vietnam, Thailand, South Korea, Malaysia, Nepal, Taiwan, Sri Lanka, Hongkong, Singapore, Australia, and New Zealand, among other Asian countries. |
Latin America Sodium Alginate Price Trend
Q1 2026:
The market for sodium alginate in Latin America is primarily driven by the region's abundant natural resources, especially in nations like Chile and Brazil. However, the price of sodium alginate might fluctuate significantly due to various regulatory regimes and political unpredictability.
Q4 2025:
Latin America's sodium alginate market is predominantly influenced by its rich natural reserves, particularly in countries like Chile and Brazil. However, political instability and inconsistent regulatory frameworks can lead to significant volatility in sodium alginate prices.
Q3 2025:
Infrastructure challenges and logistical inefficiencies often impact the supply chain, affecting Latin America’s ability to meet international demand consistently. Moreover, the sodium alginate price index, economic fluctuations, and currency devaluation are critical factors that need to be considered when analyzing sodium alginate pricing trends in this region.
This comprehensive review can be extended to include specific countries within the region.
| Region | Countries Covered |
|---|---|
| Latin America | Brazil, Mexico, Argentina, Columbia, Chile, Ecuador, and Peru, among other Latin American countries. |
Sodium Alginate Pricing Report, Market Analysis, and News
IMARC's latest publication, “Sodium Alginate Prices, Trend, Chart, Demand, Market Analysis, News, Historical and Forecast Data Report 2026 Edition,” presents a detailed examination of the sodium alginate market, providing insights into both global and regional trends that are shaping prices. This report delves into the spot price of sodium alginate at major ports and analyzes the composition of prices, including FOB and CIF terms. It also presents detailed sodium alginate prices trend analysis by region, covering North America, Europe, Asia Pacific, Latin America, and Middle East and Africa. The factors affecting sodium alginate pricing, such as the dynamics of supply and demand, geopolitical influences, and sector specific developments, are thoroughly explored. This comprehensive report helps stakeholders stay informed with the latest market news, regulatory updates, and technological progress, facilitating informed strategic decision-making and forecasting.
Sodium Alginate Industry Analysis
The global sodium alginate market size reached USD 338.86 Million in 2025. By 2034, IMARC Group expects the market to reach USD 527.26 Million, at a projected CAGR of 5.04% during 2026-2034. The market is primarily driven by the rising demand in food applications, expanding pharmaceutical usage, increasing adoption in textile printing, and steady industrial consumption.
Latest News and Developments:
- May 2025: A study by researchers in Yalova University published in the "International Journal of Biological Macromolecules" developed a sodium alginate-coated composite material combining a zirconium-based porous carrier with hydroxyapatite for controlled tetracycline delivery. The optimized system shows an adsorption capacity of 188.68 mgg^(−1) and sustained drug release for up to 78 hours in gastric fluid and 63 hours in intestinal fluid.
Product Description
Sodium alginate is a natural, water soluble polysaccharide derived from the cell walls of brown seaweed (Phaeophyceae). It is the sodium salt of alginic acid and appears as a white to pale yellow powder. Known for its excellent thickening, stabilizing, and gelling properties, sodium alginate is widely used across food, pharmaceutical, textile, and industrial applications.
In the food industry, it functions as an emulsifier, stabilizer, and texturizer—commonly used in products like ice cream, dressings, and fruit filled desserts. In pharmaceuticals, it serves as a controlled-release agent and a key ingredient in wound dressings due to its biocompatibility and ability to retain moisture. In the industrial and textile sectors, it is valued for its role in dye printing and as a thickener in various formulations.
Report Coverage
| Key Attributes | Details |
|---|---|
| Product Name | Sodium Alginate |
| Report Features | Exploration of Historical Trends and Market Outlook, Industry Demand, Industry Supply, Gap Analysis, Challenges, Ammonia Price Analysis, and Segment-Wise Assessment. |
| Currency/Units | US$ (Data can also be provided in local currency) or Metric Tons |
| Region/Countries Covered | The current coverage includes analysis at the global and regional levels only. Based on your requirements, we can also customize the report and provide specific information for the following countries: Asia Pacific: China, India, Indonesia, Pakistan, Bangladesh, Japan, Philippines, Vietnam, Thailand, South Korea, Malaysia, Nepal, Taiwan, Sri Lanka, Hongkong, Singapore, Australia, and New Zealand Europe: Germany, France, United Kingdom, Italy, Spain, Russia, Turkey, Netherlands, Poland, Sweden, Belgium, Austria, Ireland, Switzerland, Norway, Denmark, Romania, Finland, Czech Republic, Portugal and Greece North America: United States and Canada Middle East & Africa: Saudi Arabia, UAE, Israel, Iran, South Africa, Nigeria, Oman, Kuwait, Qatar, Iraq, Egypt, Algeria, and Morocco Latin America: Brazil, Mexico, Argentina, Columbia, Chile, Ecuador, Peru The list of countries presented is not exhaustive. Information on additional countries can be provided if required by the client. |
| Information Covered for Key Suppliers |
|
| Customization Scope | The report can be customized as per the requirements of the customer |
| Report Price and Purchase Option |
Plan A: Monthly Updates - Annual Subscription
Plan B: Quarterly Updates - Annual Subscription
Plan C: Biannually Updates - Annual Subscription
|
| Post-Sale Analyst Support | 360-degree analyst support after report delivery |
| Delivery Format | PDF and Excel through email (We can also provide the editable version of the report in PPT/Word format on special request) |
Key Benefits for Stakeholders:
- IMARC’s report presents a detailed analysis of sodium alginate pricing, covering global and regional trends, spot prices at key ports, and a breakdown of FOB and CIF prices.
- The study examines factors affecting sodium alginate price trend, including input costs, supply-demand shifts, and geopolitical impacts, offering insights for informed decision-making.
- The competitive landscape review equips stakeholders with crucial insights into the latest market news, regulatory changes, and technological advancements, ensuring a well-rounded, strategic overview for forecasting and planning.
- IMARC offers various subscription options, including monthly, quarterly, and biannual updates, allowing clients to stay informed with the latest market trends, ongoing developments, and comprehensive market insights. The sodium alginate price charts ensure our clients remain at the forefront of the industry.
Need more help?
- Speak to our experienced analysts for insights on the current market scenarios.
- Include additional segments and countries to customize the report as per your requirement.
- Gain an unparalleled competitive advantage in your domain by understanding how to utilize the report and positively impacting your operations and revenue.
- For further assistance, please connect with our analysts.
 Request Customization
 Inquire Before Buying
 Speak to an Analyst
 Request Brochure
Benefits of Customization
- Personalize this research
- Triangulate with your data
- Get data as per your format and definition
- Gain a deeper dive into a specific application, geography, customer, or competitor
- Any level of personalization
Get in Touch With Us
UNITED STATES
Phone: +1-201-971-6302
INDIA
Phone: +91-120-433-0800
UNITED KINGDOM
Phone: +44-753-714-6104
Email: [email protected]
Client Testimonials


.webp)


Why Choose Us
IMARC offers trustworthy, data-centric insights into commodity pricing and evolving market trends, enabling businesses to make well-informed decisions in areas such as procurement, strategic planning, and investments. With in-depth knowledge spanning more than 1000 commodities and a vast global presence in over 150 countries, we provide tailored, actionable intelligence designed to meet the specific needs of diverse industries and markets.
1000
+Commodities
150
+Countries Covered
3000
+Clients
20
+Industry
Robust Methodologies & Extensive Resources
IMARC delivers precise commodity pricing insights using proven methodologies and a wealth of data to support strategic decision-making.
Subscription-Based Databases
Our extensive databases provide detailed commodity pricing, import-export trade statistics, and shipment-level tracking for comprehensive market analysis.
Primary Research-Driven Insights
Through direct supplier surveys and expert interviews, we gather real-time market data to enhance pricing accuracy and trend forecasting.
Extensive Secondary Research
We analyze industry reports, trade publications, and market studies to offer tailored intelligence and actionable commodity market insights.
Trusted by 3000+ industry leaders worldwide to drive data-backed decisions. From global manufacturers to government agencies, our clients rely on us for accurate pricing, deep market intelligence, and forward-looking insights.