
Sodium Cyanide Prices, Trend, Chart, Demand, Market Analysis, News, Historical and Forecast Data Report 2026 Edition
Sodium Cyanide Price Trend, Index and Forecast
Track the latest insights on sodium cyanide price trend and forecast with detailed analysis of regional fluctuations and market dynamics across North America, Latin America, Central Europe, Western Europe, Eastern Europe, Middle East, North Africa, West Africa, Central and Southern Africa, Central Asia, Southeast Asia, South Asia, East Asia, and Oceania.
Sodium Cyanide Prices Outlook Q1 2026
- USA: USD 3248/MT
- Indonesia: USD 1734/MT
- Australia: USD 2118/MT
- Brazil: USD 2136/MT
- Argentina: USD 2358/MT
Sodium Cyanide Price Chart

Get real-time access to monthly/quarterly/yearly prices Request Sample
During the first quarter of 2026, the sodium cyanide prices in the USA reached 3248 USD/MT in March. The market saw an increase as extraction activities continued at a steady rate and mining operations' consumption remained constant. Due to steady domestic production and regulated imports, supply circumstances remained comparatively balanced. In order to guarantee a continuous supply for mining applications, buyers maintained consistent procurement policies.
During the first quarter of 2026, the sodium cyanide prices in Indonesia reached 1734 USD/MT in March. Due to adequate supply availability and less demand from mining operations, the market saw a drop. As import volumes stayed constant, domestic supply levels were sufficient to satisfy industrial demands. Nonetheless, mining operators continued to exercise caution when making purchases, which restrained the growth of overall consumption. Customers' urgency decreased as a result of acceptable inventory levels throughout distribution channels.
During the first quarter of 2026, the sodium cyanide prices in Australia reached 2118 USD/MT in March. The market witnessed a mild downward trend influenced by sufficient production levels and stable mining demand. Domestic manufacturers maintained consistent output, ensuring a reliable supply across the market. At the same time, demand from gold mining operations remained steady but did not exhibit strong expansion.
During the first quarter of 2026, the sodium cyanide prices in Brazil reached 2136 USD/MT in March. The market experienced a slight decline due to balanced supply conditions and moderated demand from mining operations. Domestic availability remained stable as production levels continued at a steady pace. At the same time, procurement from mining companies remained cautious as buyers prioritized inventory management. Import activity also contributed to stable supply conditions across the country.
During the first quarter of 2026, the sodium cyanide prices in Argentina reached 2358 USD/MT in March. The market recorded a downward movement influenced by stable supply availability and cautious demand from the mining sector. Domestic distribution channels maintained consistent inventory levels, ensuring sufficient availability for industrial users. Mining operators maintained steady consumption but avoided aggressive procurement strategies.
Sodium Cyanide Prices Outlook Q4 2025
- USA: USD 3196/MT
- Indonesia: USD 1773/MT
- Australia: USD 2145/MT
- Brazil: USD 2160/MT
- Argentina: USD 2426/MT
During the fourth quarter of 2025, the sodium cyanide prices in the USA reached 3196 USD/MT in December. Prices edged higher as demand from gold mining and precious metal extraction strengthened. Additionally, steady offtake from heap leaching operations supported procurement activity. Moreover, sourcing behavior reflected alignment with mine operating schedules and compliance-driven inventory planning.
During the fourth quarter of 2025, the sodium cyanide prices in Indonesia reached 1773 USD/MT in December. Prices edged lower as demand from mining operations softened. Furthermore, sufficient availability reduced buying pressure. In addition, procurement volumes were adjusted to match near-term operational needs and cautious inventory management.
During the fourth quarter of 2025, the sodium cyanide prices in Australia reached 2145 USD/MT in December. Prices eased as consumption from gold mining operations moderated. Additionally, adequate supply coverage limited sourcing urgency. Moreover, procurement strategies emphasized inventory optimization and coordination with mine’s production plans.
During the fourth quarter of 2025, the sodium cyanide prices in Brazil reached 2160 USD/MT in December. Prices trended downward as demand from mining and metallurgical applications weakened. Furthermore, comfortable availability reduced procurement intensity. In addition, sourcing decisions aligned with short-cycle consumption visibility.
During the fourth quarter of 2025, the sodium cyanide prices in Argentina reached 2426 USD/MT in December. Prices registered a decline as offtake from mining operations moderated. Moreover, sufficient inventories allowed buyers to defer purchases. Additionally, procurement behavior focused on maintaining operational continuity rather than expanding stock positions.
Sodium Cyanide Prices Outlook Q3 2025
- USA: USD 3140/MT
- Indonesia: USD 1830/MT
- Australia: USD 2195/MT
- Brazil: USD 2207/MT
- Argentina: USD 2491/MT
During the third quarter of 2025, the sodium cyanide prices in the USA reached 3140 USD/MT in September. The increase reflected sustained demand from gold‐mining operations and specialty chemical users, combined with modest raw material cost pressures. Logistic and transportation costs also rose somewhat, influencing landed cost. Although domestic production remained steady, incremental compliance and energy costs contributed to upward movement.
During the third quarter of 2025, the sodium cyanide prices in Indonesia reached 1830 USD/MT in September. In Indonesia, the price decline was driven by weaker regional demand and increased import availability of feedstock from China, which reduced landed costs. Shipping and port‐handling costs remained stable, and inventory build‐up in downstream mining sectors curtailed aggressive buying. Despite ongoing extraction activity, procurement strategies were cautious, resulting in downward pricing pressure in the quarter.
During the third quarter of 2025, the sodium cyanide prices in Australia reached 2195 USD/MT in September. The Australian market saw a moderate increase, supported by strong mining sector demand, particularly for the gold extraction industry. Domestic producers faced rising labor and energy costs, which fed into pricing. Export opportunities to adjacent markets added upward tension on price levels. However, the increase was modest, reflecting sufficient supply and stable logistics networks.
During the third quarter of 2025, the sodium cyanide prices in Brazil reached 2207 USD/MT in September. Brazil’s pricing rose as feedstock import cost pressures (ammonia and hydrogen cyanide) and currency fluctuations pushed up landed costs. The mining sector maintained steady procurement, and logistical constraints inland added an incremental cost burden. The combination of feedstock, currency and transport effects resulted in an upward movement for the quarter.
During the third quarter of 2025, the sodium cyanide prices in Argentina reached 2491 USD/MT in September. In Argentina, the modest price increase reflected heightened cost pressures driven by currency depreciation, energy tariff increases and import dependency for key inputs. Mining demand remained stable, but supply chain challenges, especially transportation and raw material access, added cost upward. Buyer caution limited the pricing uptick to a modest level.
Sodium Cyanide Prices Outlook Q2 2025
- USA: USD 3066/MT
- Thailand: USD 2485/MT
- Australia: USD 2163/MT
- Brazil: USD 2138/MT
- Argentina: USD 2456/MT
During the second quarter of 2025, the sodium cyanide prices in the USA reached 3066 USD/MT in June. In the United States, sodium cyanide prices in Q2 2025 were influenced by fluctuations in natural gas and ammonia feedstock costs, along with elevated utility expenses at key production facilities. Regulatory scrutiny over hazardous chemical transportation increased compliance costs across the supply chain. The demand from the gold mining sector remained firm, while logistical delays and contract renegotiations added complexity to regional procurement dynamics.
During the second quarter of 2025, sodium cyanide prices in Thailand reached 2485 USD/MT in June. Sodium cyanide prices in Thailand during Q2 2025 were shaped by increased import dependency for raw materials such as hydrogen cyanide and caustic soda. Regional shipping delays and higher freight charges affected supply timelines. The demand from the gold extraction and electroplating sectors remained stable. Environmental regulations and handling requirements for hazardous materials raised compliance-related operational costs for domestic distributors and end users.
During the second quarter of 2025, the sodium cyanide prices in Australia reached 2163 USD/MT in June. In Australia, sodium cyanide prices were driven by strong demand from the mining sector, particularly gold producers in Western Australia and Queensland. Feedstock cost volatility, particularly in ammonia and caustic soda, impacted production economics. Domestic output was stable but faced rising transportation and labor expenses. Export opportunities to Asia and Africa also influenced pricing strategies for surplus volumes.
During the second quarter of 2025, the sodium cyanide prices in Brazil reached 2138 USD/MT in June. In Brazil, pricing was affected by feedstock import variability, especially for ammonia and hydrogen cyanide, which were subject to global market shifts and currency fluctuations. Regulatory constraints on hazardous chemical handling increased operating costs for logistics providers. Demand from the gold and silver mining sectors supported consistent consumption levels. Inland freight challenges and limited domestic production capacity heightened regional sourcing pressures.
During the second quarter of 2025, the sodium cyanide prices in Argentina reached 2456 USD/MT in June. In Argentina, sodium cyanide prices were impacted by currency depreciation, which increased the cost of imported inputs and final products. Domestic producers faced cost challenges from high energy tariffs and irregular raw material supply. The gold mining sector maintained stable procurement activity, although logistical disruptions, including rail and trucking inefficiencies, contributed to delivery delays and inventory management issues across mining operations.
Sodium Cyanide Prices Outlook Q1 2025
- USA: USD 3030/MT
- Thailand: USD 2400/MT
- Malaysia: USD 1990/MT
- Brazil: USD 2080/MT
- Argentina: USD 2420/MT
During the first quarter of 2025, the sodium cyanide prices in the USA reached 3030 USD/MT in March. As per the sodium cyanide price chart, prices surged as a result of higher feedstock costs, reduced plant output, and shipping delays. Some price softening occurred in the middle of the quarter as downstream demand cooled and stockpiles improved. A slight improvement was observed at the close of the quarter, caused by new purchases.
During the first quarter of 2025, sodium cyanide prices in Thailand reached 2400 USD/MT in March. Strong mining demand and growing feedstock costs were the main causes of the first increase. Later, when buying slowed and supplies returned to normal, prices adjusted. Throughout time, downstream consumption patterns and regional supply conditions had an impact on market dynamics.
During the first quarter of 2025, the sodium cyanide prices in Malaysia reached 1990 USD/MT in March. Due to a limited supply of feedstock and demand from the metallurgical sectors, the price of sodium cyanide improved. Prices fell in the middle of the quarter as downstream activity slowed and stocks increased. However, with restocking efforts, there was little recovery at the conclusion.
During the first quarter of 2025, the sodium cyanide prices in Brazil reached 2080 USD/MT in March. Disruptions to the global supply chain affected the availability of sodium cyanide and contributed to price volatility. Besides, Brazil's chemical production faced challenges, leading to a growing reliance on imports. This could put pressure on the supply chain and potentially drive prices.
During the first quarter of 2025, the sodium cyanide prices in Argentina reached 2420 USD/MT in March. Gold's appeal as a sought-after precious metal for various purposes, including investment and industrial applications, fueled the demand for sodium cyanide, especially in mining operations.
Regional Coverage
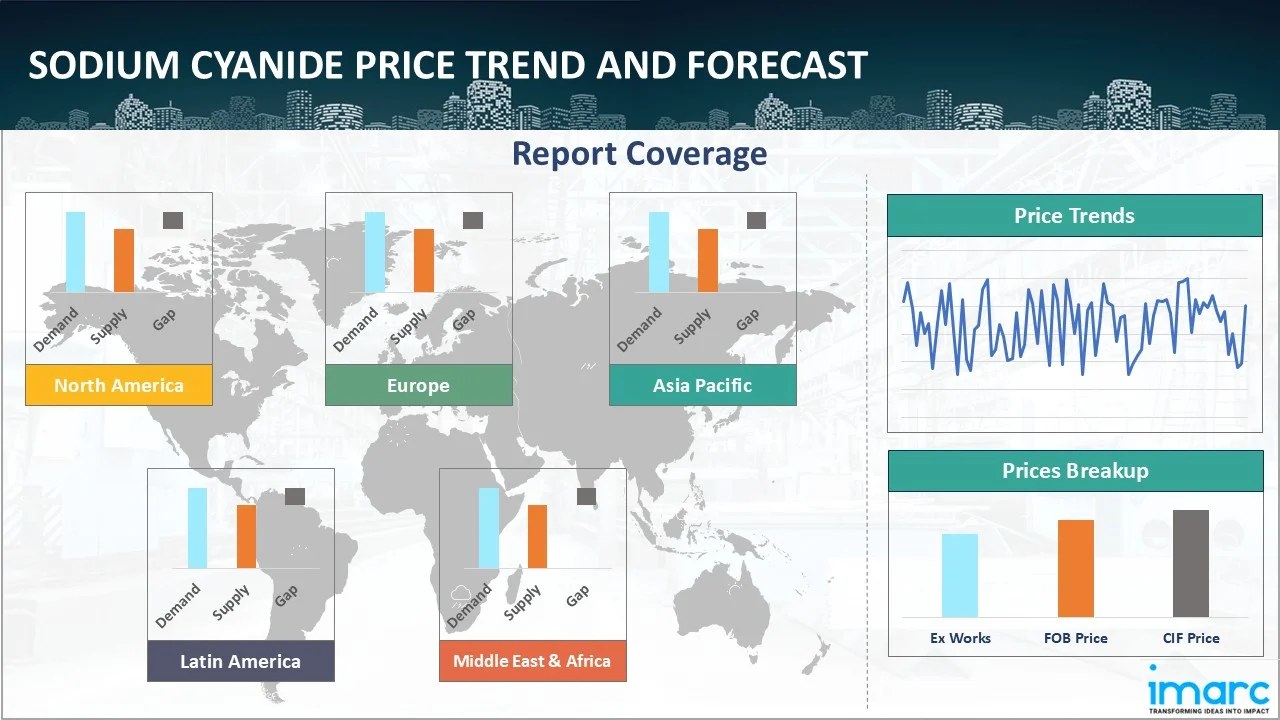
The report provides a detailed analysis of the market across different regions, each with unique pricing dynamics influenced by localized market conditions, supply chain intricacies, and geopolitical factors. This includes price trends, price forecast and supply and demand trends for each region, along with spot prices by major ports. The report also provides coverage of FOB and CIF prices, as well as the key factors influencing sodium cyanide prices.
Europe Sodium Cyanide Price Trend
Q1 2026:
The sodium cyanide price index in Europe experienced varied conditions due to balanced supply and moderated demand from mining and chemical sectors. Import availability remained steady across the region, ensuring sufficient supply to meet industrial requirements. At the same time, consumption from gold extraction operations remained stable but lacked strong expansion. Buyers maintained cautious procurement strategies and focused on aligning purchases with operational requirements rather than expanding inventories.
Q4 2025:
As per the sodium cyanide price index, market conditions across Europe were shaped by stringent regulatory oversight, controlled handling requirements, and limited but specialized industrial consumption. Additionally, procurement strategies were influenced by compliance documentation, transport safety norms, and supplier certification processes, which constrained sourcing flexibility. Moreover, buyers focused on aligning procurement closely with confirmed downstream requirements, emphasizing supply reliability and adherence to environmental and safety standards rather than adjusting sourcing volumes based on short-term market signals.
Q3 2025:
In Q3 2025, the sodium cyanide price index in Europe was supported by robust demand from electroplating and industrial chemical sectors alongside increased energy and feedstock input costs. Production operations encountered rising utility and hydrogen cyanide input costs, which translated to cost pass-throughs. At the same time, mining demand in some countries remained subdued, tempering stronger price rises. Logistics and supply chain performance were stable, limiting the risk of sharp spikes.
Q2 2025:
As per the sodium cyanide price index, European prices maintained high levels due to finite supplies. Production output was hampered by maintenance plans at refineries. Overall consumption did not significantly increase in spite of these supply-side issues, especially in the agricultural input segment. The market remained solid due to stable usage and limited availability. As a result, sustained supply pressures and steady downstream demands supported the sodium cyanide market's steady trajectory throughout the time frame.
Q1 2025:
As per the sodium cyanide price index, prices soared in tandem with the rising prices of caustic soda and hydrogen cyanide. Strong industrial buying and logistical difficulties in multiple regions provided early-quarter pricing support. But as March went on, prices fell as a result of less buying and an improved supply of feedstock. Later, recovery indicators surfaced due to restocking and ongoing demand.
This analysis can be extended to include detailed sodium cyanide price information for a comprehensive list of countries.
| Region | Countries Covered |
|---|---|
| Europe | Germany, France, United Kingdom, Italy, Spain, Russia, Turkey, Netherlands, Poland, Sweden, Belgium, Austria, Ireland, Switzerland, Norway, Denmark, Romania, Finland, Czech Republic, Portugal, and Greece, among other European countries. |
North America Sodium Cyanide Price Trend
Q1 2026:
The sodium cyanide price index in North America showed a modest upward movement supported by steady demand from the gold mining sector. Mining operations maintained consistent production activity, ensuring stable consumption of sodium cyanide across extraction processes. Domestic manufacturers maintained stable production levels, contributing to reliable supply availability across the region. Buyers followed balanced procurement strategies to maintain operational continuity while avoiding excess inventory accumulation.
Q4 2025:
As per the sodium cyanide price index, prices in North America increased, supported by sustained demand from gold mining and precious metal extraction activities. Furthermore, steady utilization rates across mining operations encouraged regular procurement aligned with production schedules. In addition, sourcing strategies emphasized long-term contracts, logistics coordination, and inventory planning designed to ensure uninterrupted supply while meeting strict environmental compliance and workplace safety requirements across mining sites.
Q3 2025:
North America during Q3 2025 recorded moderate gains driven by steady mining demand and persistent cost pressures for raw materials such as ammonia and caustic soda. While domestic production remained operational without major interruption, logistics and freight costs edged upward. Inventory levels across the sector were healthy, which prevented acute tightness, but operator cost pressures and gold-extraction activity maintained upward momentum in pricing across the region.
Q2 2025:
As per the sodium cyanide price index, in North America, sodium cyanide pricing in Q2 2025 was influenced by variable costs of key feedstocks such as ammonia and caustic soda, driven by refinery maintenance cycles and natural gas market volatility. Regulatory compliance costs for the storage and transport of hazardous chemicals remained high. The demand from the gold and silver mining sectors held steady, while supply chain constraints, including truck and rail disruptions, increased delivery risks and procurement lead times.
Q1 2025:
The North American market showed significant volatility in the first quarter of 2025. Production problems and logistical delays, as well as increased costs for hydrogen cyanide and caustic soda, helped sustain early gains. However, prices fell in the middle of the quarter as inventories rebounded and downstream demand decreased. In the end, a slight price improvement was noted, fueled by stable end-use consumption and fresh purchases. Overall, market performance was characterized by changing supply-demand dynamics across regional operations and reflected changes in upstream material costs.
Specific sodium cyanide prices and historical data within the United States and Canada can also be provided.
| Region | Countries Covered |
|---|---|
| North America | United States and Canada |
Middle East and Africa Sodium Cyanide Price Trend
Q1 2026:
According to the price chart for sodium cyanide, supply chain interruptions, seasonal variations in demand, and geopolitical influences were the main causes of the price fluctuations in the Middle East and Africa.
Q4 2025:
As per sodium cyanide price chart, the prices in the Middle East and Africa fluctuated due to a complex interplay of factors, primarily driven by supply chain disruptions, seasonal demand shifts, and geopolitical influences.
Q3 2025:
The report explores the sodium cyanide pricing trends and sodium cyanide price chart in the Middle East and Africa, considering factors like regional industrial growth, the availability of natural resources, and geopolitical tensions that uniquely influence market prices.
In addition to region-wise data, information on sodium cyanide prices for countries can also be provided.
| Region | Countries Covered |
|---|---|
| Middle East & Africa | Saudi Arabia, UAE, Israel, Iran, South Africa, Nigeria, Oman, Kuwait, Qatar, Iraq, Egypt, Algeria, and Morocco, among other Middle Eastern and African countries. |
Asia Pacific Sodium Cyanide Price Trend
Q1 2026:
In the Asia Pacific region, sodium cyanide prices experienced a gradual decline driven by sufficient production levels and moderated demand from mining operations. Regional manufacturing activity remained steady, ensuring consistent supply availability across major markets. At the same time, consumption from gold extraction industries remained stable but lacked strong expansion. Buyers focused on maintaining balanced inventory levels and avoided aggressive procurement strategies. Stable logistics and operational costs provided limited pricing support.
Q4 2025:
Across Asia Pacific, sodium cyanide prices moved lower as demand from mining operations moderated. Furthermore, comfortable availability across regional supply chains reduced procurement urgency among end users. In addition, sourcing strategies emphasized cost control, inventory visibility, and cautious purchasing aligned with adjusted mine operating rates. Buyers focused on managing inventories conservatively while ensuring compliance with handling and transport regulations across diverse regulatory environments.
Q3 2025:
In the Asia Pacific region during Q3 2025, sodium cyanide prices varied across countries, with some markets showing a decline and others modest rises. The region’s mix of import and domestic supply impacted dynamics as lower Chinese export parity eased cost in some import-dependent markets, leading to price declines in places where demand softened and feedstock landed cost improved. At the same time, strong mining activity in Australia and neighboring markets supported upward pressure. Logistics remained stable, but regional shipping and freight dynamics were influential.
Q2 2025:
In the Asia Pacific region, prices were shaped by fluctuations in raw material availability, particularly hydrogen cyanide and caustic soda, amid ongoing supply disruptions in major manufacturing hubs. Environmental regulations in China and Southeast Asia triggered temporary plant shutdowns, impacting regional output. Demand from the mining and electroplating sectors remained strong, while increased intra-regional freight charges and port delays further influenced pricing and delivery schedules.
Q1 2025:
Changing feedstock costs, especially those of hydrogen cyanide and caustic soda, influenced the market. Early price hikes were brought on by supply shortages in China as a result of fewer plants operating and lower stockpiles during Lunar New Year celebrations. The mining and metallurgical industries sustained strong demand. A price adjustment occurred halfway through the quarter as a result of better stock levels and slowing consumption. Although price volatility persisted because of changing raw material dynamics, there was a late-quarter rebound as restocking and new procurement activity increased.
This sodium cyanide price analysis can be expanded to include a comprehensive list of countries within the region.
| Region | Countries Covered |
|---|---|
| Asia Pacific | China, India, Indonesia, Pakistan, Bangladesh, Japan, Philippines, Vietnam, Thailand, South Korea, Malaysia, Nepal, Taiwan, Sri Lanka, Hongkong, Singapore, Australia, and New Zealand, among other Asian countries. |
Latin America Sodium Cyanide Price Trend
Q1 2026:
In Latin America, sodium cyanide prices experienced a mild decline influenced by balanced supply and cautious demand from mining operations. Regional supply conditions remained stable due to consistent imports and steady distribution networks. Gold extraction activities continued at a steady pace, supporting baseline consumption levels. However, buyers maintained disciplined procurement strategies and avoided building large inventories. Logistics and operational costs remained stable and provided limited price support.
Q4 2025:
The sodium cyanide market in Latin America reflected downward pricing conditions, influenced by reduced demand from mining operations and sufficient supply availability. Additionally, procurement activity was closely aligned with immediate operational requirements rather than forward-looking stock buildup. Moreover, sourcing decisions emphasized logistics coordination, inventory management, and compliance with transport and safety regulations, enabling buyers to maintain continuity of supply while minimizing holding risks.
Q3 2025:
In Latin America during Q3 2025, sodium cyanide pricing trended upward as mining industry procurement remained firm and cost pressures mounted. Many Latin American countries depend significantly on imported feedstock chemicals and face currency and energy cost fluctuations, which lifted the landed cost. Transportation and internal logistics challenges added incremental cost burdens. While major supply disruptions were limited, the confluence of mining demand, cost inflation and import dependency supported increased pricing in the quarter.
Q2 2025:
In Latin America, sodium cyanide prices were driven by reliance on imported feedstocks and finished products, with currency volatility in Brazil and Argentina significantly affecting procurement costs. Limited domestic production capacity added pressure on supply chains, particularly during periods of high mining activity. Transport inefficiencies, regulatory complexities for hazardous material handling, and rising inland freight costs disrupted distribution networks, impacting supply availability for mining operations across both countries.
Q1 2025:
As per the sodium cyanide price index, prices in Latin America were influenced primarily due to rising demand, particularly from the mining sector, coupled with supply chain disruptions and elevated production costs. Besides, increased energy costs and the cost of raw materials like hydrogen cyanide and sodium hydroxide, used in sodium cyanide production, also contributed to price changes.
This comprehensive review can be extended to include specific countries within the region.
| Region | Countries Covered |
|---|---|
| Latin America | Brazil, Mexico, Argentina, Columbia, Chile, Ecuador, and Peru, among other Latin American countries. |
Sodium Cyanide Pricing Report, Market Analysis, and News
IMARC's latest publication, “Sodium Cyanide Prices, Trend, Chart, Demand, Market Analysis, News, Historical and Forecast Data Report 2026 Edition,” presents a detailed examination of the sodium cyanide market, providing insights into both global and regional trends that are shaping prices. This report delves into the spot price of sodium cyanide at major ports and analyzes the composition of prices, including FOB and CIF terms. It also presents detailed sodium cyanide prices trend analysis by region, covering North America, Europe, Asia Pacific, Latin America, and Middle East and Africa. The factors affecting sodium cyanide pricing, such as the dynamics of supply and demand, geopolitical influences, and sector specific developments, are thoroughly explored. This comprehensive report helps stakeholders stay informed with the latest market news, regulatory updates, and technological progress, facilitating informed strategic decision-making and forecasting.
Sodium Cyanide Industry Analysis
The global sodium cyanide market size reached USD 2.86 Billion in 2025. By 2034, IMARC Group expects the market to reach USD 4.33 Billion, at a projected CAGR of 4.71% during 2026-2034. The market is primarily driven by sustained demand from gold and silver mining operations, growing use in chemical intermediates and electroplating, and increased infrastructure expenditure requiring specialty chemicals.
Latest News and Developments:
- October 2025: Australian Gold Reagents announced that the Sodium Cyanide (SCN) Plant Expansion Project officially transitioned from the engineering phase to the construction phase. This milestone marked a major step forward in the project’s execution timeline, following the successful completion of detailed engineering design, procurement planning, and regulatory approvals.
- July 2024: Australian Gold Reagents (AGR) announced that its Board approved the next step of funding to move forward with plans to increase the capacity of its sodium cyanide plant. After three years of planning, the expansion will boost AGR's production capacity from its existing level of over 28,000 tons to over 90,000 tons, annually.
Product Description
Sodium cyanide (NaCN) is a highly toxic, white, water-soluble compound primarily used in industrial applications, most notably in the mining sector. It is a salt derived from hydrogen cyanide and sodium hydroxide and typically appears as a crystalline solid or powder. Due to its ability to efficiently bind with metals, sodium cyanide is widely employed in the extraction of gold and silver through the cyanidation process, making it an essential reagent in precious metal mining. Aside from mining, sodium cyanide is utilized in chemical synthesis, electroplating, and the production of dyes, pharmaceuticals, and synthetic fibers. Its reactivity and efficiency in separating metals from ores make it particularly valuable in metallurgical operations. However, due to its extreme toxicity and potential environmental hazards, its use is strictly regulated in many countries.
Report Coverage
| Key Attributes | Details |
|---|---|
| Product Name | Sodium Cyanide |
| Report Features | Exploration of Historical Trends and Market Outlook, Industry Demand, Industry Supply, Gap Analysis, Challenges, Ammonia Price Analysis, and Segment-Wise Assessment. |
| Currency/Units | US$ (Data can also be provided in local currency) or Metric Tons |
| Region/Countries Covered | The current coverage includes analysis at the global and regional levels only. Based on your requirements, we can also customize the report and provide specific information for the following countries: Asia Pacific: China, India, Indonesia, Pakistan, Bangladesh, Japan, Philippines, Vietnam, Thailand, South Korea, Malaysia, Nepal, Taiwan, Sri Lanka, Hongkong, Singapore, Australia, and New Zealand Europe: Germany, France, United Kingdom, Italy, Spain, Russia, Turkey, Netherlands, Poland, Sweden, Belgium, Austria, Ireland, Switzerland, Norway, Denmark, Romania, Finland, Czech Republic, Portugal and Greece North America: United States and Canada Middle East & Africa: Saudi Arabia, UAE, Israel, Iran, South Africa, Nigeria, Oman, Kuwait, Qatar, Iraq, Egypt, Algeria, and Morocco Latin America: Brazil, Mexico, Argentina, Columbia, Chile, Ecuador, Peru The list of countries presented is not exhaustive. Information on additional countries can be provided if required by the client. |
| Information Covered for Key Suppliers |
|
| Customization Scope | The report can be customized as per the requirements of the customer |
| Report Price and Purchase Option |
Plan A: Monthly Updates - Annual Subscription
Plan B: Quarterly Updates - Annual Subscription
Plan C: Biannually Updates - Annual Subscription
|
| Post-Sale Analyst Support | 360-degree analyst support after report delivery |
| Delivery Format | PDF and Excel through email (We can also provide the editable version of the report in PPT/Word format on special request) |
Key Benefits for Stakeholders:
- IMARC’s report presents a detailed analysis of sodium cyanide pricing, covering global and regional trends, spot prices at key ports, and a breakdown of FOB and CIF prices.
- The study examines factors affecting sodium cyanide price trend, including input costs, supply-demand shifts, and geopolitical impacts, offering insights for informed decision-making.
- The competitive landscape review equips stakeholders with crucial insights into the latest market news, regulatory changes, and technological advancements, ensuring a well-rounded, strategic overview for forecasting and planning.
- IMARC offers various subscription options, including monthly, quarterly, and biannual updates, allowing clients to stay informed with the latest market trends, ongoing developments, and comprehensive market insights. The sodium cyanide price charts ensure our clients remain at the forefront of the industry.
Need more help?
- Speak to our experienced analysts for insights on the current market scenarios.
- Include additional segments and countries to customize the report as per your requirement.
- Gain an unparalleled competitive advantage in your domain by understanding how to utilize the report and positively impacting your operations and revenue.
- For further assistance, please connect with our analysts.
 Request Customization
 Inquire Before Buying
 Speak to an Analyst
 Request Brochure
Benefits of Customization
- Personalize this research
- Triangulate with your data
- Get data as per your format and definition
- Gain a deeper dive into a specific application, geography, customer, or competitor
- Any level of personalization
Get in Touch With Us
UNITED STATES
Phone: +1-201-971-6302
INDIA
Phone: +91-120-433-0800
UNITED KINGDOM
Phone: +44-753-714-6104
Email: [email protected]
Client Testimonials


.webp)


Why Choose Us
IMARC offers trustworthy, data-centric insights into commodity pricing and evolving market trends, enabling businesses to make well-informed decisions in areas such as procurement, strategic planning, and investments. With in-depth knowledge spanning more than 1000 commodities and a vast global presence in over 150 countries, we provide tailored, actionable intelligence designed to meet the specific needs of diverse industries and markets.
1000
+Commodities
150
+Countries Covered
3000
+Clients
20
+Industry
Robust Methodologies & Extensive Resources
IMARC delivers precise commodity pricing insights using proven methodologies and a wealth of data to support strategic decision-making.
Subscription-Based Databases
Our extensive databases provide detailed commodity pricing, import-export trade statistics, and shipment-level tracking for comprehensive market analysis.
Primary Research-Driven Insights
Through direct supplier surveys and expert interviews, we gather real-time market data to enhance pricing accuracy and trend forecasting.
Extensive Secondary Research
We analyze industry reports, trade publications, and market studies to offer tailored intelligence and actionable commodity market insights.
Trusted by 3000+ industry leaders worldwide to drive data-backed decisions. From global manufacturers to government agencies, our clients rely on us for accurate pricing, deep market intelligence, and forward-looking insights.