
Sodium Hypochlorite Prices, Trend, Chart, Demand, Market Analysis, News, Historical and Forecast Data Report 2026 Edition
Sodium Hypochlorite Price Trend, Index and Forecast
Track real-time and historical sodium hypochlorite prices across global regions. Updated monthly with market insights, drivers, and forecasts.
Sodium Hypochlorite Prices May 2026
| Region | Price (USD/KG) | Latest Movement |
|---|---|---|
| Northeast Asia | 0.32 | 10.3% ↑ Up |
| Europe | 0.45 | 4.7% ↑ Up |
| India | 0.28 | 7.7% ↑ Up |
| North America | 0.47 | 6.8% ↑ Up |
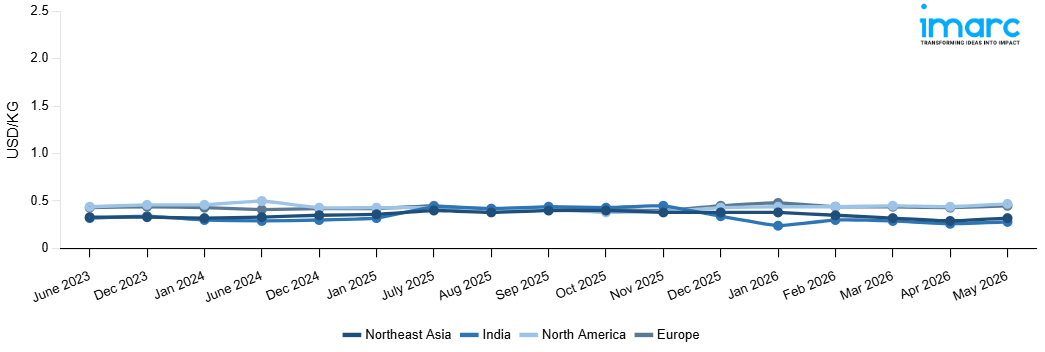
Sodium Hypochlorite Price Index (USD/KG):
The chart below highlights monthly sodium hypochlorite prices across different regions.
Get Access to Monthly/Quarterly/Yearly Prices, Request Sample
Market Overview Q1 Ending March 2026
Northeast Asia: The sodium hypochlorite prices in Northeast Asia reached 0.32 USD/KG in March 2026. The downward pricing movement registered between December and March 2026 was 15.8%. The significant decrease in price levels was mainly due to a weakening of downstream demand from the water treatment, sanitation, and textile bleaching industries, which led to a moderation in procurement activity amid low industrial activity in the region. The weakening in upstream costs for chlorine and caustic soda feedstocks continued to erode support for production costs for the region’s industries. High inventory levels among major players led to increased discounts to clear inventory as quickly as possible, while high by product supply from increased chlor alkali plant operations also contributed to supply side pressures. Furthermore, low demand from the food processing and municipal disinfection segments failed to provide any significant support to prices, while a conservative approach to procurement strategies by downstream buyers, in anticipation of continued price weakening, resulted in sustained bearish price trends during the quarter.
Europe: The sodium hypochlorite prices in Europe reached 0.44 USD/KG in March 2026. The downward pricing movement registered between December and March 2026 was 2.2%. The moderate price decline was primarily attributed to softened demand from the water disinfection, sanitation, and industrial bleaching sectors amid seasonal moderation in municipal and commercial cleaning activity across the region. Easing upstream chlorine feedstock costs reduced production cost benchmarks for domestic manufacturers, diminishing baseline pricing support across the supply chain. Adequate supply availability from established chlor alkali co production facilities maintained comfortable inventory levels, while moderate consumption from the swimming pool treatment and food grade sanitization segments provided limited pricing support.
India: The sodium hypochlorite prices in India reached 0.29 USD/KG in March 2026. The downward pricing movement registered between December and March 2026 was 14.7%. The significant price correction was attributed to subdued demand from the water treatment, textile bleaching, and sanitation chemical sectors amid seasonal moderation in downstream processing activity across the domestic market. Softening upstream chlorine and caustic soda feedstock costs substantially reduced production expenses for regional manufacturers, enabling aggressive downward pricing adjustments. Intensified competition among fragmented domestic producers amplified supply side pressure, while surplus by product availability from expanded chlor alkali operations further dampened pricing support.
North America: The sodium hypochlorite prices in North America reached 0.45 USD/KG in March 2026. The upward pricing movement registered between December and March 2026 was 4.7%. The moderate rate of price appreciation was driven by sustained demand from municipal water treatment, food processing plant sanitation, and industrial disinfection activities, which maintained robust procurement levels throughout the quarter. High production costs faced by domestic manufacturers, which were a result of firm upstream feedstock costs for chlorine and caustic soda, provided robust support to prices. Tightened supply conditions, driven by capacity constraints at chlor alkali plants, fueled procurement rivalry. In addition, increased logistics costs associated with transporting hazardous materials supported prices. Sustained offtake from swimming pool chemical and wastewater treatment segments maintained robust offtake fundamentals, which sustained moderately bullish price momentum throughout the quarter.
Market Overview Q4 Ending December 2025
Northeast Asia: The sodium hypochlorite prices in Northeast Asia reached 0.38 USD/KG in December 2025. The downward pricing movement registered between September and December 2025 was 5.80%. Regional markets experienced sustained price erosion as production capacity expansions commissioned during the previous year created excess supply conditions that outpaced consumption growth. Demand from water treatment facilities and industrial disinfection applications remained relatively stable but failed to absorb the additional volumes entering the market. Under pressure to sustain plant utilization rates, chlor-alkali companies implemented competitive pricing strategies that prioritized volume retention over margin preservation. Sellers were forced to clear stockpiles at increasingly lower price points due to the comparatively short shelf life of sodium hypochlorite solutions, which constrained their ability to withhold material from the market.
Europe: The sodium hypochlorite prices in Europe reached 0.45 USD/KG in December 2025. The upward pricing movement registered between September and December 2025 was 9.30%. European markets recorded significant price appreciation as energy-intensive chlor-alkali producers faced elevated electricity costs, compressing operating margins and prompting several facilities to curtail output. The resulting supply tightness coincided with robust demand from municipal water treatment operations, where infrastructure maintenance and regulatory compliance requirements sustained consistent procurement volumes. Industrial buyers from the paper manufacturing and chemical processing sectors competed for available material, creating allocation pressures that favored suppliers in price negotiations.
India: The sodium hypochlorite prices in India reached 0.34 USD/KG in December 2025. The downward pricing movement registered between September and December 2025 was 22.0%. Indian markets witnessed the most dramatic regional price collapse, as aggressive capacity additions across multiple production hubs created severe oversupply, fundamentally altering competitive dynamics. New chlor-alkali plants that commenced operations during the year significantly exceeded initial demand projections, leaving producers scrambling for market share in an increasingly saturated landscape. Demand from traditional consumer sectors, including textiles, water treatment, and agriculture, showed unexpected weakness, as many end users postponed purchases or sought cheaper alternatives amid budget pressures. The seasonal monsoon period reduced certain industrial activities, further dampening consumption amid elevated production levels.
North America: The sodium hypochlorite prices in North America reached 0.43 USD/KG in December 2025. The upward pricing movement registered between September and December 2025 was 6.10%. North American markets experienced moderate price strengthening as chlorine demand from various derivative applications supported chlor-alkali producer economics, indirectly benefiting sodium hypochlorite pricing dynamics. Municipal water treatment demand remained steady as utilities maintained regular procurement schedules to ensure uninterrupted disinfection capabilities for drinking water and wastewater systems. Industrial consumption from food processing and pharmaceutical sectors held firm, with these regulated applications demonstrating limited price sensitivity given the critical nature of sanitation requirements. During the quarter, a number of Gulf Coast production facilities underwent planned maintenance, tightening spot market conditions and temporarily reducing regional availability.
Market Overview Q3 Ending September 2025
Northeast Asia: Key cost components included feedstock chlorine and caustic soda, whose prices were somewhat elevated due to energy cost increases, especially gas and electricity. International shipping and intra-regional port handling costs also rose modestly due to increased congestion in major ports. Currency fluctuations offset import cost pressures for those regions relying on imported raw materials. Domestic logistics costs, particularly inland freight in China and Korea, added to delivered cost. Regulatory compliance costs also played a role in elevating operating costs for producers. Overall, the regional balance shifted slightly toward tighter supply relative to demand, supporting upward price movement.
Europe: Demand from industrial cleaning, healthcare disinfection, and municipal water utilities contributed, though growth was cautious amid broader economic softness. On the supply side, some European chlor-alkali and bleach producers scheduled maintenance shutdowns, especially in Germany, France, and Benelux, which marginally reduced regional output. Cost components were influenced by feedstock chlorine and caustic soda costs, which had begun to stabilize after prior volatility. Energy costs, especially electricity and gas, remained a significant component; high energy tariffs in parts of Europe continued to pressure production costs. Port handling and customs costs for imported raw materials increased somewhat, in part due to regulatory and environmental compliance checks.
India: In India, sodium hypochlorite prices rose. Demand drivers included water treatment, increased activity in textile bleaching, and disinfection demand, especially with public health mandates. On the supply side, domestic chlor-alkali producers managed steady output, but some smaller units faced regulatory or environmental compliance costs that constrained expansion. Raw material costs rose, partly due to imported inputs whose costs moved up because of freight cost inflation and international shipping delays. Customs duties and tariffs played a role in import cost, especially for ancillary chemicals and equipment. Domestic environmental regulation required investment in compliance, adding to costs. All these pushed the upstream cost base up, enabling producers to raise prices despite buyer sensitivity.
North America: Demand from municipal water treatment and sanitation remained steady but growth was muted as some downstream sectors like paper, pulp, and textile bleaching were running slower or deferring purchases. Feedstock costs, such as chlorine, caustic soda were stable or mildly declining, weakening cost pressure. Transportation and freight costs had eased somewhat from earlier peaks, reducing cost-push components. Regulatory, energy, and compliance costs remained material but not escalating sharply. Inventory buildup among distributors exerted competitive pressure, leading some price discounting or more aggressive terms. Currency effects were modest.
Sodium Hypochlorite Price Trend, Market Analysis, and News
IMARC's latest publication, “Sodium Hypochlorite Prices, Trend, Chart, Demand, Market Analysis, News, Historical and Forecast Data Report 2026 Edition,” presents a detailed examination of the sodium hypochlorite market, providing insights into both global and regional trends that are shaping prices. This report delves into the spot price of sodium hypochlorite at major ports and analyzes the composition of prices, including FOB and CIF terms. It also presents detailed sodium hypochlorite prices trend analysis by region, covering North America, Europe, Asia Pacific, Latin America, and Middle East and Africa. The factors affecting sodium hypochlorite pricing, such as the dynamics of supply and demand, geopolitical influences, and sector-specific developments, are thoroughly explored. This comprehensive report helps stakeholders stay informed with the latest market news, regulatory updates, and technological progress, facilitating informed strategic decision-making and forecasting.
.webp)
Sodium Hypochlorite Industry Analysis
The global sodium hypochlorite industry size reached USD 319.14 Million in 2025. By 2034, IMARC Group expects the market to reach USD 478.72 Million, at a projected CAGR of 4.61% during 2026-2034. Growth is supported by increasing demand in water treatment facilities, rising usage in cleaning and disinfectant products, expanding applications in the textile and pulp industries, and stricter environmental regulations promoting the adoption of cost effective oxidizing agents.
Latest developments in the sodium hypochlorite industry:
- May 2025: HASA, Inc. completed the acquisition of certain assets of Clearwater Chemicals, a Texas-based provider of water treatment products and services, including its mini-bulk sodium hypochlorite delivery operations. This strategic expansion strengthens HASA’s presence in Texas and enhances its ability to serve the recreational, municipal, and industrial markets in the South-Central United States.
- October 2023: Hawkins Inc. announced that it had completed the acquisition of Water Solutions Unlimited, Inc. and had entered into a definitive agreement to acquire the assets of The Miami Products & Chemical Company. These transactions were expected to add over 90 employees to the Hawkins group and generate USD 10 million in EBITDA within three years.
- June 2022: OxyVinyls, the chemical division of Occidental Petroleum, announced plans for a USD 1.1 billion expansion and modernization project at its chlor-alkali plant in La Porte, Texas. The facility was already producing up to 527,800 metric tons per year of chlorine and 580,000 metric tons per year of caustic soda, and the project aimed to enhance capacity and efficiency.
- December 2021: Hawkins Inc. acquired NAPCO Chemical Company Inc., a manufacturer and distributor of chemicals for water treatment. The acquisition significantly strengthened Hawkins’ water treatment chemical portfolio, including sodium hypochlorite.
- September 2020: Hindustan Unilever Limited launched a new range of Domex toilet cleaner formulations using sodium hypochlorite to reduce infection risks in public washrooms. This development marked an expansion of sodium hypochlorite’s use in hygiene and disinfection applications.
Product Description
Sodium hypochlorite (NaOCl) is an inorganic compound widely known for its disinfecting and bleaching properties. It is typically produced by reacting chlorine with sodium hydroxide solution. Appearing as a pale yellow-green liquid with a characteristic chlorine odor, sodium hypochlorite is a strong oxidizing agent. Its primary applications are in water and wastewater treatment, where it serves as an effective disinfectant against bacteria, viruses, and algae. In households, it is widely used in bleach formulations and surface cleaning products. Industrially, sodium hypochlorite is employed in pulp and paper bleaching, textile processing, and chemical synthesis. Despite its corrosive nature and stability limitations, its broad-spectrum antimicrobial activity and cost-effectiveness make it indispensable across sanitation, healthcare, and industrial sectors.
Report Coverage
| Key Attributes | Details |
|---|---|
| Product Name | Sodium Hypochlorite |
| Report Features | Exploration of Historical Trends and Market Outlook, Industry Demand, Industry Supply, Gap Analysis, Challenges, Sodium Hypochlorite Price Analysis, and Segment-Wise Assessment. |
| Currency/Units | US$ (Data can also be provided in local currency) or Metric Tons |
| Region/Countries Covered | The current coverage includes analysis at the global and regional levels only. Based on your requirements, we can also customize the report and provide specific information for the following countries: Asia Pacific: China, India, Indonesia, Pakistan, Bangladesh, Japan, Philippines, Vietnam, Thailand, South Korea, Malaysia, Nepal, Taiwan, Sri Lanka, Hongkong, Singapore, Australia, and New Zealand Europe: Germany, France, United Kingdom, Italy, Spain, Russia, Turkey, Netherlands, Poland, Sweden, Belgium, Austria, Ireland, Switzerland, Norway, Denmark, Romania, Finland, Czech Republic, Portugal and Greece North America: United States and Canada Latin America: Brazil, Mexico, Argentina, Columbia, Chile, Ecuador, and Peru Middle East & Africa: Saudi Arabia, UAE, Israel, Iran, South Africa, Nigeria, Oman, Kuwait, Qatar, Iraq, Egypt, Algeria, and Morocco The list of countries presented is not exhaustive. Information on additional countries can be provided if required by the client. |
| Information Covered for Key Suppliers |
|
| Customization Scope | The report can be customized as per the requirements of the customer |
| Report Price and Purchase Option |
Plan A: Monthly Updates - Annual Subscription
Plan B: Quarterly Updates - Annual Subscription
Plan C: Biannually Updates - Annual Subscription
|
| Post-Sale Analyst Support | 360-degree analyst support after report delivery |
| Delivery Format | PDF and Excel through email (We can also provide the editable version of the report in PPT/Word format on special request) |
Key Benefits for Stakeholders:
- IMARC’s report presents a detailed analysis of sodium hypochlorite pricing, covering global and regional trends, spot prices at key ports, and a breakdown of Ex Works, FOB, and CIF prices.
- The study examines factors affecting sodium hypochlorite price trend, including raw material costs, supply-demand shifts, geopolitical impacts, and industry developments, offering insights for informed decision-making.
- The competitive landscape review equips stakeholders with crucial insights into the latest market news, regulatory changes, and technological advancements, ensuring a well-rounded, strategic overview for forecasting and planning.
- IMARC offers various subscription options, including monthly, quarterly, and biannual updates, allowing clients to stay informed with the latest market trends, ongoing developments, and comprehensive market insights. The sodium hypochlorite price charts ensure our clients remain at the forefront of the industry.
Frequently Asked Questions About the Sodium Hypochlorite Prices Report
The sodium hypochlorite prices in May 2026 were 0.32 USD/Kg in Northeast Asia, 0.45 USD/Kg in Europe, 0.28 USD/Kg India and 0.47 USD/Kg in North America.
The sodium hypochlorite pricing data is updated on a monthly basis.
We provide the pricing data primarily in the form of an Excel sheet and a PDF.
Yes, our report includes a forecast for sodium hypochlorite prices.
The regions covered include North America, Europe, Asia Pacific, Middle East, and Latin America. Countries can be customized based on the request (additional charges may be applicable).
Yes, we provide both FOB and CIF prices in our report.
Need more help?
- Speak to our experienced analysts for insights on the current market scenarios.
- Include additional segments and countries to customize the report as per your requirement.
- Gain an unparalleled competitive advantage in your domain by understanding how to utilize the report and positively impacting your operations and revenue.
- For further assistance, please connect with our analysts.
 Request Customization
 Inquire Before Buying
 Speak to an Analyst
 Request Brochure
Benefits of Customization
- Personalize this research
- Triangulate with your data
- Get data as per your format and definition
- Gain a deeper dive into a specific application, geography, customer, or competitor
- Any level of personalization
Get in Touch With Us
UNITED STATES
Phone: +1-201-971-6302
INDIA
Phone: +91-120-433-0800
UNITED KINGDOM
Phone: +44-753-714-6104
Email: [email protected]
Client Testimonials


.webp)


Why Choose Us
IMARC offers trustworthy, data-centric insights into commodity pricing and evolving market trends, enabling businesses to make well-informed decisions in areas such as procurement, strategic planning, and investments. With in-depth knowledge spanning more than 1000 commodities and a vast global presence in over 150 countries, we provide tailored, actionable intelligence designed to meet the specific needs of diverse industries and markets.
1000
+Commodities
150
+Countries Covered
3000
+Clients
20
+Industry
Robust Methodologies & Extensive Resources
IMARC delivers precise commodity pricing insights using proven methodologies and a wealth of data to support strategic decision-making.
Subscription-Based Databases
Our extensive databases provide detailed commodity pricing, import-export trade statistics, and shipment-level tracking for comprehensive market analysis.
Primary Research-Driven Insights
Through direct supplier surveys and expert interviews, we gather real-time market data to enhance pricing accuracy and trend forecasting.
Extensive Secondary Research
We analyze industry reports, trade publications, and market studies to offer tailored intelligence and actionable commodity market insights.
Trusted by 3000+ industry leaders worldwide to drive data-backed decisions. From global manufacturers to government agencies, our clients rely on us for accurate pricing, deep market intelligence, and forward-looking insights.