
South Africa Children’s Entertainment Centers Market Size, Share, Trends and Forecast by Visitor Demographics, Facility Size, Revenue Source, Activity Area, and Region, 2026-2034
South Africa Children’s Entertainment Centers Market Overview:
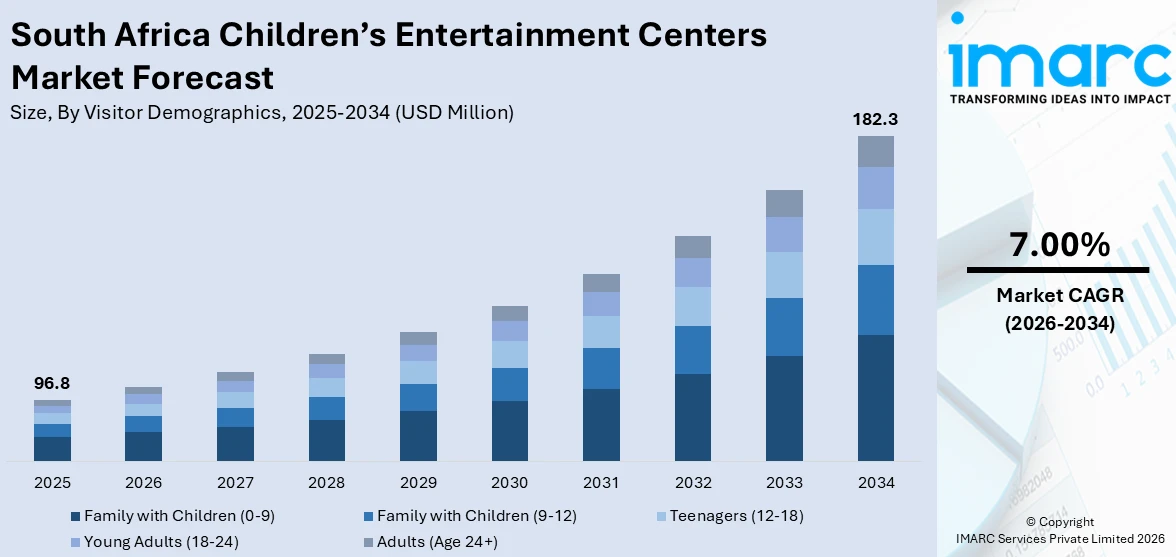
The South Africa children’s entertainment centers market size reached USD 96.8 Million in 2025. Looking forward, IMARC Group expects the market to reach USD 182.3 Million by 2034, exhibiting a growth rate (CAGR) of 7.00% during 2026-2034. Rising urbanization, increasing disposable income, growing demand for experiential leisure, and heightened focus on child development are some of the factors contributing to the South Africa children’s entertainment centers market share. Technological integration, themed attractions, and shopping mall expansions also contribute to boosting visitor traffic and business viability.
|
Report Attribute
|
Key Statistics
|
|---|---|
|
Base Year
|
2025
|
|
Forecast Years
|
2026-2034
|
|
Historical Years
|
2020-2025
|
| Market Size in 2025 | USD 96.8 Million |
| Market Forecast in 2034 | USD 182.3 Million |
| Market Growth Rate 2026-2034 | 7.00% |
South Africa Children’s Entertainment Centers Market Trends:
Rise of Themed Indoor Edutainment Hubs
Urban middle-income families in South Africa are increasingly choosing indoor edutainment centers that combine play with structured learning. These facilities offer zones themed around science, nature, history, or role-play (e.g., mini-cities or career simulations), which appeal to parents seeking more than just recreational value. Operators are partnering with educators and psychologists to build curriculum-based activities disguised as fun, aiming to boost cognitive and social development. Shopping malls and mixed-use developments are supporting these concepts to drive foot traffic. There's also a growing push toward sensory-inclusive environments for neurodiverse children, helping brands widen their audience. Operators who build long-term loyalty through memberships, workshops, and seasonal programming are outperforming those focused only on one-off ticket sales. This model is especially successful in Johannesburg and Cape Town, where higher population density and disposable income make recurring visits viable. As competition increases, uniqueness and perceived developmental value are becoming stronger differentiators than flashy equipment or size. These factors are intensifying the South Africa children’s entertainment centers market growth.
To get more information on this market Request Sample
Expansion of Outdoor, Nature-Focused Play Zones
In contrast, rural and semi-urban areas in South Africa are seeing a different movement: the resurgence of open-air play spaces tied to eco-tourism, adventure sports, or wildlife experiences. Instead of digital setups or indoor structures, these centers use local landscapes and minimal infrastructure to create obstacle courses, rope parks, animal farms, and sensory gardens. The appeal lies in affordability, low-tech charm, and physical freedom, especially in provinces like KwaZulu-Natal and Limpopo. They're also tapping into school trip markets, with partnerships offering packaged outdoor learning and play. Parents concerned with screen time are opting for these unplugged environments, where kids engage in risk-taking, teamwork, and physical activity. Municipal governments and private landowners are also funding such spaces under community development or wellness initiatives. These centers tend to operate with low overhead and high repeat visitation, especially on weekends and holidays, making them financially sustainable even without luxury pricing or tech-heavy investments.
South Africa Children’s Entertainment Centers Market Segmentation:
IMARC Group provides an analysis of the key trends in each segment of the market, along with forecasts at the country and regional levels for 2026-2034. Our report has categorized the market based on visitor demographics, facility size, revenue source, and activity area.
Visitor Demographics Insights:
- Family with Children (0-9)
- Family with Children (9-12)
- Teenagers (12-18)
- Young Adults (18-24)
- Adults (Age 24+)
The report has provided a detailed breakup and analysis of the market based on the visitor demographics. This includes family with children (0-9), family with children (9-12), teenagers (12-18), young adults (18-24), and adults (age 24+).
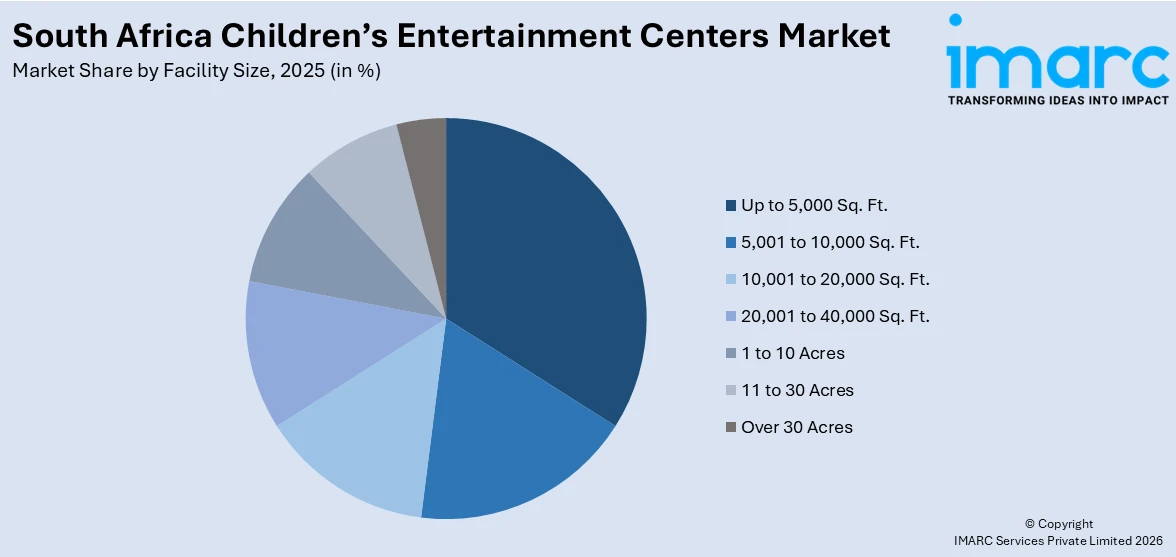
Facility Size Insights:
Access the comprehensive market breakdown Request Sample
- Up to 5,000 Sq. Ft.
- 5,001 to 10,000 Sq. Ft.
- 10,001 to 20,000 Sq. Ft.
- 20,001 to 40,000 Sq. Ft.
- 1 to 10 Acres
- 11 to 30 Acres
- Over 30 Acres
The report has provided a detailed breakup and analysis of the market based on the facility size. This includes up to 5,000 sq. ft., 5,001 to 10,000 sq. ft., 10,001 to 20,000 sq. ft., 20,001 to 40,000 sq. ft., 1 to 10 acres, 11 to 30 acres, and over 30 acres.
Revenue Source Insights:
- Entry Fees and Ticket Sales
- Food and Beverages
- Merchandising
- Advertising
- Others
The report has provided a detailed breakup and analysis of the market based on the revenue source. This includes entry fees and ticket sales, food and beverages, merchandising, advertising, and others.
Activity Area Insights:
- Arcade Studios
- AR and VR Gaming Zone
- Physical Play Activities
- Skill/Competition Games
- Others
A detailed breakup and analysis of the market based on the activity area have also been provided in the report. This includes arcade studios, AR and VR gaming zone, physical play activities, skill/competition games, and others.

Regional Insights:
- Gauteng
- KwaZulu-Natal
- Western Cape
- Mpumalanga
- Eastern Cape
- Others
The report has also provided a comprehensive analysis of all the major regional markets, which include Gauteng, KwaZulu-Natal, Western Cape, Mpumalanga, Eastern Cape, and others.
Competitive Landscape:
The market research report has also provided a comprehensive analysis of the competitive landscape. Competitive analysis such as market visitor demographics, key player positioning, top winning strategies, competitive dashboard, and company evaluation quadrant has been covered in the report. Also, detailed profiles of all major companies have been provided.
South Africa Children’s Entertainment Centers Market News:
- In October 2024, BOUNCE Inc South Africa secured major recognition in the children’s entertainment space, winning Best Kids’ Party Spot by The Best of Joburg for the third consecutive year. It also received BEELD’s Silver Award and was voted Durban’s Best Kids Party Venue. These accolades highlighted BOUNCE’s continued influence in South Africa’s kids party scene, backed by its global experience hosting over 100,000 parties in 13 countries.
South Africa Children’s Entertainment Centers Market Report Coverage:
| Report Features | Details |
|---|---|
| Base Year of the Analysis | 2025 |
| Historical Period | 2020-2025 |
| Forecast Period | 2026-2034 |
| Units | Million USD |
| Scope of the Report |
Exploration of Historical Trends and Market Outlook, Industry Catalysts and Challenges, Segment-Wise Historical and Future Market Assessment:
|
| Visitor Demographics Covered | Family with Children (0-9), Family with Children (9-12), Teenagers (12-18), Young Adults (18-24), Adults (Age 24+) |
| Facility Sizes Covered | Up to 5,000 Sq. Ft., 5,001 to 10,000 Sq. Ft., 10,001 to 20,000 Sq. Ft., 20,001 to 40,000 Sq. Ft., 1 to 10 Acres, 11 to 30 Acres, Over 30 Acres |
| Revenue Sources Covered | Entry Fees and Ticket Sales, Food and Beverages, Merchandising, Advertising, Others |
| Activity Areas Covered | Arcade Studios, AR and VR Gaming Zone, Physical Play Activities, Skill/Competition Games, Others |
| Regions Covered | Gauteng, KwaZulu-Natal, Western Cape, Mpumalanga, Eastern Cape, Others |
| Customization Scope | 10% Free Customization |
| Post-Sale Analyst Support | 10-12 Weeks |
| Delivery Format | PDF and Excel through Email (We can also provide the editable version of the report in PPT/Word format on special request) |
Key Questions Answered in This Report:
- How has the South Africa children’s entertainment centers market performed so far and how will it perform in the coming years?
- What is the breakup of the South Africa children’s entertainment centers market on the basis of visitor demographics?
- What is the breakup of the South Africa children’s entertainment centers market on the basis of facility size?
- What is the breakup of the South Africa children’s entertainment centers market on the basis of revenue source?
- What is the breakup of the South Africa children’s entertainment centers market on the basis of activity area?
- What is the breakup of the South Africa children’s entertainment centers market on the basis of region?
- What are the various stages in the value chain of the South Africa children’s entertainment centers market?
- What are the key driving factors and challenges in the South Africa children’s entertainment centers market?
- What is the visitor demographics of the South Africa children’s entertainment centers market and who are the key players?
- What is the degree of competition in the South Africa children’s entertainment centers market?
Key Benefits for Stakeholders:
- IMARC’s industry report offers a comprehensive quantitative analysis of various market segments, historical and current market trends, market forecasts, and dynamics of the South Africa children’s entertainment centers market from 2020-2034.
- The research report provides the latest information on the market drivers, challenges, and opportunities in the South Africa children’s entertainment centers market.
- Porter's five forces analysis assist stakeholders in assessing the impact of new entrants, competitive rivalry, supplier power, buyer power, and the threat of substitution. It helps stakeholders to analyze the level of competition within the South Africa children’s entertainment centers industry and its attractiveness.
- Competitive landscape allows stakeholders to understand their competitive environment and provides an insight into the current positions of key players in the market.
Need more help?
- Speak to our experienced analysts for insights on the current market scenarios.
- Include additional segments and countries to customize the report as per your requirement.
- Gain an unparalleled competitive advantage in your domain by understanding how to utilize the report and positively impacting your operations and revenue.
- For further assistance, please connect with our analysts.
 Request Customization
 Speak to an Analyst
 Request Brochure
 Inquire Before Buying
Benefits of Customization
- Personalize this research
- Triangulate with your data
- Get data as per your format and definition
- Gain a deeper dive into a specific application, geography, customer, or competitor
- Any level of personalization
Get in Touch With Us
UNITED STATES
Phone: +1-201-971-6302
INDIA
Phone: +91-120-433-0800
UNITED KINGDOM
Phone: +44-753-714-6104
Email: [email protected]
Client Testimonials


.webp)


