
South Africa Oil and Gas Market Size, Share, Trends and Forecast by Type, Application, and Region, 2026-2034
South Africa Oil and Gas Market Overview:
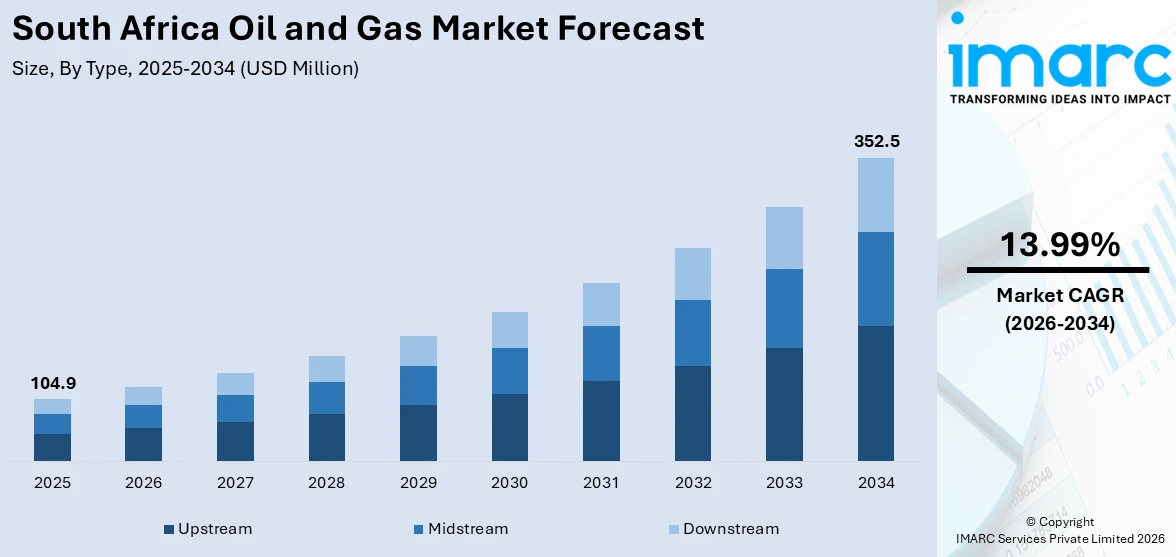
The South Africa oil and gas market size reached USD 104.9 Million in 2025. The market is projected to reach USD 352.5 Million by 2034, exhibiting a growth rate (CAGR) of 13.99% during 2026-2034. Industrial expansion, growing transportation demand, and infrastructure investments underpin growth, alongside regulatory reforms encouraging exploration. Declining refining capacity increases import reliance, prompting infrastructure modernization. These dynamics determine the South Africa oil and gas market share.
|
Report Attribute
|
Key Statistics
|
|---|---|
|
Base Year
|
2025
|
|
Forecast Years
|
2026-2034
|
|
Historical Years
|
2020-2025
|
| Market Size in 2025 | USD 104.9 Million |
| Market Forecast in 2034 | USD 352.5 Million |
| Market Growth Rate 2026-2034 | 13.99% |
South Africa Oil and Gas Market Trends:
Expansion of Offshore and Onshore Exploration Activities
South Africa's oil and gas sector is experiencing heightened exploration momentum, particularly offshore along the Orange Basin and even onshore in regions like Mpumalanga. For instance, TotalEnergies is preparing to drill up to seven exploration wells offshore South Africa starting in 2026, pending environmental clearance. These efforts reflect a strategic shift to enhance domestic hydrocarbon production capacity. Regulatory reforms, including the Upstream Petroleum Resources Development Act, are designed to attract investment and streamline licensing. As exploration activities intensify, the region’s energy supply landscape is evolving, positioning domestic production as a vital contributor to South Africa oil and gas market growth.
To get more information on this market Request Sample
Refinery Modernization and Cleaner Fuel Compliance
With domestic refining assets significantly reduced, South Africa is focusing on upgrading remaining refineries to meet environmental standards. Astron Energy, for example, is investing heavily to comply with Clean Fuels II regulations, transitioning to Euro 5 fuel standards. This modernization supports cleaner fuel production, mitigates supply disruptions, and addresses the country's dependency on imports. Meanwhile, efforts to revive mothballed refineries and enhance local processing capacity are ongoing. These infrastructure investments and regulatory compliance efforts simultaneously support environmental goals and strengthen supply reliability, fueling South Africa oil and gas market growth. For instance, Astron Energy’s Milnerton refinery in Cape Town has an output capacity of 100,000 barrels per day, making it South Africa’s second-largest refinery.
South Africa Oil and Gas Market Segmentation:
IMARC Group provides an analysis of the key trends in each segment of the market, along with forecasts at the country and regional level for 2026-2034. Our report has categorized the market based on type and application.
Type Insights:
- Upstream
- Midstream
- Downstream
The report has provided a detailed breakup and analysis of the market based on the type. This includes upstream, midstream, and downstream.
Application Insights:
Access the comprehensive market breakdown Request Sample
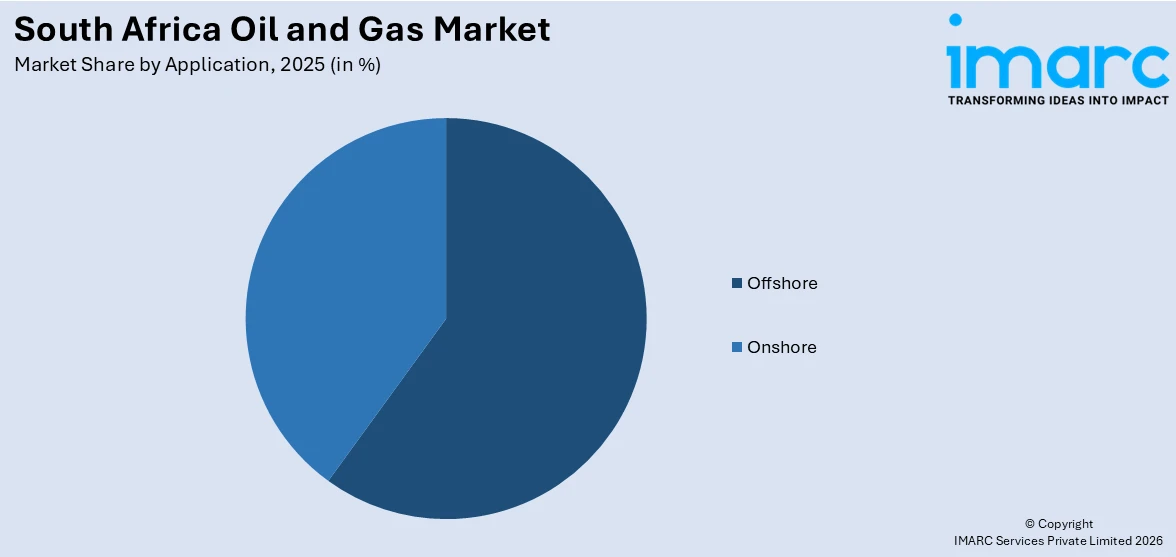
- Offshore
- Onshore
The report has provided a detailed breakup and analysis of the market based on the application. This includes offshore and onshore.
Regional Insights:
- Gauteng
- KwaZulu-Natal
- Western Cape
- Mpumalanga
- Eastern Cape
- Others
The report has also provided a comprehensive analysis of all the major provinces, which include Gauteng, KwaZulu-Natal, Western Cape, Mpumalanga, Eastern Cape, and others.

Competitive Landscape:
The market research report has also provided a comprehensive analysis of the competitive landscape. Competitive analysis such as market structure, key player positioning, top winning strategies, competitive dashboard, and company evaluation quadrant has been covered in the report. Also, detailed profiles of all major companies have been provided.
South Africa Oil and Gas Market News:
- In July 2025, Shell received environmental approval to drill up to five deep-water wells in the Northern Cape Ultra Deep Block (off South Africa’s west coast) at depths between 2,500–3,200 m. This signals renewed momentum in offshore exploration and reinforces efforts to boost domestic energy security. Shell highlighted that viable discoveries could meaningfully strengthen energy supply and economic development.
- In March 2025, Astron Energy—a unit of Glencore—announced a R6 billion (approx. USD 328 million) investment to upgrade its Milnerton refinery near Cape Town, enabling compliance with Clean Fuels II and transition to Euro 5 fuel standards by mid-2027. This ensures cleaner fuel production and supports supply resilience amid declining domestic refining capacity.
South Africa Oil and Gas Market Report Coverage:
| Report Features | Details |
|---|---|
| Base Year of the Analysis | 2025 |
| Historical Period | 2020-2025 |
| Forecast Period | 2026-2034 |
| Units | Million USD |
| Scope of the Report |
Exploration of Historical Trends and Market Outlook, Industry Catalysts and Challenges, Segment-Wise Historical and Future Market Assessment:
|
| Types Covered | Upstream, Midstream, Downstream |
| Applications Covered | Offshore, Onshore |
| Regions Covered | Gauteng, KwaZulu-Natal, Western Cape, Mpumalanga, Eastern Cape, Others |
| Customization Scope | 10% Free Customization |
| Post-Sale Analyst Support | 10-12 Weeks |
| Delivery Format | PDF and Excel through Email (We can also provide the editable version of the report in PPT/Word format on special request) |
Key Questions Answered in This Report:
- How has the South Africa oil and gas market performed so far and how will it perform in the coming years?
- What is the breakup of the South Africa oil and gas market on the basis of type?
- What is the breakup of the South Africa oil and gas market on the basis of application?
- What is the breakup of the South Africa oil and gas market on the basis of region?
- What are the various stages in the value chain of the South Africa oil and gas market?
- What are the key driving factors and challenges in the South Africa oil and gas market?
- What is the structure of the South Africa oil and gas market and who are the key players?
- What is the degree of competition in the South Africa oil and gas market?
Key Benefits for Stakeholders:
- IMARC’s industry report offers a comprehensive quantitative analysis of various market segments, historical and current market trends, market forecasts, and dynamics of the South Africa oil and gas market from 2020-2034.
- The research report provides the latest information on the market drivers, challenges, and opportunities in the South Africa oil and gas market.
- Porter's Five Forces analysis assists stakeholders in assessing the impact of new entrants, competitive rivalry, supplier power, buyer power, and the threat of substitution. It helps stakeholders to analyze the level of competition within the South Africa oil and gas industry and its attractiveness.
- Competitive landscape allows stakeholders to understand their competitive environment and provides an insight into the current positions of key players in the market.
Need more help?
- Speak to our experienced analysts for insights on the current market scenarios.
- Include additional segments and countries to customize the report as per your requirement.
- Gain an unparalleled competitive advantage in your domain by understanding how to utilize the report and positively impacting your operations and revenue.
- For further assistance, please connect with our analysts.
 Request Customization
 Speak to an Analyst
 Request Brochure
 Inquire Before Buying
Benefits of Customization
- Personalize this research
- Triangulate with your data
- Get data as per your format and definition
- Gain a deeper dive into a specific application, geography, customer, or competitor
- Any level of personalization
Get in Touch With Us
UNITED STATES
Phone: +1-201-971-6302
INDIA
Phone: +91-120-433-0800
UNITED KINGDOM
Phone: +44-753-714-6104
Email: [email protected]
Client Testimonials


.webp)


