
Stainless Steel Prices, Trend, Chart, Demand, Market Analysis, News, Historical and Forecast Data Report 2026 Edition
Stainless Steel Price Trend, Index and Forecast
Track real-time and historical stainless steel prices across global regions. Updated monthly with market insights, drivers, and forecasts.
Stainless Steel Prices May 2026
| Region | Price (USD/KG) | Latest Movement |
|---|---|---|
| Northeast Asia | 1.83 | 8.3% ↑ Up |
| Europe | 2.91 | 2.5% ↑ Up |
| India | 2.45 | 6.1% ↑ Up |
| Middle East | 2.64 | 6.9% ↑ Up |
| Southeast Asia | 2.51 | 6.8% ↑ Up |
| North America | 2.74 | -7.4% ↓ Down |
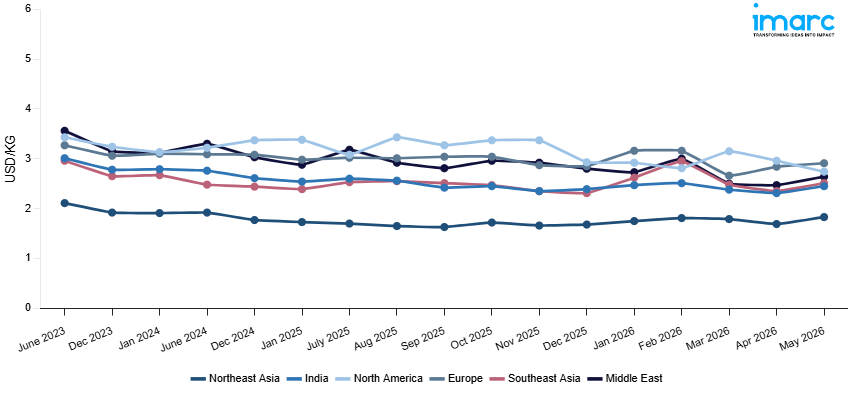
Stainless Steel Price Index (USD/KG):
The chart below highlights monthly stainless steel prices across different regions.
Get Access to Monthly/Quarterly/Yearly Prices, Request Sample
Market Overview Q1 Ending March 2026
Northeast Asia: The stainless steel prices in Northeast Asia reached 1.79 USD/KG in March 2026. The upward pricing movement registered between December and March 2026 was 6.5%. Firm demand from the automotive, construction, and industrial equipment manufacturing sectors drove active stainless steel procurement and reinforced bullish pricing conditions across Northeast Asian markets throughout the review period. Rising upstream nickel, chromium, and ferroalloy feedstock costs at regional steel production facilities elevated manufacturing expenses and provided consistent upward support to prevailing regional market rates during the quarter.
Europe: The stainless steel prices in Europe reached 2.66 USD/KG in March 2026. The downward pricing movement registered between December and March 2026 was 6.7%. Weakened demand from the construction, automotive, and industrial equipment manufacturing sectors reduced procurement activity and contributed to bearish stainless steel market conditions across European markets throughout the review period. Competitive import cargo availability from Asian supplying nations, particularly China, exerted consistent downward pressure on prevailing European market rates and limited regional producers' ability to sustain existing price levels during the quarter. Declining upstream nickel and chromium feedstock costs at regional steel production facilities reduced manufacturing expenses, eroding the cost floor supporting prevailing regional stainless steel price levels.
India: The stainless steel prices in India reached 2.38 USD/KG in March 2026. The downward pricing movement registered between December and March 2026 was 0.4%. Marginally softening demand from the construction, kitchenware, and industrial equipment manufacturing sectors tempered procurement activity and contributed to mild bearish conditions across Indian markets throughout the review period. Adequate import cargo availability from Chinese and Southeast Asian supplying regions maintained sufficient domestic supply conditions and placed modest downward pressure on prevailing Indian stainless steel market rates during the quarter. Slightly declining upstream nickel and chromium feedstock costs at domestic production facilities reduced manufacturing expenses and weakened the cost support for existing price levels.
Middle East: The stainless steel prices in the Middle East reached 2.50 USD/KG in March 2026. The downward pricing movement registered between December and March 2026 was 10.7%. The sharp decrease in procurement due to weak demand from the construction, petrochemical, and industrial equipment segments had a pronounced impact on the overall bearish trend observed in the stainless steel market in the Middle East region during the period under review. The presence of large volumes of imported goods from low cost suppliers in Asia increased pressure on prices, tipping the balance in favor of the supply side. The significant drop in upstream costs of raw materials such as nickel, chromium, and ferroalloys in leading producer countries lowered production costs, weakening the pricing support for current stainless steel prices.
Southeast Asia: The stainless steel prices in Southeast Asia reached 2.48 USD/KG in March 2026. The upward pricing movement registered between December and March 2026 was 7.4%. Firm demand from the construction, food processing equipment, and industrial manufacturing sectors drove active stainless steel procurement and reinforced bullish pricing conditions across Southeast Asian markets throughout the review period. Rising upstream nickel and chromium feedstock costs at regional and importing steel production facilities elevated manufacturing expenses and provided consistent upward support to prevailing market rates during the quarter. Constrained import cargo availability from Northeast Asian supplying regions tightened overall Southeast Asian supply conditions and intensified competition among downstream industrial and construction buyers for available volumes.
North America: The stainless steel prices in North America reached 3.15 USD/KG in March 2026. The upward pricing movement registered between December and March 2026 was 7.5%. Improved demand for stainless steel from the automotive, aviation, and heavy machinery manufacturing industries drove solid demand and supported the upward trend in price expectations in the North American market during the quarter under review. The rise in the cost of raw materials such as nickel, chromium, and ferroalloys used in the domestic manufacturing of stainless steel contributed to higher manufacturing costs and, consequently, a continuous rise in regional market prices during the quarter. Reduced stainless steel manufacturing in the domestic market due to maintenance in key manufacturing plants, limited supplies of the product, and heightened competition amongst industrial buyers in the region.
Market Overview Q4 Ending December 2025
Northeast Asia: The stainless steel prices in Northeast Asia reached 1.68 USD/KG in December 2025. The upward pricing movement registered between September and December 2025 was 3.0%. Prices rose steadily, supported by sustained demand from the automotive, appliance, and light construction industries. Mills regulated production levels, avoiding surplus availability in the local market. Prices for raw materials, especially nickel and chromium, stayed steady, offering cost support to steel product pricing. Demand from nearby markets also helped maintain consistent order books. Service centers reported stable inventory levels, prompting regular restocking rather than extensive buying.
Europe: The stainless steel prices in Europe reached 2.85 USD/KG in December 2025. The downward pricing movement registered between September and December 2025 was 6.2%. Prices declined due to reduced demand from the construction, automotive, and heavy machinery manufacturing industries. Purchasers restricted purchases to necessary quantities, indicating careful spending habits and moderate project flows. Local mills functioned at stable levels, and regular import shipments enhanced market supply choices. Producers' competitive pricing strategies increased pressure on transaction values. Raw material supplies stayed accessible without major cost increases, limiting upward price pressure.
India: The stainless steel prices in India reached 2.39 USD/KG in December 2025. The downward pricing movement registered between September and December 2025 was 1.1%. Prices changed slightly as demand from the infrastructure, manufacturing, and consumer goods sectors remained steady, but this was insufficient to restore full production levels. Domestic mills maintain consistent production levels, ensuring adequate material availability across distribution networks. Import competition also influenced market sentiment, with foreign providers offering appealing proposals. Purchasers adopted careful sourcing methods, aligning acquisitions with confirmed orders rather than speculative stock. Input expenses, like nickel, remained relatively stable over the quarter.
Middle East: The stainless steel prices in the Middle East reached 2.80 USD/KG in December 2025. The downward pricing movement registered between September and December 2025 was 0.2%. Prices remained nearly unchanged as demand from ongoing construction and industrial projects provided consistent support. Procurement volumes were steady, reflecting active infrastructure developments and routine fabrication requirements. Import supplies remained accessible, ensuring adequate product availability across key trading hubs. Mills adjusted production in line with order flows, preventing excessive stock accumulation. Raw material costs displayed minimal volatility, limiting abrupt price movements. Buyers maintained balanced inventory positions and avoided aggressive bulk purchases.
Southeast Asia: The stainless steel prices in Southeast Asia reached 2.31 USD/KG in December 2025. The downward pricing movement registered between September and December 2025 was 8.1%. Prices dropped significantly due to decreased construction activity and lower orders from manufacturing sector. Import availability remained substantial, heightening rivalry among local suppliers. Mills reacted by modifying proposals to encourage purchasing interest amid wary buyer sentiment. Downstream sectors sustained minimal purchase quantities, concentrating mainly on immediate needs. The costs of raw materials offered little assistance in stabilizing prices. Warehouses indicated adequate inventory levels, decreasing the necessity for prompt restocking.
North America: The stainless steel prices in North America reached 2.93 USD/KG in December 2025. The downward pricing movement registered between September and December 2025 was 10.5%. Prices fell sharply as demand weakened from the automotive, construction, and machinery manufacturing industries during the quarter. Domestic output remained constant, while imports helped enhance supply availability in the market. Purchasers focused on maximizing inventory efficiency and avoided large volume commitments. Mills implemented competitive discounts to win contracts and maintain stable shipment levels. The input of raw materials stayed constant, providing minimal cost driven assistance. Service centers indicated stable inventory levels, decreasing the need for restocking.
Market Overview Q3 Ending September 2025
Northeast Asia: Demand softened particularly in downstream sectors such as construction and certain manufacturing, partly due to weakening investment in real estate and infrastructure in China and neighbouring markets. On the supply side, raw material inputs, especially nickel, saw an oversupply push, which caused downward pressure. Notably, Indonesia’s export quotas for nickel pig iron eased some cost burdens for mills in the region. Shipping and logistics costs remained elevated due to persistent bottlenecks, but improvements compared to earlier in the year limited their impact. Currency fluctuations also played a role as many Northeast Asian producers experienced local currency strengthening vs USD, which reduced cost of imported raw materials when priced in USD, thus helping margin stabilization. Domestic logistics and energy costs, however, remained significant cost components, with energy prices in some Northeast Asian countries higher due to regulatory and environmental compliance charges.
Europe: Europe witnessed a contrasting picture. With September showing a slight increase, the region benefitted from protective trade measures and a restrained supply environment. European stainless steel producers faced competition from cheaper imports, but rising energy costs and strict environmental regulations added cost pressure that allowed domestic producers to maintain or raise base prices in some product grades. Demand remained weak to moderate as construction, consumer goods, and industrial sectors showed slow growth, with firms delaying purchases in the face of macroeconomic uncertainty. On the supply side, reduced production in some high-cost regions limited available capacity, lending support to pricing.
India: Demand from infrastructure, real estate, and manufacturing sectors softened, slowed by rising interest rates and inflationary pressures that inhibited large capex. On the supply side, raw materials saw mixed movements. Domestic logistics continued to be expensive due to fuel cost variability, seasonal monsoon effects increasing transportation challenges, and power cost for steel plants under environmental compliance costs. Currency fluctuations also impacted costs as the Indian rupee’s movements increased the cost of imported raw materials when sourced in USD. Inventory levels among traders appear elevated, which led sellers to discount in order to clear stocks. Overall, the decline in prices reflected demand‐side weakness combined with only partial relief from raw material and logistics cost pressures.
Middle East: The Middle East saw a moderate decline in stainless steel prices. Demand was mixed including strong from oil and gas, infrastructure and petrochemical projects, but subdued in construction and consumer sectors due to economic headwinds, inflation and cost of capital. On the supply side, raw materials were largely imported, meaning that cost components like freight, customs duties, and port handling had an outsized impact. Energy costs, while generally lower in some Middle Eastern countries, were affected by domestic subsidies and regulatory changes, as environmental compliance and local content rules added cost burdens. Currency dynamics also played a role, especially in countries with weaker currencies vs USD, raising the local cost of imports. Domestic logistics challenges added further cost. In some Gulf countries, government infrastructure spending helped support baseline demand, but the support was insufficient to prevent a moderate price decline overall.
Southeast Asia: Southeast Asia saw a mild decline in stainless steel prices. Key demand sectors exhibited slower growth due to weaker global demand and inflation squeezing margins. On the supply side, raw material input costs softened somewhat, helping to moderate cost pressures, but freight and port handling costs remained volatile, especially for imports from supplier hubs. Domestic transportation and energy remain significant cost components for many Southeast Asian producers. Customs, tariffs, and trade policy, especially import duties on finished stainless steel or semi-finished products affected landed cost. Additionally, currency depreciation in some countries increased import input costs. Inventory accumulation in prior quarters led some suppliers to discount to maintain cash flow.
North America: Stainless steel prices in North America recorded a decline. The downward movement was largely attributed to muted demand from the construction and automotive sectors, where order volumes slowed amid cautious inventory management. On the supply side, stable production levels from US mills and steady import inflows maintained adequate availability, adding pressure to sellers. Feedstock costs for nickel and chromium showed limited support as global benchmark prices eased, while lower energy and logistics costs further softened overall pricing. Currency stability of the US dollar against key trading partners reduced import volatility but also limited upward momentum. Overall, the North American stainless steel market reflected subdued end-user demand and oversupply conditions, leading to a steady price correction.
Stainless Steel Price Trend, Market Analysis, and News
IMARC's latest publication, “Stainless Steel Prices, Trend, Chart, Demand, Market Analysis, News, Historical and Forecast Data Report 2026 Edition,” presents a detailed examination of the stainless steel market, providing insights into both global and regional trends that are shaping prices. This report delves into the spot price of stainless steel at major ports and analyzes the composition of prices, including FOB and CIF terms. It also presents detailed stainless steel prices trend analysis by region, covering North America, Europe, Asia Pacific, Latin America, and Middle East and Africa. The factors affecting stainless steel pricing, such as the dynamics of supply and demand, geopolitical influences, and sector-specific developments, are thoroughly explored. This comprehensive report helps stakeholders stay informed with the latest market news, regulatory updates, and technological progress, facilitating informed strategic decision-making and forecasting.
.webp)
Stainless Steel Industry Analysis
The global stainless steel industry size reached USD 171.94 Billion in 2025. By 2034, IMARC Group expects the market to reach USD 266.39 Billion, at a projected CAGR of 4.98% during 2026-2034. The market is driven by increasing demand across construction, automotive, consumer goods, and energy applications, supported by stainless steel’s durability, corrosion resistance, and recyclability.
Latest developments in the stainless steel industry:
- September 2025: Jindal Steel International submitted a non-binding offer to acquire Thyssenkrupp Steel Europe (TKSE). The proposal included over EUR 2 billion in investment directed at expanding electric-arc furnace capacity, preserving production in Germany, advancing green steel initiatives, and taking on pension liabilities.
- June 2025: Nippon Steel completed its USD 14.9 billion acquisition of US Steel. The deal included commitments for about USD 11 billion in investment into US operations by 2028, including funding for a new mill.
- May 2024: Jindal Stainless announced a strategic investment of INR 5,400 crores to enhance its melting and downstream capacities. The plan encompassed a joint venture in Indonesia for a 1.2 MTPA melt shop, expansion in Jajpur, and acquiring a 54% stake in Chromeni Steels; these moves were aimed to increase melting capacity by over 40% to 4.2 MTPA & improve product mix and sustainability.
- February 2024: Acerinox, via its wholly owned US subsidiary North American Stainless (NAS), entered into a definitive agreement to acquire Haynes International, a US manufacturer of high-performance alloys. The acquisition was an all-cash transaction and signals Acerinox’s push to strengthen its product portfolio in technologically advanced stainless steel & alloy grades.
Product Description
Stainless steel is an iron-based alloy containing a minimum of 10.5% chromium, which provides its signature corrosion resistance. Depending on composition, it may also include nickel, molybdenum, and other alloying elements to enhance strength, formability, and resistance to oxidation. Stainless steel is available in several grades, including austenitic, ferritic, martensitic, and duplex, each offering specific performance benefits. It is widely used in construction for structural components, in automotive manufacturing for exhaust systems and body parts, in consumer goods for appliances and kitchenware, and in energy infrastructure for pipelines and equipment. Its ability to withstand harsh environments, coupled with high recyclability, makes it indispensable in both industrial and consumer applications. The balance of strength, durability, and aesthetic appeal continues to drive its adoption worldwide.
Report Coverage
| Key Attributes | Details |
|---|---|
| Product Name | Stainless Steel |
| Report Features | Exploration of Historical Trends and Market Outlook, Industry Demand, Industry Supply, Gap Analysis, Challenges, Stainless Steel Price Analysis, and Segment-Wise Assessment. |
| Currency/Units | US$ (Data can also be provided in local currency) or Metric Tons |
| Region/Countries Covered | The current coverage includes analysis at the global and regional levels only. Based on your requirements, we can also customize the report and provide specific information for the following countries: Asia Pacific: China, India, Indonesia, Pakistan, Bangladesh, Japan, Philippines, Vietnam, Thailand, South Korea, Malaysia, Nepal, Taiwan, Sri Lanka, Hongkong, Singapore, Australia, and New Zealand Europe: Germany, France, United Kingdom, Italy, Spain, Russia, Turkey, Netherlands, Poland, Sweden, Belgium, Austria, Ireland, Switzerland, Norway, Denmark, Romania, Finland, Czech Republic, Portugal and Greece North America: United States and Canada Latin America: Brazil, Mexico, Argentina, Columbia, Chile, Ecuador, and Peru Middle East & Africa: Saudi Arabia, UAE, Israel, Iran, South Africa, Nigeria, Oman, Kuwait, Qatar, Iraq, Egypt, Algeria, and Morocco The list of countries presented is not exhaustive. Information on additional countries can be provided if required by the client. |
| Information Covered for Key Suppliers |
|
| Customization Scope | The report can be customized as per the requirements of the customer |
| Report Price and Purchase Option |
Plan A: Monthly Updates - Annual Subscription
Plan B: Quarterly Updates - Annual Subscription
Plan C: Biannually Updates - Annual Subscription
|
| Post-Sale Analyst Support | 360-degree analyst support after report delivery |
| Delivery Format | PDF and Excel through email (We can also provide the editable version of the report in PPT/Word format on special request) |
Key Benefits for Stakeholders:
- IMARC’s report presents a detailed analysis of stainless steel pricing, covering global and regional trends, spot prices at key ports, and a breakdown of ex-works, FOB, and CIF prices.
- The study examines factors affecting stainless steel price trend, including supply-demand shifts and geopolitical impacts, offering insights for informed decision-making.
- The competitive landscape review equips stakeholders with crucial insights into the latest market news, regulatory changes, and technological advancements, ensuring a well-rounded, strategic overview for forecasting and planning.
- IMARC offers various subscription options, including monthly, quarterly, and biannual updates, allowing clients to stay informed with the latest market trends, ongoing developments, and comprehensive market insights. The stainless steel price charts ensure our clients remain at the forefront of the industry.
Frequently Asked Questions About the Stainless Steel Price Index Report
The stainless steel prices in May 2026 were 1.83 USD/Kg in Northeast Asia, 2.91 USD/Kg in Europe, 2.45 USD/Kg in India, 2.64 USD/Kg in the Middle East, 2.51 USD/Kg in Southeast Asia, and 2.74 USD/Kg in North America.
The stainless steel pricing data is updated on a monthly basis.
We provide the pricing data primarily in the form of an Excel sheet and a PDF.
Yes, our report includes a forecast for stainless steel prices.
The regions covered include North America, Europe, Asia Pacific, Middle East, and Latin America. Countries can be customized based on the request (additional charges may be applicable).
Yes, we provide both FOB and CIF prices in our report.
Need more help?
- Speak to our experienced analysts for insights on the current market scenarios.
- Include additional segments and countries to customize the report as per your requirement.
- Gain an unparalleled competitive advantage in your domain by understanding how to utilize the report and positively impacting your operations and revenue.
- For further assistance, please connect with our analysts.
 Request Customization
 Inquire Before Buying
 Speak to an Analyst
 Request Brochure
Benefits of Customization
- Personalize this research
- Triangulate with your data
- Get data as per your format and definition
- Gain a deeper dive into a specific application, geography, customer, or competitor
- Any level of personalization
Get in Touch With Us
UNITED STATES
Phone: +1-201-971-6302
INDIA
Phone: +91-120-433-0800
UNITED KINGDOM
Phone: +44-753-714-6104
Email: [email protected]
Client Testimonials


.webp)


Why Choose Us
IMARC offers trustworthy, data-centric insights into commodity pricing and evolving market trends, enabling businesses to make well-informed decisions in areas such as procurement, strategic planning, and investments. With in-depth knowledge spanning more than 1000 commodities and a vast global presence in over 150 countries, we provide tailored, actionable intelligence designed to meet the specific needs of diverse industries and markets.
1000
+Commodities
150
+Countries Covered
3000
+Clients
20
+Industry
Robust Methodologies & Extensive Resources
IMARC delivers precise commodity pricing insights using proven methodologies and a wealth of data to support strategic decision-making.
Subscription-Based Databases
Our extensive databases provide detailed commodity pricing, import-export trade statistics, and shipment-level tracking for comprehensive market analysis.
Primary Research-Driven Insights
Through direct supplier surveys and expert interviews, we gather real-time market data to enhance pricing accuracy and trend forecasting.
Extensive Secondary Research
We analyze industry reports, trade publications, and market studies to offer tailored intelligence and actionable commodity market insights.
Trusted by 3000+ industry leaders worldwide to drive data-backed decisions. From global manufacturers to government agencies, our clients rely on us for accurate pricing, deep market intelligence, and forward-looking insights.