
Steam Trap Market Report by Product Type (Thermodynamic, Mechanical, Thermostatic), Application (Instrument Steam Tracing, Line Steam Tracing, Drip Application, Process Application, and Others), Material Type (Steel, Iron, and Others), Distribution Channel (Online, Offline), End-Use Industry (Oil & Gas, Power Generation, Pharmaceuticals, Food & Beverages, Pulp & Paper, Chemical, and Others), and Region 2026-2034
Steam Trap Market Size:
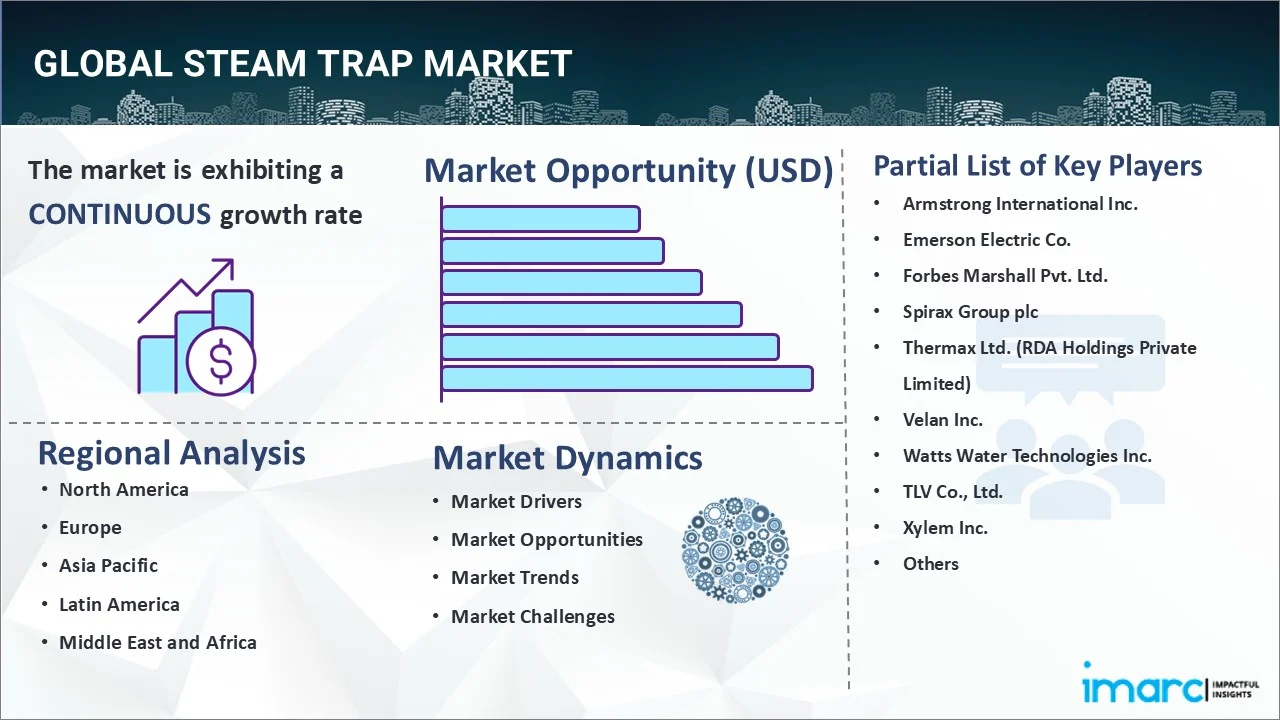
The global steam trap market size reached USD 4.7 Billion in 2025. Looking forward, IMARC Group expects the market to reach USD 6.4 Billion by 2034, exhibiting a growth rate (CAGR) of 3.30% during 2026-2034. The market is experiencing stable growth driven by the growing environmental awareness, along with rising energy costs, expansion of industrial sectors and the demand for process optimization, and implementation of stringent regulatory standards and guidelines related to safety, emissions, and energy efficiency.
|
Report Attribute
|
Key Statistics
|
|---|---|
|
Base Year
|
2025
|
|
Forecast Years
|
2026-2034
|
|
Historical Years
|
2020-2025
|
|
Market Size in 2025
|
USD 4.7 Billion |
|
Market Forecast in 2034
|
USD 6.4 Billion |
| Market Growth Rate 2026-2034 | 3.30% |
Steam Trap Market Analysis:
- Market Growth and Size: The market is witnessing steady growth, driven by the increasing demand for energy-efficient solutions across industries. Additionally, the emphasis on sustainability and environmental concerns is impelling the market growth.
- Technological Advancements: Technological innovations are leading to the development of more efficient and reliable steam trap solutions, contributing to the growth of the market.
- Industry Applications: Steam traps find applications across various industries, including oil and gas, chemicals, food processing, and power generation, due to their role in efficient steam management.
- Geographical Trends: Asia Pacific leads the market, driven by the increasing demand for steam traps across various industries. However, North America is emerging as a fast-growing market, driven by the rising need for energy efficiency and process optimization in industrial facilities.
- Competitive Landscape: The market is characterized by intense competition with several key players, each vying for market share through innovation and competitive pricing. These companies are also striving to meet the growing demand for energy-efficient solutions.
- Challenges and Opportunities: While the market faces challenges, such as the need for continuous maintenance and the potential for steam trap failure, it also encounters opportunities in maintenance service providers and innovative solutions to address reliability issues.
- Future Outlook: The future of the steam trap market looks promising, with industries focusing on energy efficiency. The market is expected to witness further growth driven by technological advancements and increasing awareness of energy conservation.
To get more information on this market Request Sample
Steam Trap Market Trends:
Energy efficiency imperative
The increasing environmental awareness, along with rising energy costs, represents one of the key factors supporting the growth of the market. Steam traps play a pivotal role in ensuring that steam systems operate at their highest efficiency levels. By effectively removing condensate and non-condensable gases from steam lines, steam traps prevent energy wastage, reduce fuel consumption, and lower greenhouse gas emissions. This aligns with global sustainability goals and regulatory mandates to reduce carbon footprints. Industries, ranging from manufacturing to healthcare, are increasingly investing in energy-efficient solutions, making steam traps a critical component of their sustainability strategies. This focus on energy conservation not only drives the demand for modern steam trap technologies but also fuels ongoing research and development (R&D) activities to enhance their efficiency.
Industrial expansion and process optimization
The expansion of industrial sectors and the demand for process optimization are propelling the growth of the market. As industries are evolving, there is a growing demand for reliable and efficient steam systems. Steam is a critical component in various industrial processes, including manufacturing, power generation, and chemical production. Industries rely on steam traps to prevent condensate buildup, which can lead to equipment damage and reduced process efficiency. Moreover, as industries are striving to optimize their production processes to reduce costs and improve product quality, the role of steam traps becomes even more essential. They aid in maintaining consistent steam pressure and temperature, contributing to better process control and overall operational efficiency. Consequently, as industries are expanding and seeking process improvements, the demand for steam traps is rising.
Stringent regulatory standards
The implementation of stringent regulatory standards and guidelines related to safety, emissions, and energy efficiency is impelling the market growth. Governments and industry organizations worldwide are increasingly focusing on reducing energy consumption and emissions in industrial processes. Steam traps play a critical role in achieving these objectives by efficiently managing steam systems. Regulatory bodies often require industries to adhere to specific energy efficiency and emissions reduction targets, which necessitate the use of advanced steam traps to prevent steam loss and reduce greenhouse gas emissions associated with inefficient steam systems. Moreover, safety regulations mandate the proper operation of steam equipment to prevent accidents, making steam traps a crucial component for compliance.
Maintenance cost reduction
Steam systems in industries require consistent maintenance to operate efficiently. Inefficient or failed steam traps can lead to equipment damage and increased maintenance requirements. By investing in high-quality steam traps that effectively remove condensate and prevent steam leaks, industries can significantly reduce their maintenance expenses. These modern steam traps are designed for durability and longevity, minimizing the frequency of replacements or repairs. Additionally, the use of advanced technologies like predictive maintenance, which relies on data from smart steam traps, further reduces maintenance costs by allowing for timely interventions and preventing costly breakdowns.
Steam Trap Industry Segmentation:
IMARC Group provides an analysis of the key trends in each segment of the market, along with forecasts at the global, regional, and country levels for 2026-2034. Our report has categorized the market based on product type, application, material type, distribution channel, and end-use industry.
Breakup by Product Type:
To get detailed segment analysis of this market Request Sample
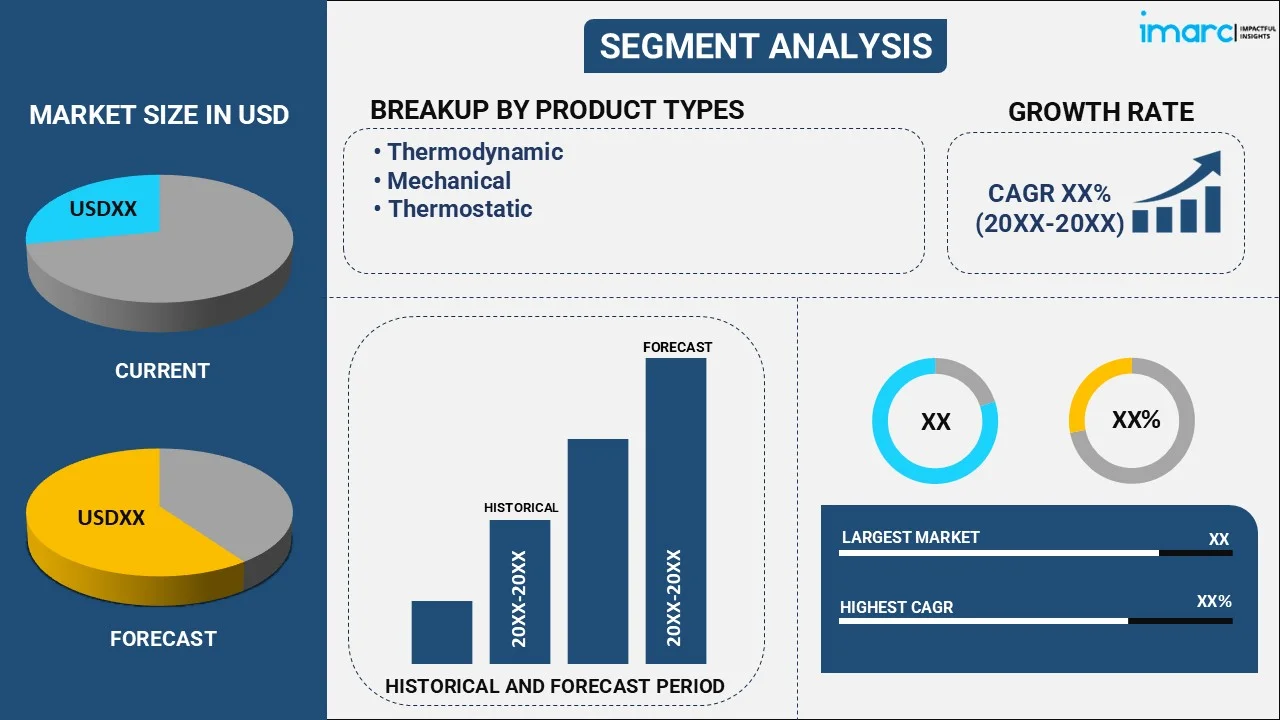
- Thermodynamic
- Mechanical
- Thermostatic
Mechanical accounts for the majority of the market share
The report has provided a detailed breakup and analysis of the market based on the product type. This includes thermodynamic, mechanical, and thermostatic. According to the report, mechanical represented the largest segment.
Mechanical steam traps operate based on mechanical principles and are renowned for their reliability and durability. They function by using float mechanisms or inverted bucket designs to efficiently discharge condensate and prevent steam from escaping. Mechanical steam traps are widely used in various industries due to their ability to handle varying condensate loads and pressures. They are particularly effective in applications with high condensate flow rates. Industries favor mechanical steam traps for their low maintenance requirements and longevity, making them a cost-effective choice for steam system management.
Thermostatic steam traps are another important segment in the steam trap market. These traps operate based on temperature-sensitive elements, such as bimetallic elements or wax-filled capsules. They open and close in response to temperature changes, making them suitable for applications where condensate loads and pressures fluctuate. Thermostatic steam traps excel in maintaining precise temperature control and are often used in the food and pharmaceutical industries.
Thermodynamic steam traps, while a smaller segment in the market, offer unique advantages. These traps work on the principle of fluid dynamics, using the velocity of steam to open and close a valve. They are simple in design and can handle high-pressure applications. Thermodynamic steam traps are often used in situations where mechanical or thermostatic traps may not be suitable, such as applications with rapid startup and shutdown cycles.
Breakup by Application:
- Instrument Steam Tracing
- Line Steam Tracing
- Drip Application
- Process Application
- Others
A detailed breakup and analysis of the market based on the application have also been provided in the report. This includes instrument steam tracing, line steam tracing, drip application, process application, and others.
Instrument steam tracing involves the use of steam traps to maintain consistent temperatures in instrumentation lines, ensuring accurate measurements and preventing freezing or condensation. This application is crucial in industries like petrochemicals and oil refining, where precise measurements are vital for process control and safety. Steam traps used in instrument steam tracing are designed to handle low condensate loads and maintain temperature control.
Line steam tracing is a common application in industries, such as food processing and chemical manufacturing. Steam traps in this segment are responsible for maintaining the temperature of pipelines, preventing the solidification of fluids, and ensuring the smooth flow of materials. These traps are designed to handle moderate condensate loads and are essential for maintaining the integrity and efficiency of various industrial processes.
Drip applications involve the removal of small amounts of condensate from equipment, such as steam mains and steam distribution lines. Drip steam traps are specifically designed to handle low condensate flow rates and are often used in scenarios where condensate must be removed continuously without disrupting the overall process. These traps play a critical role in preventing water hammer and maintaining the efficiency of steam systems.
Process applications encompass a wide range of industrial processes where steam is utilized for heating, sterilization, and other purposes. Steam traps in this segment are tailored to handle high condensate loads and are vital for ensuring efficient energy usage and process integrity. Industries, such as pharmaceuticals, textiles, and power generation, rely heavily on steam traps in process applications to maintain product quality and operational efficiency.
Breakup by Material Type:
- Steel
- Iron
- Others
Steel represents the leading market segment
The report has provided a detailed breakup and analysis of the market based on the material type. This includes steel, iron, and others. According to the report, steel represented the largest segment.
Steel steam traps are preferred for their durability, corrosion resistance, and ability to withstand high-pressure and high-temperature environments. They are commonly used in industries where steam systems are subjected to rigorous conditions, such as power generation, petrochemicals, and heavy manufacturing. Their robust construction ensures a long service life, reducing maintenance and replacement costs.
Iron steam traps, while a smaller segment in the market, continue to find applications in various industries. They are known for their cost-effectiveness and versatility. Iron traps are suitable for moderate-pressure steam systems and applications where corrosion resistance is less critical.
Breakup by Distribution Channel:
- Online
- Offline
The report has provided a detailed breakup and analysis of the market based on the distribution channel. This includes online and offline.
The online distribution channel is gaining prominence in the steam trap market due to its convenience and accessibility. Steam traps and related products are increasingly available through online platforms, making it easier for customers to research, compare, and purchase steam traps from the comfort of their offices or facilities. Online distributors offer a wide range of steam trap options, making it convenient for buyers to find the specific products that meet their needs.
While online distribution is rising, the offline distribution channel remains an essential part of the steam trap market. Traditional distribution channels include physical stores, authorized dealers, and industrial suppliers. This channel is especially valuable for people who prefer face-to-face interactions, personalized assistance, and immediate product availability.
Breakup by End-Use Industry:
- Oil and Gas
- Power Generation
- Pharmaceuticals
- Food and Beverages
- Pulp and Paper
- Chemical
- Others
Oil and gas exhibit a clear dominance
The report has provided a detailed breakup and analysis of the market based on the end-use industry. This includes oil and gas, power generation, pharmaceuticals, food and beverages, pulp and paper, chemical, and others. According to the report, oil and gas represented the largest segment as steam traps are vital in this sector for various applications, including maintaining the temperature of equipment, preventing freezing, and ensuring the efficiency of refining processes. The industry relies heavily on durable and high-performance steel steam traps to withstand the harsh conditions associated with oil and gas extraction, refining, and transportation. Steel traps offer corrosion resistance and durability, making them the preferred choice for oil and gas applications, where reliability and safety are paramount.
The power generation industry is another significant segment within the steam trap market. Steam is a primary component in power generation processes, and the efficient operation of steam systems is critical to electricity production. Steam traps are used to remove condensate, ensuring that the quality and pressure of steam are maintained. In this industry, both steel and iron steam traps find applications, with steel traps favored in high-pressure environments and iron traps suitable for lower-pressure systems.
The pharmaceutical industry places a premium on precision and hygiene, making steam traps essential for maintaining controlled temperatures and ensuring product quality. In pharmaceutical manufacturing processes, thermostatic steam traps are often preferred for their ability to provide precise temperature control.
In the food and beverage (F&B) industry, steam traps play a critical role in various processes, such as pasteurization, cooking, and sterilization. The industry relies on steam to ensure food safety and product quality. Steam traps are used to remove condensate and maintain consistent steam temperatures, contributing to efficient and hygienic food production.
The pulp and paper industry uses steam traps extensively in paper production and pulp processing. Steam is used for various purposes, including drying, heating, and cooking. Steam traps are essential to prevent condensate buildup and maintain the quality and efficiency of these processes.
Breakup by Region:
To get more information on the regional analysis of this market Request Sample
- North America
- United States
- Canada
- Asia Pacific
- China
- Japan
- India
- South Korea
- Australia
- Indonesia
- Others
- Europe
- Germany
- France
- United Kingdom
- Italy
- Spain
- Russia
- Others
- Latin America
- Brazil
- Mexico
- Others
- Middle East and Africa
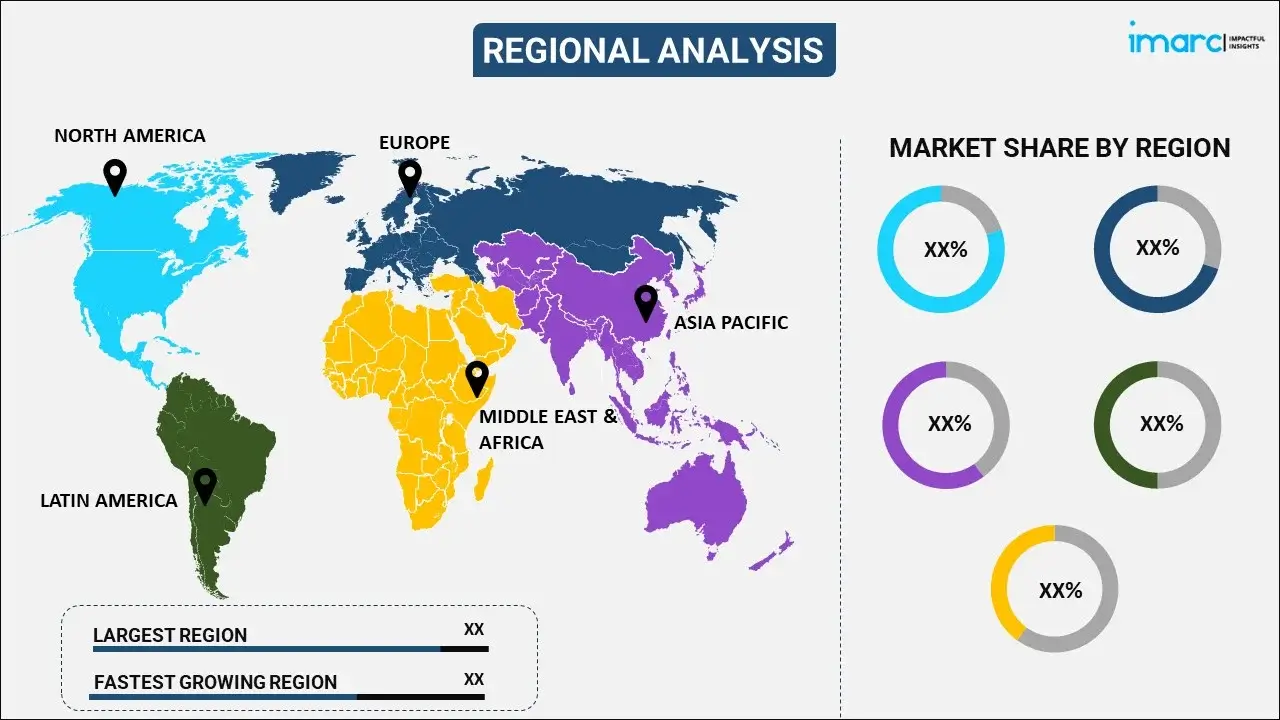
Asia Pacific leads the market, accounting for the largest steam trap market share
The market research report has also provided a comprehensive analysis of all the major regional markets, which include North America (the United States and Canada); Asia Pacific (China, Japan, India, South Korea, Australia, Indonesia, and others); Europe (Germany, France, the United Kingdom, Italy, Spain, Russia, and others); Latin America (Brazil, Mexico, and others); and the Middle East and Africa. According to the report, Asia Pacific accounted for the largest market share due to the increasing demand for steam traps across various industries. The thriving manufacturing sector, coupled with a focus on energy efficiency and sustainability, is driving the adoption of advanced steam trap technologies in the region. Additionally, the expanding infrastructure and investments in power generation is contributing to the market growth in the region.
North America is a mature yet significant segment in the steam trap market. Industrial facilities, including those in the United States and Canada, rely on steam traps for energy efficiency and process optimization. Steam traps play a crucial role in various industries, ranging from manufacturing to food processing, supporting the diverse industrial landscape of the region.
Europe is another prominent segment in the steam trap market, characterized by a strong emphasis on sustainability and energy efficiency. European countries are known for their strict environmental regulations, prompting industries to invest in steam traps for improved energy management. Steam traps are widely used in sectors, such as chemicals, power generation, and pharmaceuticals.
Latin America represents a growing market for steam traps, driven by industrial development and increasing awareness of energy conservation. Countries like Brazil and Mexico have thriving manufacturing sectors, which require efficient steam systems. Steam traps play a vital role in optimizing energy use and reducing operational costs in these industries.
The Middle East and Africa exhibit potential for the steam trap market, primarily due to infrastructure development, oil and gas exploration, and power generation projects in the region. The demand for steam traps is driven by industries seeking to maximize the efficiency of steam systems while adhering to energy conservation goals.
Leading Key Players in the Steam Trap Industry:
Key players in the market are actively engaged in several strategic initiatives to maintain their market leadership and address evolving industry needs. These initiatives include continuous research and development (R&D) activities to enhance the efficiency and durability of steam traps, often incorporating smart technologies for real-time monitoring and predictive maintenance. Additionally, they are expanding their product portfolios to cater to diverse industry applications and end-user requirements. Key players also focus on global market expansion by strengthening their distribution networks and partnerships with industrial suppliers. Furthermore, sustainability is a priority, with efforts to develop eco-friendly steam trap solutions that align with energy conservation and emissions reduction goals.
The market research report has provided a comprehensive analysis of the competitive landscape. Detailed profiles of all major companies have also been provided. Some of the key players in the market include:
- Armstrong International Inc.
- Emerson Electric Co.
- Forbes Marshall Pvt. Ltd.
- Spirax Group plc
- Thermax Ltd. (RDA Holdings Private Limited)
- Velan Inc.
- Watts Water Technologies Inc.
- TLV Co., Ltd.
- Xylem Inc.
- Valsteam ADCA Engineering S.A.
- Miyawaki Inc.
(Please note that this is only a partial list of the key players, and the complete list is provided in the report.)
Latest News:
- January 2022: Spirax-Sarco Engineering completed the acquisition of energy consulting firm Cotopaxi Ltd. This acquisition will help enhance the Steam Specialties business of the company which serves industrial steam consumers as Cotopaxi has digital solutions experience in steam installations.
- December 11, 2023: Watts Water Technologies, Inc. announced that it has entered into a definitive agreement to acquire Josam Company. The addition of Josam’s innovative and specified products to the portfolio of the company will allow it to offer expanded capabilities and solutions to consumers.
Steam Trap Market Report Scope:
| Report Features | Details |
|---|---|
| Base Year of the Analysis | 2025 |
| Historical Period | 2020-2025 |
| Forecast Period | 2026-2034 |
| Units | Billion USD |
| Scope of the Report | Exploration of Historical Trends and Market Outlook, Industry Catalysts and Challenges, Segment-Wise Historical and Future Market Assessment:
|
| Product Types Covered | Thermodynamic, Mechanical, Thermostatic |
| Applications Covered | Instrument Steam Tracing, Line Steam Tracing, Drip Application, Process Application, Others |
| Material Types Covered | Steel, Iron, Others |
| Distribution Channels Covered | Online, Offline |
| End-Use Industries Covered | Oil and Gas, Power Generation, Pharmaceuticals, Food and Beverages, Pulp and Paper, Chemical, Others |
| Regions Covered | Asia Pacific, Europe, North America, Latin America, Middle East and Africa |
| Countries Covered | United States, Canada, Germany, France, United Kingdom, Italy, Spain, Russia, China, Japan, India, South Korea, Australia, Indonesia, Brazil, Mexico |
| Companies Covered | Armstrong International Inc., Emerson Electric Co., Forbes Marshall Pvt. Ltd., Spirax Group plc, Thermax Ltd. (RDA Holdings Private Limited), Velan Inc., Watts Water Technologies Inc., TLV Co., Ltd., Xylem Inc., Valsteam ADCA Engineering S.A., Miyawaki Inc., etc. |
| Customization Scope | 10% Free Customization |
| Post-Sale Analyst Support | 10-12 Weeks |
| Delivery Format | PDF and Excel through Email (We can also provide the editable version of the report in PPT/Word format on special request) |
Key Benefits for Stakeholders:
- IMARC’s industry report offers a comprehensive quantitative analysis of various market segments, historical and current market trends, market forecasts, and dynamics of the steam trap market from 2020-2034.
- The research report provides the latest information on the market drivers, challenges, and opportunities in the global steam trap market.
- The study maps the leading, as well as the fastest-growing, regional markets. It further enables stakeholders to identify the key country-level markets within each region.
- Porter's five forces analysis assists stakeholders in assessing the impact of new entrants, competitive rivalry, supplier power, buyer power, and the threat of substitution. It helps stakeholders to analyze the level of competition within the steam trap industry and its attractiveness.
- The competitive landscape allows stakeholders to understand their competitive environment and provides insight into the current positions of key players in the market.
Frequently Asked Questions About the Steam Trap Market Report
According to the estimates by IMARC Group, the global steam trap market is expected to grow at a CAGR of 3.30% during 2026-2034.
The increasing automation in the oil and gas industry, coupled with the growing number of offshore and onshore exploratory activities, is currently driving the global steam trap market.
Several product innovations have led to the emergence of novel steam traps that are integrated with advanced monitoring systems for minimizing CO2 emissions in the environment, thereby representing one of the key trends in the global steam trap market.
Sudden outbreak of the COVID-19 pandemic had led to the implementation of stringent lockdown regulations across several nations resulting in temporary closure of numerous end-use industries for steam traps, including pulp and paper, food and beverages, chemical, etc., thereby hampering the overall product demand.
On the basis of the application, the market has been classified into instrument steam tracing, line steam tracing, drip application, process application, and others.
On the basis of the material type, the market has been categorized into steel, iron, and others, where steel currently accounts for the majority of the total market share.
On the basis of the end-use industry, the market has been divided into oil & gas, power generation, pharmaceuticals, food & beverages, pulp & paper, chemical, and others. At present, the oil & gas sector exhibits a clear dominance in the market.
Region-wise, the market has been classified into North America, Europe, Asia Pacific, Middle East and Africa, and Latin America, where Asia Pacific dominates the global market.
Need more help?
- Speak to our experienced analysts for insights on the current market scenarios.
- Include additional segments and countries to customize the report as per your requirement.
- Gain an unparalleled competitive advantage in your domain by understanding how to utilize the report and positively impacting your operations and revenue.
- For further assistance, please connect with our analysts.
 Request Customization
 Speak to an Analyst
 Request Brochure
 Inquire Before Buying
Benefits of Customization
- Personalize this research
- Triangulate with your data
- Get data as per your format and definition
- Gain a deeper dive into a specific application, geography, customer, or competitor
- Any level of personalization
Get in Touch With Us
UNITED STATES
Phone: +1-201-971-6302
INDIA
Phone: +91-120-433-0800
UNITED KINGDOM
Phone: +44-753-714-6104
Email: [email protected]
Client Testimonials


.webp)


