
Steel Rebar Prices, Trend, Chart, Demand, Market Analysis, News, Historical and Forecast Data Report 2026 Edition
Steel Rebar Price Trend, Index and Forecast
Track the latest insights on steel rebar price trend and forecast with detailed analysis of regional fluctuations and market dynamics across North America, Latin America, Central Europe, Western Europe, Eastern Europe, Middle East, North Africa, West Africa, Central and Southern Africa, Central Asia, Southeast Asia, South Asia, East Asia, and Oceania.
Steel Rebar Prices Outlook Q1 2026
- USA: USD 1011/MT
- China: USD 480/MT
- Germany: USD 749/MT
- Taiwan: USD 737/MT
- Brazil: USD 907/MT
Steel Rebar Price Chart

Get real-time access to monthly/quarterly/yearly prices Request Sample
During the first quarter of 2026, the steel rebar prices in the USA reached 1011 USD/MT in March. The market experienced a firm upward trend driven by strong demand from the construction and infrastructure sectors. Ongoing project activity supported consistent consumption, while supply conditions remained relatively controlled due to stable domestic production. Import volumes were steady, but did not create excess availability in the market. Buyers maintained regular procurement to meet project requirements, supporting price increases.
During the first quarter of 2026, the steel rebar prices in China reached 480 USD/MT in March. The market recorded a decline influenced by sufficient supply and weakened demand from the construction sector. Domestic production remained steady, contributing to ample availability in the market. At the same time, construction activity showed slower momentum, reducing consumption levels. Export demand provided limited support, as global market conditions remained soft.
During the first quarter of 2026, the steel rebar prices in Germany reached 749 USD/MT in March. The market observed a noticeable decline due to subdued demand from the construction and infrastructure sectors. Supply remained sufficient, supported by steady domestic production and consistent imports. Additionally, stable energy and operational costs did not provide upward momentum, resulting in continued pressure on prices during the quarter.
During the first quarter of 2026, the steel rebar prices in Taiwan reached 737 USD/MT in March. The market experienced a gradual decline influenced by balanced supply and moderated demand from construction activities. Production levels remained steady, ensuring consistent availability of material. Stable raw material and logistics costs provided minimal support, contributing to the overall soft pricing trend throughout the quarter.
During the first quarter of 2026, the steel rebar prices in Brazil reached 907 USD/MT in March. The market recorded an upward movement supported by firm demand from the infrastructure and residential construction sectors. Domestic production remained stable, while supply conditions were relatively balanced. Additionally, rising input and transportation costs contributed to upward pricing pressure, while stable export activity helped maintain market balance during the quarter.
Steel Rebar Prices Outlook Q4 2025
- USA: USD 943/MT
- China: USD 492/MT
- Germany: USD 816/MT
- Taiwan: USD 770/MT
- Brazil: USD 864/MT
During the fourth quarter of 2025, the steel rebar prices in the USA reached 943 USD/MT in December. Prices moved upward as construction activity and infrastructure-related demand remained steady. Additionally, higher input cost pressure and disciplined mill output influenced market conditions, while buyers aligned procurement with ongoing project timelines and near-term fabrication requirements.
During the fourth quarter of 2025, the steel rebar prices in China reached 492 USD/MT in December. Prices edged higher supported by consistent demand from infrastructure development and residential construction. Moreover, production controls and regulated operating rates at steel mills shaped supply availability, encouraging buyers to secure material in line with scheduled construction activity.
During the fourth quarter of 2025, the steel rebar prices in Germany reached 816 USD/MT in December. Prices moved lower as demand from the construction and civil engineering sectors softened. In addition to this, adequate domestic availability and cautious procurement strategies influenced sourcing behavior, with buyers limiting purchases to confirmed project needs.
During the fourth quarter of 2025, the steel rebar prices in Taiwan reached 770 USD/MT in December. Prices moved upward driven by steady consumption from infrastructure and commercial construction projects. Furthermore, controlled production levels and consistent downstream requirements supported procurement activity, while buyers focused on maintaining supply continuity for scheduled builds.
During the fourth quarter of 2025, the steel rebar prices in Brazil reached 864 USD/MT in December. Prices trended upward amid firm demand from construction and public infrastructure projects. Apart from this, supply-side discipline and logistical planning influenced sourcing decisions, prompting buyers to coordinate procurement closely with project execution schedules.
Steel Rebar Prices Outlook Q3 2025
- USA: USD 885/MT
- China: USD 476/MT
- Germany: USD 844/MT
- Taiwan: USD 720/MT
- Brazil: USD 827/MT
During the third quarter of 2025, the steel rebar prices in the USA reached 885 USD/MT in September. The upward price movement was largely supported by steady construction activity across infrastructure and commercial projects, which maintained consistent procurement levels. Domestic mills operated under disciplined supply strategies, limiting excess availability in the market. Higher production expenses related to energy and labor also added upward pressure on pricing.
During the third quarter of 2025, the steel rebar prices in China reached 476 USD/MT in September. Prices increased modestly as construction demand showed gradual improvement, particularly from public infrastructure and urban development projects. Steel producers adjusted output levels to align with consumption trends, which helped prevent inventory accumulation. Raw material availability remained adequate, but cautious procurement strategies limited aggressive cost reductions.
During the third quarter of 2025, the steel rebar prices in Germany reached 844 USD/MT in September. Prices declined as construction activity weakened amid subdued economic conditions. Demand from residential and commercial sectors remained soft, leading distributors to adopt conservative purchasing strategies. Mills faced competitive pressure from regional suppliers, which reduced pricing power. Energy cost stabilization eased production expenses, allowing producers to offer more flexible pricing.
During the third quarter of 2025, the steel rebar prices in Taiwan reached 720 USD/MT in September. The decline in prices was driven by reduced domestic construction demand and slower project execution timelines. Steelmakers maintained stable production levels, which resulted in sufficient material availability in the market. Lower procurement activity from contractors limited price support, prompting sellers to adjust offers to stimulate demand.
During the third quarter of 2025, the steel rebar prices in Brazil reached 827 USD/MT in September. Prices strengthened slightly due to consistent infrastructure spending and a gradual improvement in construction sentiment. Domestic producers managed supply efficiently, preventing oversupply conditions. Transportation and operational costs remained elevated, which supported higher price levels. Import penetration stayed limited, allowing local mills to retain pricing leverage.
Steel Rebar Prices Outlook Q2 2025
- USA: USD 850/MT
- China: USD 468/MT
- Germany: USD 873/MT
- Saudi Arabia: USD 658/MT
- Brazil: USD 815/MT
During the second quarter of 2025, the steel rebar prices in the USA reached 850 USD/MT in June. Prices softened during the quarter as construction demand temporarily slowed due to project scheduling delays. Buyers adopted a wait-and-watch approach, limiting spot market activity. Mills maintained steady output, which resulted in comfortable supply availability. Reduced urgency in procurement allowed distributors to negotiate lower prices.
During the second quarter of 2025, the steel rebar prices in China reached 468 USD/MT in June. Prices declined as domestic construction demand weakened, particularly in the private real estate segment. Steelmakers faced inventory buildup, prompting adjustments in pricing strategies to stimulate sales. Export demand remained moderate but insufficient to fully offset domestic softness. Raw material supply conditions remained stable, limiting cost-driven price increases.
During the second quarter of 2025, the steel rebar prices in Germany reached 873 USD/MT in June. Prices increased due to higher production costs and limited material availability. Energy expenses and compliance-related operational requirements elevated cost structures for producers. Construction demand, while moderate, remained stable enough to support higher price levels. Mills maintained disciplined output, preventing oversupply.
During the second quarter of 2025, the steel rebar prices in Saudi Arabia reached 658 USD/MT in June. Prices declined as construction activity slowed across several private sector projects. Domestic production levels remained sufficient, resulting in comfortable supply conditions. Buyers delayed procurement decisions amid cautious market sentiment. Stable raw material availability reduced cost pressures on manufacturers. Additionally, competitive pricing among regional suppliers limited sellers’ ability to maintain higher prices.
During the second quarter of 2025, the steel rebar prices in Brazil reached 815 USD/MT in June. Prices decreased due to weaker construction demand and slower infrastructure project execution. Mills continued operations at stable rates, leading to an adequate supply in the market. Buyers remained cautious, reducing spot purchases and negotiating lower prices. Transportation and logistics efficiencies improved, easing distribution costs.
Regional Coverage
The report provides a detailed analysis of the market across different regions, each with unique pricing dynamics influenced by localized market conditions, supply chain intricacies, and geopolitical factors. This includes price trends, price forecast and supply and demand trends for each region, along with spot prices by major ports. The report also provides coverage of FOB and CIF prices, as well as the key factors influencing steel rebar prices.
Europe Steel Rebar Price Trend
Q1 2026:
The steel rebar price index in Europe showed a declining trend due to sufficient supply and moderated demand from construction sectors. Production levels remained stable across major producing countries, ensuring consistent material availability throughout the region. Import flows further supported supply levels, preventing any tightening in the market. At the same time, construction activity continued at a steady pace but lacked strong expansion, which limited demand growth. Buyers maintained cautious procurement strategies, focusing on immediate project requirements rather than building large inventories.
Q4 2025:
As per the steel rebar price index, European prices moved lower, reflecting subdued demand from residential and commercial construction activity. Additionally, sufficient regional production capacity and stable inventory levels influenced supply conditions. Buyers adopted cautious procurement strategies, aligning purchases strictly with confirmed project timelines, while cross-border distribution networks ensured uninterrupted material movement for infrastructure and engineering applications.
Q3 2025:
During the third quarter of 2025, the steel rebar price index in Europe reflected a downward trend. Construction activity across several economies remained subdued, limiting demand growth. Steel producers faced competitive pressure from regional suppliers, reducing pricing leverage. Stabilized energy markets eased cost pressures, allowing mills to offer more flexible pricing. Inventory levels across distribution channels remained sufficient, reducing urgency for restocking.
Q2 2025:
The steel rebar price index in Europe recorded an upward trend, driven primarily by elevated production and regulatory compliance costs. Steel manufacturers continued to face strict environmental and operational standards, which increased overall manufacturing expenses and were gradually passed on to buyers. Producers exercised strong supply discipline, keeping output aligned with demand and preventing excess material from entering the market. Construction activity across infrastructure and public sector projects remained steady, providing consistent baseline demand and reinforcing price stability.
This analysis can be extended to include detailed steel rebar price information for a comprehensive list of countries.
| Region | Countries Covered |
|---|---|
| Europe | Germany, France, United Kingdom, Italy, Spain, Russia, Turkey, Netherlands, Poland, Sweden, Belgium, Austria, Ireland, Switzerland, Norway, Denmark, Romania, Finland, Czech Republic, Portugal, and Greece, among other European countries. |
North America Steel Rebar Price Trend
Q1 2026:
The steel rebar price index in North America reflected moderate growth supported by firm demand from infrastructure and construction sectors. Ongoing development projects and steady investment in public infrastructure sustained consistent consumption levels. Domestic production remained stable, ensuring a reliable supply, while import volumes were controlled to prevent oversupply conditions. Buyers maintained steady procurement practices, aligning purchases with project timelines. At the same time, rising raw material and energy costs contributed to upward pricing pressure.
Q4 2025:
As per the steel rebar price index, prices in North America moved upward supported by steady infrastructure spending and ongoing construction activity. Furthermore, controlled mill output and higher input cost considerations shaped supply dynamics. Buyers focused on contract-based sourcing and short-term procurement aligned with fabrication schedules, supported by efficient logistics and established domestic distribution channels.
Q3 2025:
The steel rebar price index in North America showed a bullish trend. Infrastructure development and steady commercial construction supported demand. Producers managed supply carefully, preventing oversupply conditions. Higher operational expenses sustained elevated price levels. Import competition remained controlled, supporting domestic pricing. Buyer confidence improved gradually, leading to consistent order flows. These factors collectively contributed to a stable and supportive pricing environment across the region.
Q2 2025:
The steel rebar price index in North America declined as demand momentum weakened across key construction segments. Slower project execution and delayed procurement decisions reduced purchasing activity, particularly in the private construction sector. Mills maintained steady production rates despite softer demand, resulting in comfortable supply levels throughout the market. Buyers adopted a cautious approach, limiting spot purchases and negotiating more aggressively.
Specific steel rebar historical data within the United States and Canada can also be provided.
| Region | Countries Covered |
|---|---|
| North America | United States and Canada |
Middle East and Africa Steel Rebar Price Trend
Q1 2026:
The study examines the Middle East and Africa's steel rebar trends and price chart, taking into account variables that specifically affect market prices, such as regional industrial expansion, the availability of natural resources, and geopolitical conflicts.
Q4 2025:
As per steel rebar price chart, the prices in the Middle East and Africa fluctuated due to a complex interplay of factors, primarily driven by supply chain disruptions, seasonal demand shifts, and geopolitical influences.
Q3 2025:
The report explores the steel rebar pricing trends and steel rebar price chart in the Middle East and Africa, considering factors like regional industrial growth, the availability of natural resources, and geopolitical tensions that uniquely influence market prices.
Q2 2025:
Steel rebar prices in the Middle East and Africa softened due to a combination of demand-side and supply-side factors. Delays and slower progress in private construction projects reduced material consumption across several markets. Domestic producers were able to meet regional requirements comfortably, ensuring adequate supply availability and limiting price support. Competitive pricing among local and regional suppliers intensified market competition, restricting any upward price movement.
In addition to region-wise data, information on steel rebar prices for countries can also be provided.
| Region | Countries Covered |
|---|---|
| Middle East & Africa | Saudi Arabia, UAE, Israel, Iran, South Africa, Nigeria, Oman, Kuwait, Qatar, Iraq, Egypt, Algeria, and Morocco, among other Middle Eastern and African countries. |
Asia Pacific Steel Rebar Price Trend
Q1 2026:
In the Asia Pacific region, steel rebar prices showed declining trends influenced by sufficient supply and varying demand conditions. Production levels remained stable across major countries, ensuring consistent availability of material. In some markets, weaker construction activity reduced consumption, leading to downward pressure on prices. Export activity provided limited support, as global demand conditions remained uneven. Buyers adopted cautious procurement strategies, aligning purchases with immediate needs.
Q4 2025:
Across Asia Pacific, steel rebar prices moved upward supported by consistent demand from infrastructure expansion and urban development projects. Moreover, disciplined production planning and measured supply availability influenced sourcing strategies. Buyers coordinated procurement with construction timelines, balancing spot purchases and contractual supply to support ongoing development activity.
Q3 2025:
The Asia Pacific steel rebar market experienced mixed pricing trends. Demand varied across countries, with public infrastructure providing support in some markets while private construction remained weak in others. Producers adjusted output levels to align with consumption trends. Export activity influenced pricing dynamics, particularly in markets with surplus production. Stable raw material availability limited cost-driven price fluctuations. These factors resulted in uneven but generally restrained price movements across the region.
Q2 2025:
The Asia Pacific steel rebar market faced downward price pressure, largely due to weak private sector construction activity. Reduced investment in residential and commercial projects weighed heavily on demand across several countries. Producers encountered inventory accumulation as sales volumes slowed, prompting price adjustments to stimulate buying interest. Export demand offered limited relief, as international markets remained competitive and price-sensitive. Input costs, including raw materials and energy, remained stable, preventing sharp cost-induced price changes. However, the absence of strong demand drivers kept market sentiment cautious.
This steel rebar price analysis can be expanded to include a comprehensive list of countries within the region.
| Region | Countries Covered |
|---|---|
| Asia Pacific | China, India, Indonesia, Pakistan, Bangladesh, Japan, Philippines, Vietnam, Thailand, South Korea, Malaysia, Nepal, Taiwan, Sri Lanka, Hongkong, Singapore, Australia, and New Zealand, among other Asian countries. |
Latin America Steel Rebar Price Trend
Q1 2026:
In Latin America, steel rebar prices experienced moderate growth driven by steady demand from infrastructure and residential construction sectors. Ongoing development projects supported consistent consumption, while domestic production remained stable. Supply conditions were balanced, with imports supplementing local availability where required. Buyers maintained consistent procurement patterns, supporting steady market activity.
Q4 2025:
Regional market assessments across Latin America indicated that steel rebar prices moved upward amid steady demand from public works and private construction projects. Additionally, procurement planning was influenced by transportation coordination and project-based consumption patterns. Buyers focused on aligning sourcing with execution schedules, while inventory strategies emphasized maintaining continuity across active construction sites.
Q3 2025:
Steel rebar prices in Latin America showed mild upward movement. Infrastructure investment and seasonal construction activity supported demand. Producers managed supply efficiently, preventing oversupply. Transportation and operational costs remained elevated, sustaining price levels. Import competition was limited in several markets, allowing domestic mills to maintain pricing strength. Overall, regional prices remained supported by steady downstream demand.
Q2 2025:
Steel rebar prices in Latin America declined amid slowing construction activity and reduced consumption. Infrastructure and private sector projects progressed at a slower pace, dampening demand across key markets. Steel mills continued operating at stable production levels, leading to sufficient material availability and increased competition among suppliers. Buyers delayed procurement decisions, anticipating better pricing opportunities, which further intensified downward pressure.
This comprehensive review can be extended to include specific countries within the region.
| Region | Countries Covered |
|---|---|
| Latin America | Brazil, Mexico, Argentina, Columbia, Chile, Ecuador, and Peru, among other Latin American countries. |
Steel Rebar Pricing Report, Market Analysis, and News
IMARC's latest publication, “Steel Rebar Prices, Trend, Chart, Demand, Market Analysis, News, Historical and Forecast Data Report 2026 Edition,” presents a detailed examination of the steel rebar market, providing insights into both global and regional trends that are shaping prices. This report delves into the spot price of steel rebar at major ports and analyzes the composition of prices, including FOB and CIF terms. It also presents detailed steel rebar prices trend analysis by region, covering North America, Europe, Asia Pacific, Latin America, and Middle East and Africa. The factors affecting steel rebar pricing, such as the dynamics of supply and demand, geopolitical influences, and sector specific developments, are thoroughly explored. This comprehensive report helps stakeholders stay informed with the latest market news, regulatory updates, and technological progress, facilitating informed strategic decision-making and forecasting.

Steel Rebar Industry Analysis
The global steel rebar market size reached USD 272.5 Billion in 2025. By 2034, IMARC Group expects the market to reach USD 429.1 Billion, at a projected CAGR of 5.17% during 2026-2034. The market is primarily driven by consistent household consumption, expanding food processing demand, and the need for reliable supply chains and storage infrastructure.
Latest News and Developments:
- September 2025: Kalika Steel, a TMT steel bars manufacturer, concluded the third edition of its flagship KREATE 2025 initiative in Jalna, celebrating innovation and sustainability among architecture and engineering students. The competition recognizes creative designs incorporating TMT steel rebars, highlighting resilience and responsible construction.
- October 2024: Shyam Metalics and Energy announced the production of stainless steel rebars to strengthen coastal infrastructure under the ‘Make in India’ initiative. These rebars offer up to ten times more corrosion resistance than conventional TMT bars, reducing maintenance costs and extending infrastructure lifespan.
Product Description
Steel rebar, or reinforcing bar, is a carbon steel product used to reinforce concrete structures. It is typically composed of iron with controlled carbon and alloy content to provide high tensile strength and ductility. The surface of steel rebar is ribbed or deformed to enhance bonding with concrete, improving structural integrity. Steel rebar is widely used in residential buildings, commercial structures, bridges, roads, and industrial foundations. It offers durability, load-bearing capacity, and resistance to stress under various environmental conditions. Due to its recyclability and strength, steel rebar remains a critical material in modern construction and infrastructure development worldwide.
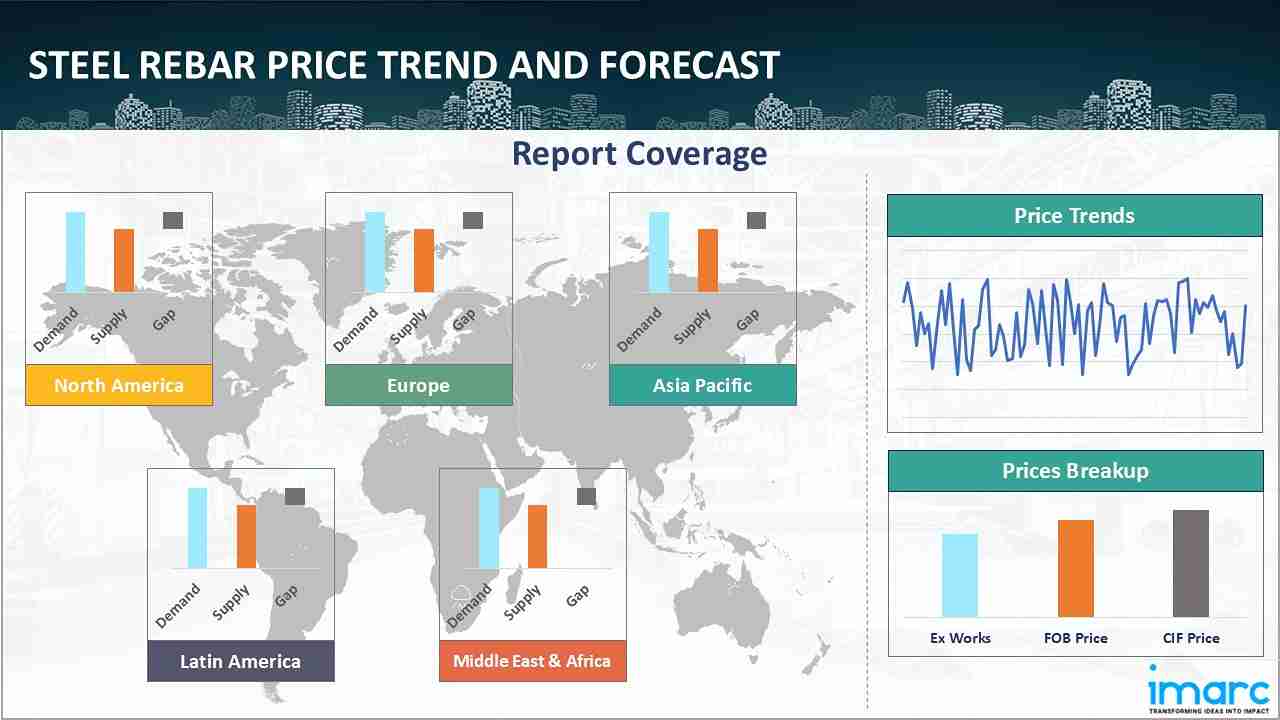
Report Coverage
| Key Attributes | Details |
|---|---|
| Product Name | Steel Rebar |
| Report Features | Exploration of Historical Trends and Market Outlook, Industry Demand, Industry Supply, Gap Analysis, Challenges, Steel Rebar Price Analysis, and Segment-Wise Assessment. |
| Currency/Units | US$ (Data can also be provided in local currency) or Metric Tons |
| Region/Countries Covered | The current coverage includes analysis at the global and regional levels only. Based on your requirements, we can also customize the report and provide specific information for the following countries: Asia Pacific: China, India, Indonesia, Pakistan, Bangladesh, Japan, Philippines, Vietnam, Thailand, South Korea, Malaysia, Nepal, Taiwan, Sri Lanka, Hongkong, Singapore, Australia, and New Zealand Europe: Germany, France, United Kingdom, Italy, Spain, Russia, Turkey, Netherlands, Poland, Sweden, Belgium, Austria, Ireland, Switzerland, Norway, Denmark, Romania, Finland, Czech Republic, Portugal and Greece North America: United States and Canada Latin America: Brazil, Mexico, Argentina, Columbia, Chile, Ecuador, and Peru Middle East & Africa: Saudi Arabia, UAE, Israel, Iran, South Africa, Nigeria, Oman, Kuwait, Qatar, Iraq, Egypt, Algeria, and Morocco The list of countries presented is not exhaustive. Information on additional countries can be provided if required by the client. |
| Information Covered for Key Suppliers |
|
| Customization Scope | The report can be customized as per the requirements of the customer |
| Report Price and Purchase Option |
Plan A: Monthly Updates - Annual Subscription
Plan B: Quarterly Updates - Annual Subscription
Plan C: Biannually Updates - Annual Subscription
|
| Post-Sale Analyst Support | 360-degree analyst support after report delivery |
| Delivery Format | PDF and Excel through email (We can also provide the editable version of the report in PPT/Word format on special request) |
Key Benefits for Stakeholders:
- IMARC’s report presents a detailed analysis of steel rebar pricing, covering global and regional trends, spot prices at key ports, and a breakdown of ex-works, FOB, and CIF prices.
- The study examines factors affecting steel rebar price trend, including supply-demand shifts and geopolitical impacts, offering insights for informed decision-making.
- The competitive landscape review equips stakeholders with crucial insights into the latest market news, regulatory changes, and technological advancements, ensuring a well-rounded, strategic overview for forecasting and planning.
- IMARC offers various subscription options, including monthly, quarterly, and biannual updates, allowing clients to stay informed with the latest market trends, ongoing developments, and comprehensive market insights. The steel rebar price charts ensure our clients remain at the forefront of the industry.
Need more help?
- Speak to our experienced analysts for insights on the current market scenarios.
- Include additional segments and countries to customize the report as per your requirement.
- Gain an unparalleled competitive advantage in your domain by understanding how to utilize the report and positively impacting your operations and revenue.
- For further assistance, please connect with our analysts.
 Request Customization
 Inquire Before Buying
 Speak to an Analyst
 Request Brochure
Benefits of Customization
- Personalize this research
- Triangulate with your data
- Get data as per your format and definition
- Gain a deeper dive into a specific application, geography, customer, or competitor
- Any level of personalization
Get in Touch With Us
UNITED STATES
Phone: +1-201-971-6302
INDIA
Phone: +91-120-433-0800
UNITED KINGDOM
Phone: +44-753-714-6104
Email: [email protected]
Client Testimonials


.webp)


Related Reports
Why Choose Us
IMARC offers trustworthy, data-centric insights into commodity pricing and evolving market trends, enabling businesses to make well-informed decisions in areas such as procurement, strategic planning, and investments. With in-depth knowledge spanning more than 1000 commodities and a vast global presence in over 150 countries, we provide tailored, actionable intelligence designed to meet the specific needs of diverse industries and markets.
1000
+Commodities
150
+Countries Covered
3000
+Clients
20
+Industry
Robust Methodologies & Extensive Resources
IMARC delivers precise commodity pricing insights using proven methodologies and a wealth of data to support strategic decision-making.
Subscription-Based Databases
Our extensive databases provide detailed commodity pricing, import-export trade statistics, and shipment-level tracking for comprehensive market analysis.
Primary Research-Driven Insights
Through direct supplier surveys and expert interviews, we gather real-time market data to enhance pricing accuracy and trend forecasting.
Extensive Secondary Research
We analyze industry reports, trade publications, and market studies to offer tailored intelligence and actionable commodity market insights.
Trusted by 3000+ industry leaders worldwide to drive data-backed decisions. From global manufacturers to government agencies, our clients rely on us for accurate pricing, deep market intelligence, and forward-looking insights.