
Sugar Prices, Trend, Chart, Demand, Market Analysis, News, Historical and Forecast Data Report 2026 Edition
Sugar Price Trend, Index and Forecast
Track real-time and historical sugar prices across global regions. Updated monthly with market insights, drivers, and forecasts.
Sugar Prices June 2026
| Region | Price (USD/KG) | Latest Movement |
|---|---|---|
| Europe | 0.39 | -4.9% ↓ Down |
| North America | 0.75 | -7.4% ↓ Down |
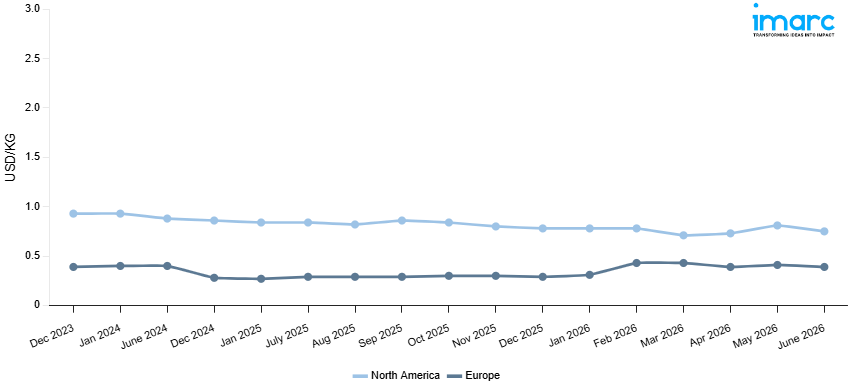
Sugar Price Index (USD/KG):
The chart below highlights monthly sugar prices across different regions.
Get Access to Monthly/Quarterly/Yearly Prices, Request Sample
Market Overview Q1 Ending March 2026
Europe: The sugar prices in Europe reached 0.43 USD/KG in March 2026. The upward pricing movement registered between December and March 2026 was 48.3%. The large price increase was largely fueled by supply conditions that were significantly tightened, owing to decreased harvest yields for sugar beets, due to unfavorable weather conditions and unfavorable cultivation conditions in key cultivation regions, thus critically affecting refined sugar supplies. High demand from the confectionery, beverage, and food processing industries also fueled procurement demand, thereby increasing competition for procurement despite limited spot market volumes. Increasing costs for beet processing and refining also heightened production costs for regional manufacturers. Furthermore, rising demand from the bakery and pharmaceutical excipient industries sustained strong fundamentals for refined sugar, while decreasing import supplies, owing to strong international benchmark valuations and high freight rates, also limited buyers' procurement options.
North America: The sugar prices in North America reached 0.71 USD/KG in March 2026. The downward pricing movement registered between December and March 2026 was 9.0%. The notable decrease in prices was largely explained by the weakening of demand from the confectionery, beverages, and food processing industries, because of changes in consumer behavior, with a shift in preference to alternatives with lower or no sugar content. The rise in the domestic supply of sugar beets and sugarcane put upward pressure on the supply of refined sugar, thereby influencing prices. The decrease in processing and refining costs contributed to lower cost benchmarks for sugar processing and refining. The rise in the amount of sugar available for imports, driven by the competitive prices of cargo under existing quota agreements, contributed to price pressure.
Market Overview Q3 Ending September 2025
Europe: In Europe, sugar prices declined slightly as stable supply levels outpaced moderate demand from food and beverage producers. Favorable weather conditions supported consistent beet harvests, ensuring steady availability for refiners. Additionally, subdued energy costs contributed to manageable production expenses. The sugar price index reflected weaker momentum as imports remained competitive, while limited restocking activity by distributors further reduced upward price pressures. Market sentiment was shaped by cautious buying patterns, with producers adjusting output in response to restrained downstream demand.
North America: In North America, sugar prices rose on account of stronger seasonal consumption and rising procurement from food processing industries. Tight domestic inventories, compounded by slower imports from key suppliers, created upward pricing pressure. The sugar price index showed gains as robust demand from confectionery and beverage manufacturers coincided with logistical bottlenecks in distribution networks. Higher input costs, including energy and transportation, added to bullish momentum in regional markets. Buyers accelerated forward contracts to secure supply, reinforcing the firm price trend observed this quarter.
Sugar Price Trend, Market Analysis, and News
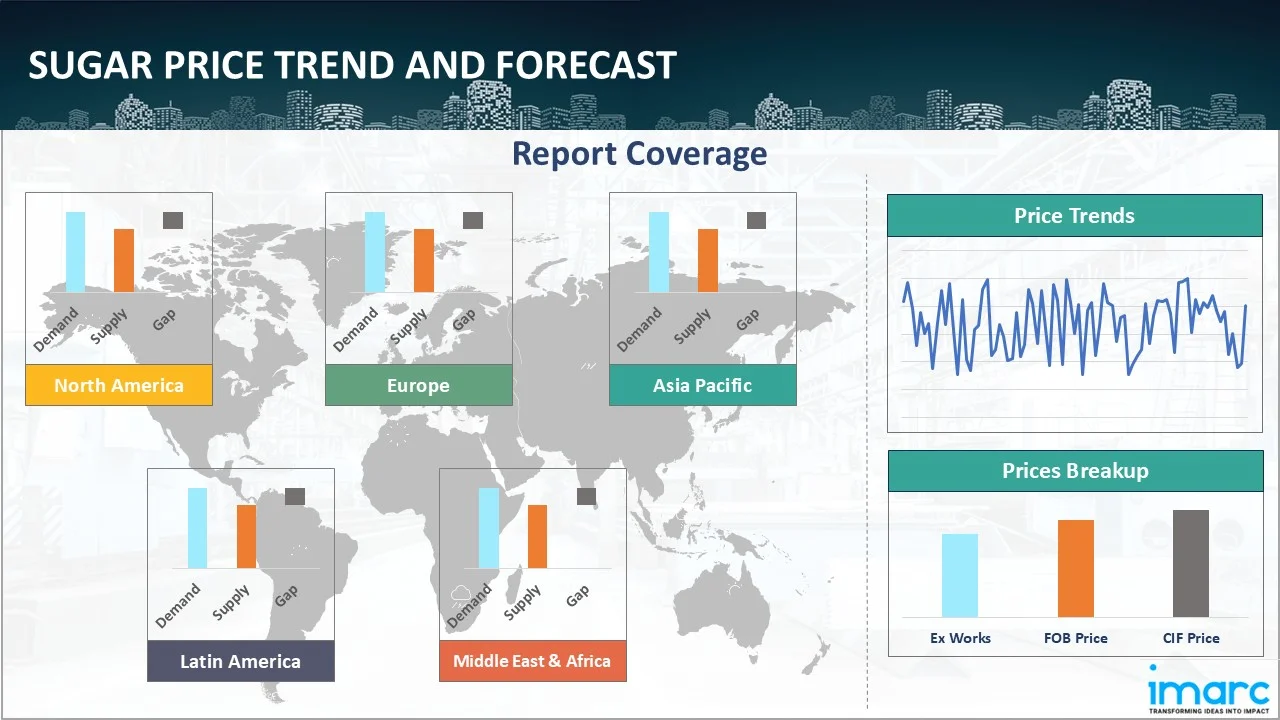
IMARC's latest publication, “Sugar Prices, Trend, Chart, Demand, Market Analysis, News, Historical and Forecast Data Report 2026 Edition,” presents a detailed examination of the sugar market, providing insights into both global and regional trends that are shaping prices. This report delves into the spot price of sugar at major ports and analyzes the composition of prices, including FOB and CIF terms. It also presents detailed sugar price trend analysis by region, covering North America, Europe, Asia Pacific, Latin America, and Middle East and Africa. The factors affecting sugar pricing, such as the dynamics of supply and demand, geopolitical influences, and sector-specific developments, are thoroughly explored. This comprehensive report helps stakeholders stay informed with the latest market news, regulatory updates, and technological progress, facilitating informed strategic decision-making and forecasting.
Sugar Industry Analysis
The global sugar industry size reached 71.3 Million Tons in 2025. By 2034, IMARC Group expects the market to reach 93.5 Million Tons, at a projected CAGR of 2.97% during 2026-2034. The market is driven by the expanding demand from the food and beverage sector, increasing consumption in emerging economies, diversification of sugarcane use into biofuels and ethanol, and technological advancements in refining that enhance production efficiency.
Latest developments in the Sugar industry:
- May 2025: Part of Illovo Sugar Africa Group, Ubombo Sugar unveiled an investment plan to significantly expand its production capacity and energy generation. The company announced its goal to become the second-largest standalone sugar factory in Africa by 2033.
- January 2024: Verax Commodities LLC, a sugar firm founded by former ED&F Man Holdings Ltd. traders, agreed to acquire the operations of Chicago-based Pullman Sugar LLC. This acquisition marked Verax's entry into the North American sweetener market.
Product Description
Sugar is a crystalline carbohydrate primarily derived from sugarcane and sugar beet. It appears as white or brown granules depending on processing and is classified as a key food ingredient globally. As one of the most widely consumed commodities, sugar holds critical importance in the global food supply chain. Its defining attributes include high sweetness, solubility, and preservative qualities, which make it indispensable in food manufacturing. Industrial applications of sugar span confectionery, bakery, soft drinks, and processed foods, where it enhances taste, texture, and shelf life. Beyond foods, sugar is also used in pharmaceuticals, fermentation processes, and ethanol production, underscoring its multifaceted industrial significance.
Report Coverage
| Key Attributes | Details |
|---|---|
| Product Name | Sugar |
| Report Features | Exploration of Historical Trends and Market Outlook, Industry Demand, Industry Supply, Gap Analysis, Challenges, Sugar Price Analysis, and Segment-Wise Assessment. |
| Currency/Units | US$ (Data can also be provided in local currency) or Metric Tons |
| Region/Countries Covered | The current coverage includes analysis at the global and regional levels only. Based on your requirements, we can also customize the report and provide specific information for the following countries: Asia Pacific: China, India, Indonesia, Pakistan, Bangladesh, Japan, Philippines, Vietnam, Thailand, South Korea, Malaysia, Nepal, Taiwan, Sri Lanka, Hongkong, Singapore, Australia, and New Zealand Europe: Germany, France, United Kingdom, Italy, Spain, Russia, Turkey, Netherlands, Poland, Sweden, Belgium, Austria, Ireland, Switzerland, Norway, Denmark, Romania, Finland, Czech Republic, Portugal and Greece North America: United States and Canada Latin America: Brazil, Mexico, Argentina, Columbia, Chile, Ecuador, and Peru Middle East & Africa: Saudi Arabia, UAE, Israel, Iran, South Africa, Nigeria, Oman, Kuwait, Qatar, Iraq, Egypt, Algeria, and Morocco The list of countries presented is not exhaustive. Information on additional countries can be provided if required by the client. |
| Information Covered for Key Suppliers |
|
| Customization Scope | The report can be customized as per the requirements of the customer |
| Report Price and Purchase Option |
Plan A: Monthly Updates - Annual Subscription
Plan B: Quarterly Updates - Annual Subscription
Plan C: Biannually Updates - Annual Subscription
|
| Post-Sale Analyst Support | 360-degree analyst support after report delivery |
| Delivery Format | PDF and Excel through email (We can also provide the editable version of the report in PPT/Word format on special request) |
Key Benefits for Stakeholders:
- IMARC’s report presents a detailed analysis of sugar pricing, covering global and regional trends, spot prices at key ports, and a breakdown of FOB and CIF prices.
- The study examines factors affecting sugar price trend, including input costs, supply-demand shifts, and geopolitical impacts, offering insights for informed decision-making.
- The competitive landscape review equips stakeholders with crucial insights into the latest market news, regulatory changes, and technological advancements, ensuring a well-rounded, strategic overview for forecasting and planning.
- IMARC offers various subscription options, including monthly, quarterly, and biannual updates, allowing clients to stay informed with the latest market trends, ongoing developments, and comprehensive market insights. The sugar price charts ensure our clients remain at the forefront of the industry.
Frequently Asked Questions About the Sugar Price Trend Report
The sugar prices in June 2026 were 0.39 USD/Kg in Europe and 0.75 USD/Kg in North America.
The sugar pricing data is updated on a monthly basis.
We provide the pricing data primarily in the form of an Excel sheet and a PDF.
Yes, our report includes a forecast for sugar prices.
The regions covered include North America, Europe, Asia Pacific, Middle East, and Latin America. Countries can be customized based on the request (additional charges may be applicable).
Yes, we provide both FOB and CIF prices in our report.
Need more help?
- Speak to our experienced analysts for insights on the current market scenarios.
- Include additional segments and countries to customize the report as per your requirement.
- Gain an unparalleled competitive advantage in your domain by understanding how to utilize the report and positively impacting your operations and revenue.
- For further assistance, please connect with our analysts.
 Request Customization
 Inquire Before Buying
 Speak to an Analyst
 Request Brochure
Benefits of Customization
- Personalize this research
- Triangulate with your data
- Get data as per your format and definition
- Gain a deeper dive into a specific application, geography, customer, or competitor
- Any level of personalization
Get in Touch With Us
UNITED STATES
Phone: +1-201-971-6302
INDIA
Phone: +91-120-433-0800
UNITED KINGDOM
Phone: +44-753-714-6104
Email: [email protected]
Client Testimonials


.webp)


Why Choose Us
IMARC offers trustworthy, data-centric insights into commodity pricing and evolving market trends, enabling businesses to make well-informed decisions in areas such as procurement, strategic planning, and investments. With in-depth knowledge spanning more than 1000 commodities and a vast global presence in over 150 countries, we provide tailored, actionable intelligence designed to meet the specific needs of diverse industries and markets.
1000
+Commodities
150
+Countries Covered
3000
+Clients
20
+Industry
Robust Methodologies & Extensive Resources
IMARC delivers precise commodity pricing insights using proven methodologies and a wealth of data to support strategic decision-making.
Subscription-Based Databases
Our extensive databases provide detailed commodity pricing, import-export trade statistics, and shipment-level tracking for comprehensive market analysis.
Primary Research-Driven Insights
Through direct supplier surveys and expert interviews, we gather real-time market data to enhance pricing accuracy and trend forecasting.
Extensive Secondary Research
We analyze industry reports, trade publications, and market studies to offer tailored intelligence and actionable commodity market insights.
Trusted by 3000+ industry leaders worldwide to drive data-backed decisions. From global manufacturers to government agencies, our clients rely on us for accurate pricing, deep market intelligence, and forward-looking insights.