
Switchgear Market Report by Voltage Type (Low-Voltage, Medium-Voltage, High-Voltage), Insulation (Gas Insulated Switchgear (GIS), Air Insulated Switchgear (AIS), and Others), Installation (Indoor, Outdoor), End Use (Commercial, Residential, Industrial), and Region 2026-2034
Switchgear Market:
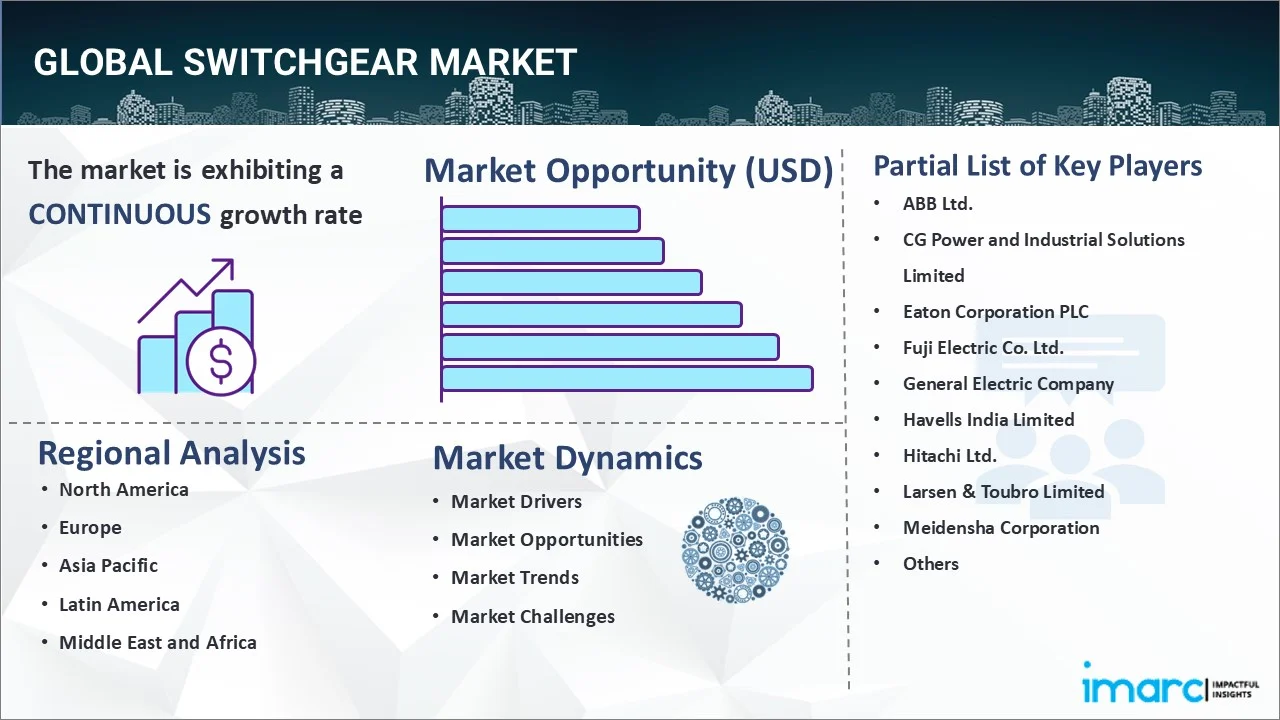
The global switchgear market size reached USD 122.1 Billion in 2025. Looking forward, IMARC Group expects the market to reach USD 179.3 Billion by 2034, exhibiting a growth rate (CAGR) of 4.23% during 2026-2034. The market is primarily driven by the emerging trend of urbanization and industrialization, the inflating investments in renewable energy projects, the launch of favorable policies by the government bodies to promote grid modernization and rural electrification, the continuous technological advancements, and the rising energy efficiency needs.
|
Report Attribute
|
Key Statistics |
|---|---|
|
Base Year
|
2025
|
|
Forecast Years
|
2026-2034
|
|
Historical Years
|
2020-2025
|
|
Market Size in 2025
|
USD 122.1 Billion |
|
Market Forecast in 2034
|
USD 179.3 Billion |
| Market Growth Rate (2026-2034) | 4.23% |
Switchgear Market Analysis:
- Major Market Drivers: The shifting consumer preferences towards renewable energy sources, such as solar and wind power, are propelling the switchgear market outlook. Besides this, the integration of digital monitoring, automation capabilities, and communication into smart switchgears to improve grid efficiency, resilience, and reliability is acting as another significant growth-inducing factor.
- Key Market Trends: The escalating demand for modular and compact switchgear designs that offer scalability, flexibility, and space-saving benefits is positively influencing the market growth. Moreover, the growing popularity of Internet of Things (IoT) for predictive maintenance, remote monitoring, and condition-based asset management is also catalyzing the switchgear market growth.
- Competitive Landscape: Some of the major market players in the switchgear industry include ABB Ltd., CG Power and Industrial Solutions Limited, Eaton Corporation PLC, Fuji Electric Co. Ltd., General Electric Company, Havells India Limited, Hitachi Ltd., Larsen & Toubro Limited, Meidensha Corporation, Mitsubishi Electric Corporation, Powell Industries Inc., Schneider Electric SE, Siemens AG, Toshiba Corporation, among many others.
- Geographical Trends: Asia Pacific accounted for the largest share in the switchgear market analysis, owing to the emerging trend of urbanization and industrialization, the rising infrastructure development, and the elevating requirement for efficient power distribution systems. Besides this, the increasing number of renewable energy projects and the escalating demand for reliable power solutions are stimulating the switchgear market opportunities in the region.
- Challenges and Opportunities: The extensive utilization of sulfur hexafluoride (SF6) as an insulating medium in switchgears poses various challenges for the leading manufacturers, as this gas is highly potent which can cause global warming. However, the rising transition towards renewable energy sources aids in managing power fluctuations and grid stability, which is presenting significant growth opportunities for the switchgear market players.
To get more information on this market Request Sample
Switchgear Market Trends:
Rapid Urbanization and Industrialization
The rapid urbanization and industrialization, especially across developing countries, is bolstering the market growth. Moreover, the escalating demand for reliable and efficient electrical distribution systems in developing countries is acting as another significant growth-inducing factor. For instance, according to the World Bank, Vietnam's urban population (% of the total population) was reported at 38.05%. Metropolitan areas and cities housed 57.29% of Indonesia's total population. Additionally, the elevating requirement for efficient power equipment to ensure smooth operation of residential utilities and several industrial processes is also catalyzing the switchgear market outlook. For example, according to the United Nations, 55.0% of the world’s population resides in urban areas, and this number is projected to increase to 68.0% by 2050. The rate of urbanization is higher in developing countries, where urban population is expected to double by 2050.
Investments in Renewable Energy Projects
The inflating investments in renewable energy projects by the leading players, owing to the rising consumer focus on sustainability, are stimulating the market growth. Besides this, the switchgear market overview indicated that the extensive utilization of advanced switchgear systems in wind and solar farms to regulate, control, and distribute the generated power effectively is positively influencing the switchgear market demand. For instance, Infratil committed US$ 233 Million (EUR 197 Million) to establish Gurn Energy, a renewable energy development platform to develop projects across Asia. Headquartered in Singapore, Gurn Energy aims to invest in developing wind and solar photovoltaic energy projects and storage solutions in Southeast Asia, North Asia, and India. It is already progressing with an initial pipeline of projects of 500 MW at various stages of development in the Philippines, Vietnam, Thailand, Indonesia, and Japan.
Government Initiatives for Grid Modernization and Rural Electrification
The continuous advancements in grid modernization projects to enhance grid resilience, reliability, and efficiency are primarily driving the switchgear market industry. Moreover, the launch of favorable policies by the government bodies to promote rural electrification for extending the power grids to remote areas is also catalyzing the global market. For instance, the United States Department of the Interior and the Bureau of Land Management (BLM) announced the approval of three power transmission projects which will carry renewable energy across the Western part of the country. The project includes building a reliable electric grid that will provide around 10,000MW of electricity in the area and help the country achieve a 100% clean electricity grid by 2035. Furthermore, the Canadian government has also disclosed plans to establish new power transmission networks in the country, as they targeted building a net zero electricity system by 2035 and achieving a net zero economy by 2050.
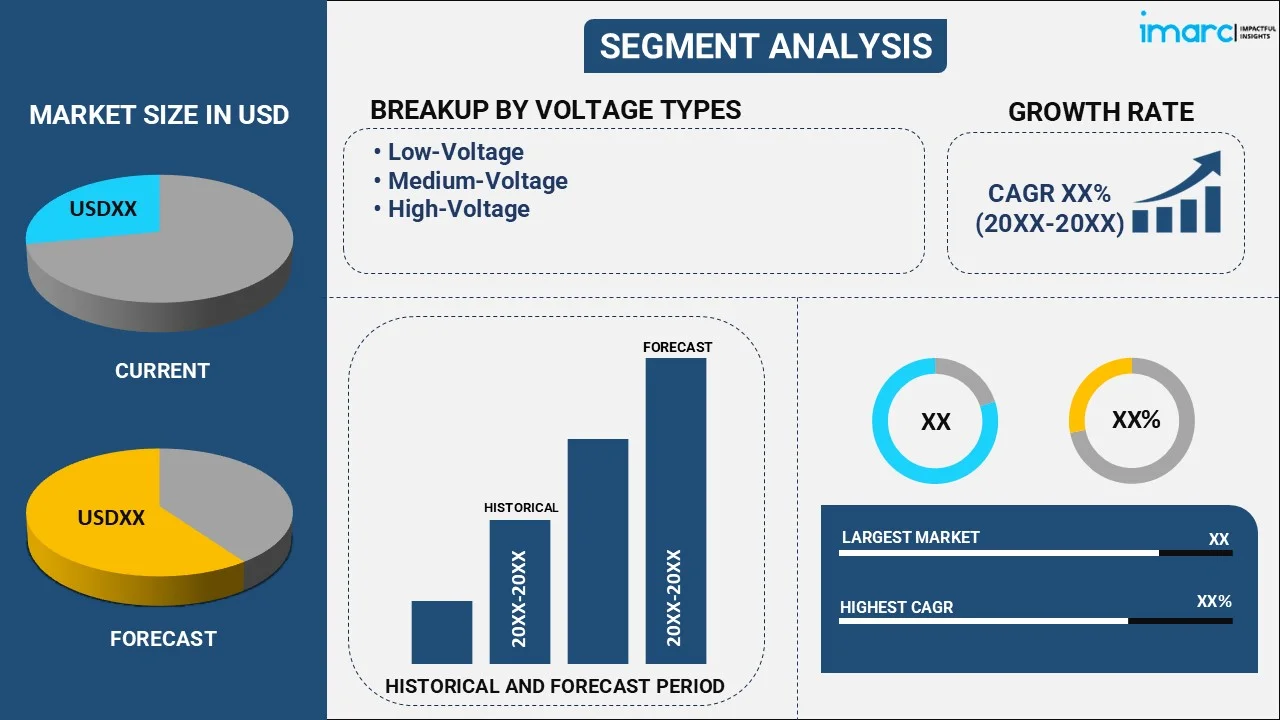
Switchgear Market Segmentation:
IMARC Group provides an analysis of the key trends in each segment of the market, along with forecasts at the global, regional, country levels for 2026-2034. Our report has categorized the market based on voltage type, insulation, installation, and end use.
Breakup by Voltage Type:
To get detailed segment analysis of this market Request Sample
- Low-Voltage
- Medium-Voltage
- High-Voltage
The report has provided a detailed breakup and analysis of the market based on the voltage type. This includes low-voltage, medium-voltage, and high-voltage. According to the report, medium-voltage represented the largest segment. They are widely used in industrial, commercial, and utility sectors, owing to their effective control and protection mechanisms. For instance, Schneider Electric launched a complete preview of its latest sustainable, digital, AirSeT medium-voltage (MV) switchgear ranges. The company aims to build a complete SF6-free Medium Voltage portfolio and meet the requirements of different geographies and end markets with sustainable MV switchgear. Furthermore, ABB unveiled its new factory in Vietnam to increase the production of medium-voltage switchgear. The manufacturing hub will produce 2,000 panels of ABB's UniGear Medium Voltage Switchgear and 700 units of plug-and-play modular power distribution systems each year on production lines planned and built using the proven lean manufacturing principles used in the company's European facilities.
Breakup by Insulation:
- Gas Insulated Switchgear (GIS)
- Air Insulated Switchgear (AIS)
- Others
The report has provided a detailed breakup and analysis of the market based on insulation. This includes gas insulated switchgear (GIS) and air insulated switchgear (AIS) and others. According to the report, gas insulated switchgear (GIS) accounted for the largest market segment. GIS is widely used in limited space areas, as it can occupy 10% of the space required by an AIS. Moreover, GIS offers excellent performance in terms of operational efficiency and power handling capacity. For instance, ONxpress Transportation Partners has agreed with Infrastructure Ontario (IO) and Metrolinx for the GO Expansion On-Corridor Works Project in Toronto, Canada. The On-Corridor Works Project, part of the GO Expansion program, is expected to improve collective mobility in the Greater Toronto and Hamilton Area (GTHA). The contract covers infrastructure upgrades, including 205km of new track and 687km of rail network electrification. It also comprises significant developments to platforms and tracks at the Union Station, construction of new maintenance and storage facilities, and installation of train control and signaling systems.
Breakup by Installation:
- Indoor
- Outdoor
The report has provided a detailed breakup and analysis of the market based on installation. This includes indoor and outdoor. According to the report, outdoor accounted for the largest market share. The extensive utilization of outdoor units in transmission lines and distribution substations is propelling the market growth in this segment. Additionally, outdoor switchgears are designed to withstand severe environmental conditions, enhancing their durability and reducing the need for comprehensive housing structures, which is also catalyzing the market growth. For instance, the U.S. Department of Energy (DOE) has opened the application period for States, Tribal nations, and territories to apply for the US$ 2.3 Billion formula grant program designed to strengthen and modernize America's power grid against extreme weather, wildfires, and other natural disasters exacerbated by the climate crisis.
Breakup by End Use:
- Commercial
- Residential
- Industrial
The report has provided a detailed breakup and analysis of the market based on the end use. This includes commercial, residential, and industrial. According to the report, the industrial segment accounted for the largest market share. The escalating demand for switchgears in industries, such as manufacturing, oil and gas, mining, and power generation to ensure the efficient and uninterrupted operation of heavy equipment and machinery is propelling the market growth in this segment. For instance, the Australian Energy Market Operator (AEMO) has introduced a 30-year roadmap to ramp up the transition to renewables with investments in the National Energy Market (NEM) in its Integrated System Plan (ISP). The step change scenario forecasts annual electricity consumption from the grid doubling by 2050 as transport, cooking, heating, and industrial processes are electrified, and 60% of current coal generation will exit by 2030. Moreover, Schneider Electric has expanded its SF-6-free green and digital MV switchgear portfolio with GM AirSeT. The new GM AirSeT is the green and digital primary GIS technology for electrical networks and demanding applications in industrial buildings and critical infrastructure.
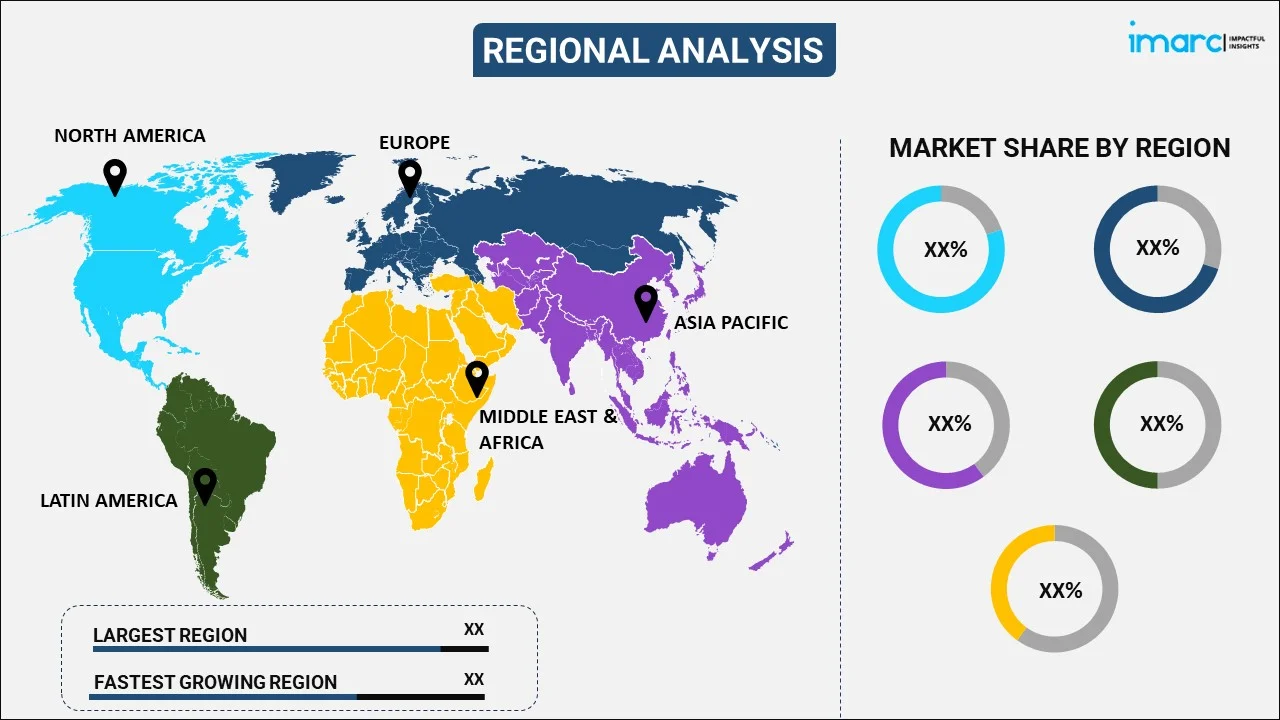
Breakup by Region:
To get more information on the regional analysis of this market Request Sample
- North America
- United States
- Canada
- Asia-Pacific
- China
- Japan
- India
- South Korea
- Australia
- Indonesia
- Others
- Europe
- Germany
- France
- United Kingdom
- Italy
- Spain
- Russia
- Others
- Latin America
- Brazil
- Mexico
- Others
- Middle East and Africa
The report has also provided a comprehensive analysis of all the major regional markets, which include North America (the United States and Canada); Europe (Germany, France, the United Kingdom, Italy, Spain, Russia, and others); Asia Pacific (China, Japan, India, South Korea, Australia, Indonesia, and others); Latin America (Brazil, Mexico, and others); and the Middle East and Africa. According to the report, Asia Pacific accounted for the largest market share, owing to the increasing urbanization and industrialization activities and the development of efficient and reliable power distribution systems. Moreover, the introduction of innovative programs and initiatives to extend and upgrade power networks is also propelling the regional market. For instance, the government of India has approved the Green Energy Corridor (GEC) Phase-II. It is expected to facilitate grid integration and power evacuation of approximately 20 GW of renewable energy (RE) power projects in seven states: Gujarat, Himachal Pradesh, Karnataka, Kerala, Rajasthan, Tamil Nadu, and Uttar Pradesh. The estimated investment is US$ 144.8 million. Under this phase, 10,750 kilometers of transmission lines will be constructed, and 27,500 MVA substations are planned to be added.
Competitive Landscape:
- The market research report has also provided a comprehensive analysis of the competitive landscape in the market. Competitive analysis such as market structure, key player positioning, top winning strategies, competitive dashboard, and company evaluation quadrant has been covered in the report. Also, detailed profiles of all major companies have been provided. Some of the major market players in the Switchgear industry include ABB Ltd., CG Power and Industrial Solutions Limited, Eaton Corporation PLC, Fuji Electric Co. Ltd., General Electric Company, Havells India Limited, Hitachi Ltd., Larsen & Toubro Limited, Meidensha Corporation, Mitsubishi Electric Corporation, Powell Industries Inc., Schneider Electric SE, Siemens AG, Toshiba Corporation, among many others.
(Please note that this is only a partial list of the key players, and the complete list is provided in the report.)
Switchgear Market News:
- February 2023: Toshiba Transmission & Distribution Systems Private Limited (TTDI) announced that it received orders for 23 units of 400 kV and nine units of 220 kV gas-insulated switchgear for the development and enhancement of power transmission and distribution networks to the latest 2X500 MVA substation at Xeldem in Goa and pooling substations of solar and wind renewable projects at Alamuru and Kodamuru at 400 kV voltage levels.
- April 2023: Siemens expanded its sustainable blue GIS portfolio with the 8DAB 40. The switchgear for primary distribution networks up to 40,5 kV uses clean air as an insulating medium with GWP<1, making it climate-friendly and completely free of fluorinated gasses.
- February 2024: Schneider Electric, the global leader in the digital transformation of energy management and automation, announced the upcoming launch of its new SureSeT Medium Voltage (MV) switchgear offering for the Canadian market. This new and improved solution backed by the innovative and award-winning EvoPacT circuit breaker, has been designed to address the needs for primary switchgear applications with a smaller, stronger, and smarter solution capable of managing digital day-to-day operations.
Switchgear Market Report Scope:
| Report Features | Details |
|---|---|
| Base Year of the Analysis | 2025 |
| Historical Period | 2020-2025 |
| Forecast Period | 2026-2034 |
| Units | Billion USD |
| Scope of the Report | Exploration of Historical Trends and Market Outlook, Industry Catalysts and Challenges, Segment-Wise Historical and Future Market Assessment:
|
| Voltage Types Covered | Low-Voltage, Medium-Voltage, High-Voltage |
| Insulations Covered | Gas Insulated Switchgear (GIS), Air Insulated Switchgear (AIS), Others |
| Installations Covered | Indoor, Outdoor |
| End Uses Covered | Commercial, Residential, Industrial |
| Regions Covered | Asia Pacific, Europe, North America, Latin America, Middle East and Africa |
| Countries Covered | United States, Canada, Germany, France, United Kingdom, Italy, Spain, Russia, China, Japan, India, South Korea, Australia, Indonesia, Brazil, Mexico |
| Companies Covered | ABB Ltd., CG Power and Industrial Solutions Limited, Eaton Corporation PLC, Fuji Electric Co. Ltd., General Electric Company, Havells India Limited, Hitachi Ltd., Larsen & Toubro Limited, Meidensha Corporation, Mitsubishi Electric Corporation, Powell Industries Inc., Schneider Electric SE, Siemens AG, Toshiba Corporation, etc. |
| Customization Scope | 10% Free Customization |
| Post-Sale Analyst Support | 10-12 Weeks |
| Delivery Format | PDF and Excel through Email (We can also provide the editable version of the report in PPT/Word format on special request) |
Key Benefits for Stakeholders:
- IMARC’s report offers a comprehensive quantitative analysis of various market segments, historical and current market trends, market forecasts, and dynamics of the switchgear market from 2020-2034.
- The research study provides the latest information on the market drivers, challenges, and opportunities in the global switchgear market.
- The study maps the leading, as well as the fastest-growing, regional markets. It further enables stakeholders to identify the key country-level markets within each region.
- Porter's five forces analysis assist stakeholders in assessing the impact of new entrants, competitive rivalry, supplier power, buyer power, and the threat of substitution. It helps stakeholders to analyze the level of competition within the switchgear industry and its attractiveness.
- Competitive landscape allows stakeholders to understand their competitive environment and provides an insight into the current positions of key players in the market.
Frequently Asked Questions About the Switchgear Market Report
The global switchgear market was valued at USD 122.1 Billion in 2025.
We expect the global switchgear market to exhibit a CAGR of 4.23% during 2026-2034.
The growing adoption of switchgear across the residential, commercial, and industrial sectors to provide safety from short-circuits and fault currents, is primarily driving the global switchgear market.
The sudden outbreak of the COVID-19 pandemic had led to the implementation of stringent lockdown regulations across several nations resulting in temporary closure of various manufacturing units for switchgear.
Based on the voltage type, the global switchgear market has been segmented into low-voltage, medium-voltage, and high-voltage. Currently, medium-voltage holds the majority of the total market share.
Based on the insulation, the global switchgear market can be divided into Gas Insulated Switchgear (GIS), Air Insulated Switchgear (AIS), and others. Among these, Gas Insulated Switchgear (GIS) currently exhibits a clear dominance in the market.
Based on the installation, the global switchgear market has been categorized into indoor and outdoor. Currently, outdoor installation accounts for the majority of the global market share.
Based on the end use, the global switchgear market can be segregated into commercial, residential, and industrial. Among these, the industrial sector holds the largest market share.
On a regional level, the market has been classified into North America, Asia-Pacific, Europe, Latin America, and Middle East and Africa, where Asia-Pacific currently dominates the global market.
Some of the major players in the global switchgear market include ABB Ltd., CG Power and Industrial Solutions Limited, Eaton Corporation PLC, Fuji Electric Co. Ltd., General Electric Company, Havells India Limited, Hitachi Ltd., Larsen & Toubro Limited, Meidensha Corporation, Mitsubishi Electric Corporation, Powell Industries Inc., Schneider Electric SE, Siemens AG, and Toshiba Corporation.
Need more help?
- Speak to our experienced analysts for insights on the current market scenarios.
- Include additional segments and countries to customize the report as per your requirement.
- Gain an unparalleled competitive advantage in your domain by understanding how to utilize the report and positively impacting your operations and revenue.
- For further assistance, please connect with our analysts.
 Request Customization
 Speak to an Analyst
 Request Brochure
 Inquire Before Buying
Benefits of Customization
- Personalize this research
- Triangulate with your data
- Get data as per your format and definition
- Gain a deeper dive into a specific application, geography, customer, or competitor
- Any level of personalization
Get in Touch With Us
UNITED STATES
Phone: +1-201-971-6302
INDIA
Phone: +91-120-433-0800
UNITED KINGDOM
Phone: +44-753-714-6104
Email: [email protected]
Client Testimonials


.webp)


