
Telecom Analytics Market Size, Share, Trends and Forecast by Component, Deployment Mode, Organization Size, Application, and Region, 2026-2034
Telecom Analytics Market Size and Share:
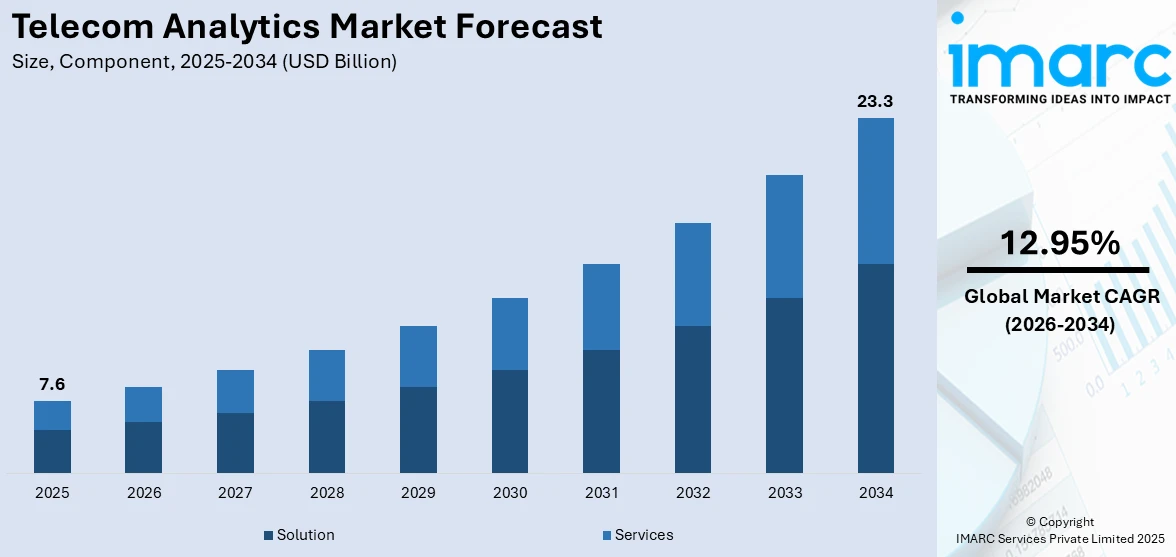
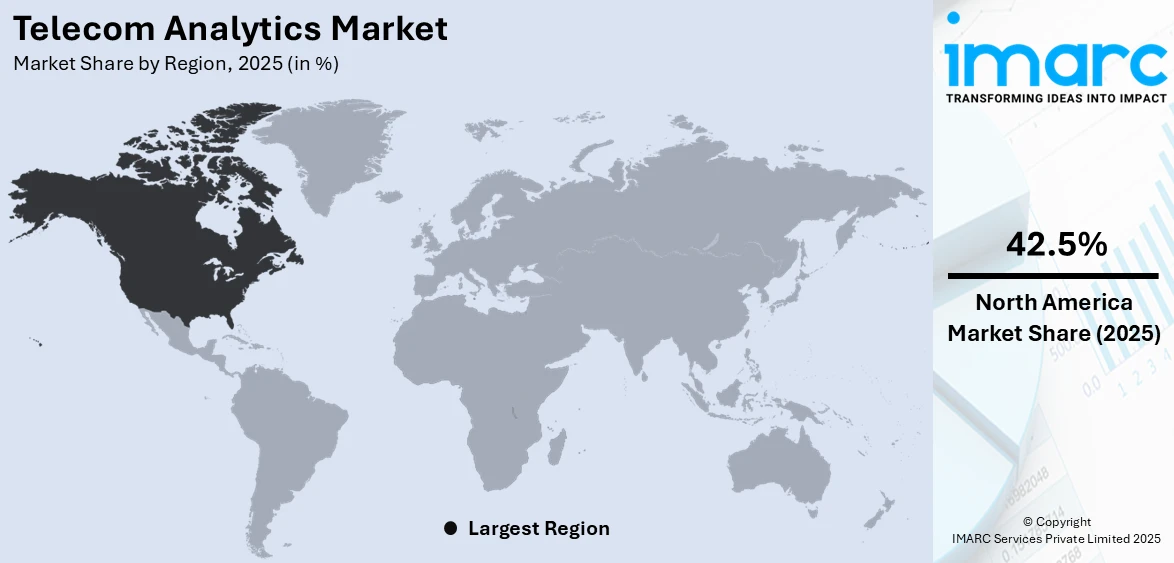
The global telecom analytics market size was valued at USD 7.6 Billion in 2025. Looking forward, IMARC Group estimates the market to reach USD 23.3 Billion by 2034, exhibiting a CAGR of 12.95% from 2026-2034. North America currently dominates the market, holding a market share of over 42.5% in 2025. The rising number of telecom data, the inflating need for minimizing churn, and the widespread usage of advanced technologies, such as big data, the Internet of Things (IoT), and data science, represent some of the primary drivers fueling the market.
|
Report Attribute
|
Key Statistics
|
|---|---|
|
Base Year
|
2025 |
|
Forecast Years
|
2026-2034 |
|
Historical Years
|
2020-2025
|
|
Market Size in 2025
|
USD 7.6 Billion |
|
Market Forecast in 2034
|
USD 23.3 Billion |
| Market Growth Rate (2026-2034) | 12.95% |
The market is primarily driven by rising demand for enhanced customer experiences, real-time insights, and optimized network performance. The rapid deployment of 5G networks, expected to reach 1.2 billion connections by 2025 and cover a third of the world’s population, as per GSMA, necessitates advanced analytics. Automation, artificial intelligence (AI), and machine learning advancements enable predictive maintenance and resource optimization, stimulating operational efficiency. For example, SK Telecom’s USD 10 Million investment in Perplexity AI strengthens its generative AI capabilities, enhancing its AI personal assistant services. Partnerships like these highlight the integration of AI and telecom analytics to deliver seamless connectivity, interactive queries, and innovative digital transformation solutions.
To get more information on this market Request Sample
The United States is a key regional market and is majorly propelled by the increasing need for data-driven decision-making, enhanced customer experience management, and optimized network performance. The rapid adoption of 5G, Internet of Things (IoT) integration, and cloud-based telecom infrastructure requires advanced analytics to process large data volumes and ensure seamless connectivity. On February 21, 2024, Dell Technologies introduced new solutions, including the Telecom Infrastructure Automation Suite for automated multi-vendor management and Telecom Infrastructure Blocks for Red Hat to simplify cloud deployments, enhancing efficiency, and supporting 5G expansion. Rising concerns over cybersecurity and fraud detection further drive analytics adoption for real-time anomaly detection. Increasing investments in AI and machine learning enable predictive maintenance, while government initiatives promoting digital transformation strengthen telecom analytics adoption across the U.S. market.
Telecom Analytics Market Trends:
Rising Monetization of Data
Communication service providers (CSPs) recognize the importance of collecting data that holds substantial value beyond their traditional services. Consequently, CSPs are extensively utilizing telecom analytics to gain actionable insights from their data, which, in turn, allows them to provide valuable information-driven services to other industries. For example, Verizon, a telecommunications provider across the United States, adopted numerous analytic solutions and AI groups around the company. PwC projects that worldwide data usage on telecom networks will nearly triple, rising from 3.4 million petabytes (PB) in 2022 to 9.7 million PB by 2027. Moreover, communication service providers have opportunities to unlock additional revenue through strategic collaborations and partnerships. For example, Pod Solutions joined forces with Subex Limited to enhance IoT billing and connectivity services with advanced security solutions. The collaboration with Subex aided Pod Solutions to develop novel security services, which allowed customers to deploy, bill, and create IoT systems with maximum security.
Growing Regulatory Policies and Compliance
The launch of favorable policies by government bodies to promote the usage of telecom analytics is primarily driving the global market. For instance, in July 2022, the United States Department of Agriculture (USDA) announced an investment of USD 401 Million to enable access to high-speed internet to 31,000 rural residents and businesses in 11 states. Apart from this, the growing focus on regulatory compliance is further positively propelling the telecom analytics market growth. General regulatory updates, like the Kari’s Law and the RAY BAUM’s Act, can have longer lead timelines. As a result, companies are extensively using the Alliance for Telecommunications Industry Solutions (ATIS) to get timely notifications on telecom regulatory requirements.
Development of Advanced Software
The introduction of cloud-based telecom analytics solutions by key players to remove the need for substantial upfront investments in infrastructures and hardware represents one of the primary factors fueling the global telecom analytics market. Moreover, the solution supports automated and intelligent solution decision-making based on correlated reports generated from data across 5G networks with the help of AI and machine learning tools. The global machine learning market size reached USD 31.0 Billion in 2024. In addition to this, Oracle introduced Oracle Construction Intelligence Cloud Analytics. It addressed the issue of integrating data from numerous applications to project dangers and guide future activities faced by construction and engineering companies, which, in turn, assists them in identifying problems and focusing on strategies to promote continuous improvement throughout asset building, project planning, asset operation, etc.
Telecom Analytics Industry Segmentation:
IMARC Group provides an analysis of the key trends in each segment of the global telecom analytics market, along with forecast at the global, regional, and country levels from 2026-2034. The market has been categorized based on component, deployment mode, organization size, and application.
Analysis by Component:
- Solution
- Services
Solution stands as the largest component in 2025, holding around 69.0% of the market. Telecom analytics solutions comprise a wide array of software and tools designed to extract actionable insights from complex and vast data sets within the telecommunications ecosystem. For example, in March 2023, IBM Corporation revealed plans to supply Telecom Egypt (TE) with intelligent automation software, enabling a unified solution for managing operations support systems (OSS) across fixed, mobile, and core networks. Similarly, in February 2023, Bharti Airtel partnered with NVIDIA to create an AI-driven solution aimed at improving customer experiences for inbound calls at its contact centers.
Analysis by Deployment Mode:
- Cloud-based
- On-premises
Cloud-based mode leads the market with around 55.8% of market share in 2025. The inflating popularity of cloud-based telecom analytics solutions, as they offer scalability and flexibility, thereby allowing CSPs to adjust resources according to demand seamlessly. In February 2023, Nokia Corporation introduced AVA Customer and Mobile Network Insights, a cloud-native analytics software designed to streamline the collection and analysis of 5G network data. Moreover, Oracle introduced Oracle Construction Intelligence Cloud Analytics. These solutions provide cost-effectiveness, which is projected to augment the growth of the telecom analytics market in this segmentation over the forecasted period.
Analysis by Organization Size:
- Large Enterprises
- Small and Medium-sized Enterprises
Large enterprises lead the market with around 77.6% of market share in 2025. Telecom analytics is gaining extensive traction among large enterprises, as it provides them with the necessary tools to manage, track, and optimize their network. Additionally, with analytical services and solutions, large enterprises have greater insight into customer preferences, which, in turn, helps them to build lasting relationships with individuals. Telecom analytics also enables large enterprises to identify emerging market trends, improve decision-making, and enhance service delivery. By leveraging predictive analytics, businesses can proactively address network issues, minimize downtime, and optimize resource utilization, ultimately driving customer satisfaction and enhancing operational efficiency in a competitive landscape.
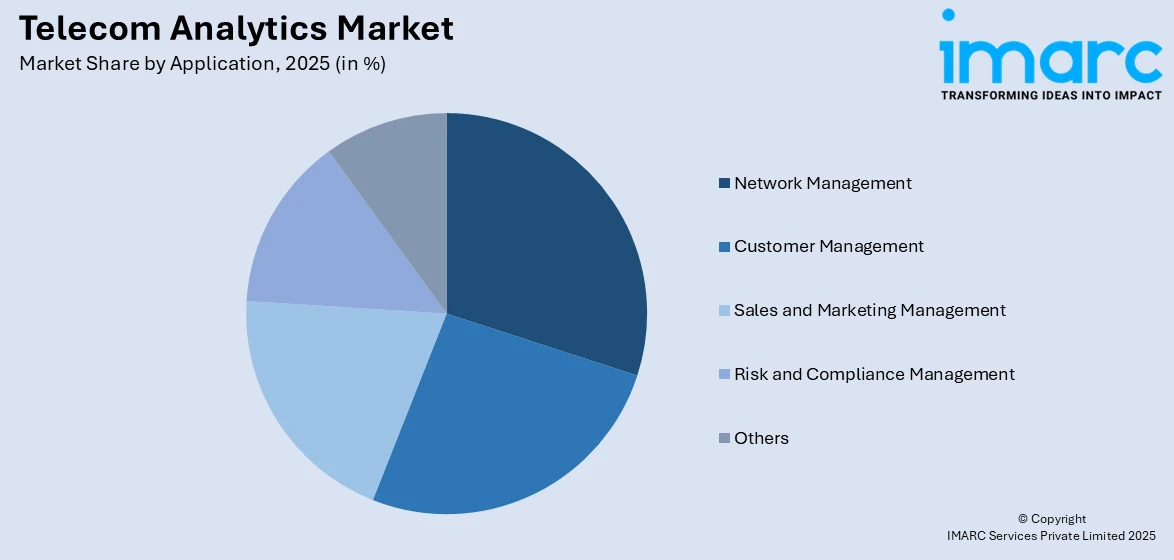
Analysis by Application:
Access the comprehensive market breakdown Request Sample
- Customer Management
- Network Management
- Sales and Marketing Management
- Risk and Compliance Management
- Others
Network management leads the market with around 29.8% of market share in 2025. Network management is an important aspect of the telecommunications industry. The rising need for network management is bolstering the adoption of telecom analytics solutions, as they enable communication service providers (CSPs) to predict potential outages and optimize resource allocation. This will continue to stimulate the segment's growth over the foreseeable future. Additionally, the increasing complexity of telecom networks, driven by the deployment of 5G, Internet of things (IoT), and cloud technologies, further highlights the need for advanced analytics solutions. These tools provide real-time insights into network performance, ensuring seamless connectivity and enhanced user experience. Furthermore, the growing demand for automation in network operations is encouraging CSPs to adopt artificial intelligence (AI) and machine learning-based analytics to improve efficiency and reduce operational costs.
Regional Analysis:
To get more information on the regional analysis of this market Request Sample
- North America
- United States
- Canada
- Asia Pacific
- China
- Japan
- India
- South Korea
- Australia
- Indonesia
- Others
- Europe
- Germany
- France
- United Kingdom
- Italy
- Spain
- Russia
- Others
- Latin America
- Brazil
- Mexico
- Others
- Middle East and Africa
In 2025, North America accounted for the largest market share of over 42.5%. The rising number of key players in North America, including IBM Corporation and Oracle Corporation, is primarily propelling the regional market. In line with this, telecom analytics industry players are also entering strategic partnerships and collaborations, which is acting as another significant growth-inducing factor. For example, IBM acquired Sanovi Technologies to elevate its cloud offerings. Furthermore, the widespread adoption of consumer electronics products, including smartphones and tablets, in the U.S. is positively influencing the market growth across the country. For example, the U.S. Census Bureau and Consumer Technology Association reported in January 2022 that sales of smartphones in the U.S. rose to 74.7 Billion in 2022 from USD 73 Billion in 2021. The rising number of smartphone users is elevating the incidences of fraud, which is augmenting the need for telecom analytics solutions across North America. Moreover, the region has some of the world's largest cellular service providers, who rely extensively on consumer feedback. Consequently, CSPs in North America are opting for telecom analytics to offer better quality service at high efficiency. For example, Verizon, a telecommunications provider in the United States, deployed several analytic solutions and AI groups around the company. Similarly, the Data Science and Cognitive Intelligence group focuses on implementing cognitive technology in Verizon's customer interactions.
Key Regional Takeaways:
United States Telecom Analytics Market Analysis
In 2025, the United States accounts for 73.70% of North America telecom analytics market. The United States has long been a hub for innovation, particularly in the field of artificial intelligence (AI), with AI startups playing a significant role in driving the country’s technological advancement. Between 2013 and 2022, the U.S. saw the emergence of 4,633 AI startups, highlighting its position as a global leader in AI development. In 2022 alone, 524 new AI startups were founded, attracting a remarkable USD 47 Billion in non-governmental funding. This thriving AI ecosystem is fueling the growth of the telecom analytics market, as telecom operators in the U.S. increasingly leverage AI and machine learning to optimize network performance, enhance customer experience, and streamline operations. Additionally, the shift toward 5G technologies requires robust analytics solutions to manage large volumes of data generated by high-speed networks. As telecom companies invest in advanced data analytics tools for predictive maintenance, fraud detection, and churn prediction, the U.S. market for telecom analytics continues to expand. The presence of numerous technology providers, coupled with ongoing government support for digital infrastructure and innovation, positions the U.S. as a key player in the global telecom analytics market.
Europe Telecom Analytics Market Analysis
In Europe, the telecom analytics market is experiencing significant growth, driven by digital transformation, the rollout of 5G networks, and an increasing reliance on data-driven insights. Telecom operators are adopting advanced analytics solutions to optimize network performance, streamline operations, and enhance customer experiences. A notable trend is the growing integration of the Internet of Things (IoT) into various sectors. According to reports, 29% of EU enterprises used IoT devices in 2021, primarily for securing their premises, highlighting the growing importance of connected devices in the region. This rise in IoT adoption is fueling demand for telecom analytics, as operators need real-time data processing capabilities to manage the influx of connected devices. Additionally, Europe’s strong regulatory environment, particularly around data privacy (GDPR), is driving telecom companies to invest in analytics platforms that ensure compliance while unlocking actionable insights. With the increasing focus on operational efficiency and personalized customer services, telecom analytics solutions are vital for businesses to remain competitive in the region. The continued growth of IoT, along with the ongoing 5G expansion, further positions Europe as a key market for telecom analytics, with sustained growth expected in the coming years.
Asia Pacific Telecom Analytics Market Analysis
In the Asia-Pacific (APAC) region, the telecom analytics market is experiencing strong growth, driven by the rapid adoption of 5G networks and increasing mobile data consumption. South Korea leads the way, with 31.3 Million 5G connections, accounting for more than 48% of the country's total mobile connections, while China boasts over 700 million 5G connections, representing 41% of all mobile connections, according to GSMA. These impressive figures highlight the region's commitment to advancing telecom infrastructure, creating a strong demand for advanced analytics tools to manage and optimize the large volumes of data generated by 5G networks. The region's growing reliance on mobile broadband services and connected devices further accelerates the adoption of telecom analytics, enabling operators to enhance network performance, improve customer experience, and streamline operations. As emerging economies in Southeast Asia also expand their telecom networks, the demand for data-driven insights and predictive analytics continues to rise, further fueling market growth in APAC.
Latin America Telecom Analytics Market Analysis
Latin America is emerging as one of the fastest-growing mobile markets in the world, creating substantial opportunities for the telecom analytics sector. According to the Mobile Growth Association (MGA), the region had 326 Million mobile internet users in 2018, a number projected to grow to 422 Million by 2025. This rapid expansion in mobile connectivity is driving telecom operators to adopt advanced analytics solutions to manage rising data traffic, optimize network performance, and improve customer experience. Additionally, the rollout of 5G networks and the increasing adoption of IoT devices are further strengthening the demand for real-time analytics tools. As operators focus on enhancing operational efficiency and delivering personalized services, telecom analytics is becoming essential for sustaining growth and innovation in Latin America.
Middle East and Africa Telecom Analytics Market Analysis
The Middle East and Africa (MEA) telecom analytics market is expanding rapidly, driven by the growing adoption of 5G networks and increasing mobile penetration. According to TeleGeography, Saudi Arabia leads the MEA region in 5G adoption, with over 11.2 Million subscriptions by the end of 2022, accounting for more than a quarter of the country’s total mobile sector. This rise in 5G users highlights the need for advanced analytics solutions to manage rising data traffic and optimize network performance. As telecom operators focus on enhancing customer experiences and supporting smart city initiatives, analytics tools are becoming indispensable in the MEA region.
Competitive Landscape:
Top telecom analytics companies are strengthening the market through strategic initiatives. These companies invest in advanced research and development (R&D) activities to continuously enhance the capabilities of telecom analytics solutions. They collaborate with technology partners to integrate cutting-edge technologies like AI and machine learning, enabling more accurate insights and predictive capabilities. Moreover, top firms prioritize customization, tailoring telecom analytics solutions to meet different communication service providers' unique needs. They offer comprehensive training and support to ensure seamless adoption and effective utilization of these solutions. Furthermore, these companies engage in industry partnerships, sharing best practices and case studies demonstrating the tangible benefits of telecom analytics in enhancing operational efficiency, customer experiences, and security. By leading the way in innovation, customization, and collaboration, top companies are driving wider adoption of telecom analytics across the industry, fortifying their position as a crucial tool for shaping the future of telecommunications.
The report provides a comprehensive analysis of the competitive landscape in the telecom analytics market with detailed profiles of all major companies, including:
- Accenture plc
- Adobe Inc.
- Cisco Systems Inc.
- Dell Technologies Inc.
- International Business Machines Corporation
- Oracle Corporation
- SAP SE
- SAS Institute
- Sisense Inc.
- Tableau Software (Salesforce.com Inc.)
- Teradata Corporation
- TIBCO Software Inc.
Latest News and Developments:
- April 2024: ThinkCX Technologies Inc. launched Mobile SwitchInsight in the US, a telecom analytics solution aimed at improving market intelligence for wireless carriers. By leveraging privacy-compliant data sources and advanced analytics, the product provides in-depth insights into subscriber switching patterns across Mobile Network Operators (MNOs), Mobile Virtual Network Operators (MVNOs), and both Prepaid and Postpaid segments, offering a more detailed analysis than current industry tools.
- April 2024: GL Communications Inc. launched the IP Analytics™ Tool for telecom analytics, enabling real-time analysis of high-speed IP traffic. The tool categorizes data by IP addresses, Class of Service, and TCP/UDP ports, offering insights into network performance, QoS, and troubleshooting, while supporting advanced filtering and throughput analysis.
- January 2024: Databricks launched the Data Intelligence Platform for Communications, a data and AI solution tailored for telecom analytics. The platform provides CSPs with advanced tools for data management, trend forecasting, demand prediction, and insights monetization, all while ensuring data privacy. Early adopters like AT&T use it to enhance fraud detection and operational efficiency.
- February 2023: Nokia launched AVA Customer and Mobile Network Insights, a cloud-native analytics solution for 5G networks. Using AI and machine learning, it helps CSPs enhance operational efficiency, network performance, and customer experience. Built on Nokia’s AVA Open Analytics Framework, it enables collaboration through open APIs.
- January 2022: Oracle introduced Oracle Cloud for Telcos; a suite of cloud solutions built on Oracle Cloud Infrastructure (OCI). Designed to support telcos in managing complex networks, OCI offered over 80 cloud services, including data management, analytics, and AI, enabling telcos to modernize applications and drive business growth.
Telecom Analytics Market Report Scope:
| Report Features | Details |
|---|---|
| Base Year of the Analysis | 2025 |
| Historical Period | 2020-2025 |
| Forecast Period | 2026-2034 |
| Units | Billion USD |
| Scope of the Report | Exploration of Historical Trends and Market Outlook, Industry Catalysts and Challenges, Segment-Wise Historical and Future Market Assessment:
|
| Components Covered | Solution, Services |
| Deployment Modes Covered | Cloud-based, On-premises |
| Organization Sizes Covered | Large Enterprises, Small and Medium-sized Enterprises |
| Applications Covered | Customer Management, Network Management, Sales and Marketing Management, Risk and Compliance Management, Others |
| Regions Covered | Asia Pacific, Europe, North America, Latin America, Middle East and Africa |
| Countries Covered | United States, Canada, Germany, France, United Kingdom, Italy, Spain, Russia, China, Japan, India, South Korea, Australia, Indonesia, Brazil, Mexico |
| Companies Covered | Accenture plc, Adobe Inc., Cisco Systems Inc., Dell Technologies Inc., International Business Machines Corporation, Oracle Corporation, SAP SE, SAS Institute, Sisense Inc., Tableau Software (Salesforce.com Inc.), Teradata Corporation, TIBCO Software Inc., etc. |
| Customization Scope | 10% Free Customization |
| Post-Sale Analyst Support | 10-12 Weeks |
| Delivery Format | PDF and Excel through Email (We can also provide the editable version of the report in PPT/Word format on special request) |
Key Benefits for Stakeholders:
- IMARC’s report offers a comprehensive quantitative analysis of various market segments, historical and current market trends, market forecasts, and dynamics of the telecom analytics market from 2020-2034.
- The research study provides the latest information on the market drivers, challenges, and opportunities in the global telecom analytics market.
- The study maps the leading, as well as the fastest-growing, regional markets. It further enables stakeholders to identify the key country-level markets within each region.
- Porter's five forces analysis assists stakeholders in assessing the impact of new entrants, competitive rivalry, supplier power, buyer power, and the threat of substitution. It helps stakeholders to analyze the level of competition within the telecom analytics industry and its attractiveness.
- Competitive landscape allows stakeholders to understand their competitive environment and provides an insight into the current positions of key players in the market.
Frequently Asked Questions About the Telecom Analytics Market Report
Telecom analytics refers to the use of advanced data analysis tools and technologies to optimize network performance, enhance customer experience, and improve decision-making for telecom operators. By leveraging big data, AI, and machine learning, it helps identify trends, detect anomalies, and ensure seamless connectivity.
The telecom analytics market was valued at USD 7.6 Billion in 2025.
IMARC estimates the global telecom analytics market to exhibit a CAGR of 12.95% during 2026-2034.
The global market is primarily driven by the rising demand for enhanced customer experiences, increasing adoption of 5G and IoT technologies, growing concerns over network security and fraud detection, advancements in AI and machine learning, and widespread digital transformation initiatives.
In 2025, solution represented the largest segment by component, driven by its ability to provide actionable insights from vast telecom data sets and optimize operations.
Cloud-based leads the market by deployment mode attributed to its scalability, cost-effectiveness, and flexibility in managing telecom infrastructure demands.
The large enterprises are the leading segment by enterprise size, driven by their need to optimize networks, improve customer experience, and leverage predictive analytics for decision-making.
In 2025, network management represented the largest segment by application, driven by the rising complexity of telecom networks and the need for real-time performance optimization.
On a regional level, the market has been classified into North America, Asia Pacific, Europe, Latin America, and Middle East and Africa, wherein North America currently dominates the global market.
Some of the major players in the global telecom analytics market include Accenture plc, Adobe Inc., Cisco Systems Inc., Dell Technologies Inc., International Business Machines Corporation, Oracle Corporation, SAP SE, SAS Institute, Sisense Inc., Tableau Software (Salesforce.com Inc.), Teradata Corporation, and TIBCO Software Inc., among others.
Need more help?
- Speak to our experienced analysts for insights on the current market scenarios.
- Include additional segments and countries to customize the report as per your requirement.
- Gain an unparalleled competitive advantage in your domain by understanding how to utilize the report and positively impacting your operations and revenue.
- For further assistance, please connect with our analysts.
 Request Customization
 Speak to an Analyst
 Request Brochure
 Inquire Before Buying
Benefits of Customization
- Personalize this research
- Triangulate with your data
- Get data as per your format and definition
- Gain a deeper dive into a specific application, geography, customer, or competitor
- Any level of personalization
Get in Touch With Us
UNITED STATES
Phone: +1-201-971-6302
INDIA
Phone: +91-120-433-0800
UNITED KINGDOM
Phone: +44-753-714-6104
Email: [email protected]
Client Testimonials


.webp)


