
Tin Prices, Trend, Chart, Demand, Market Analysis, News, Historical and Forecast Data Report 2026 Edition
Tin Price Trend, Index and Forecast
Track real-time and historical tin prices across global regions. Updated monthly with market insights, drivers, and forecasts.
Tin Prices May 2026
| Region | Price (USD/KG) | Latest Movement |
|---|---|---|
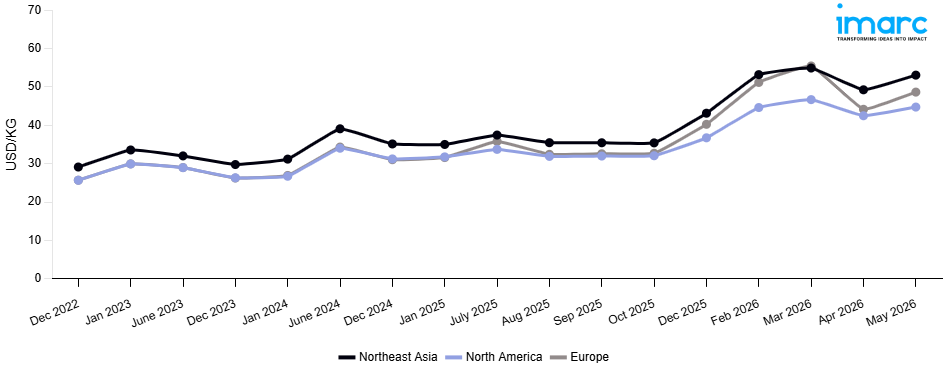
| Northeast Asia | 53.08 | 7.8% ↑ Up |
| Europe | 48.66 | 10.1% ↑ Up |
| North America | 44.76 | 5.3% ↑ Up |
Tin Price Index (USD/KG):
The chart below highlights monthly tin prices across different regions.
Get Access to Monthly/Quarterly/Yearly Prices, Request Sample
Market Overview Q1 Ending March 2026
Northeast Asia: The tin prices in Northeast Asia reached 54.93 USD/KG in March 2026. The upward pricing movement registered between December and March 2026 was 27.3%. Rising demand from the electronics, soldering, and semiconductor industries contributed to increased procurement activity, thereby maintaining bullish market conditions in the Northeast Asian tin market. Supply chain issues in the major tin producing countries disrupted raw material supply, thereby putting upward pressure on market rates. Increasing upstream costs in the major tin producing operations put upward pressure on production costs, thereby maintaining bullish market conditions. Restocking by the electronics sector, amid continued market tightness, contributed to strong buying activity, maintaining the bullish conditions.
Europe: The tin prices in Europe reached 55.47 USD/KG in March 2026. The upward pricing movement registered between December and March 2026 was 37.7%. Robust demand from the electronics assembly, soldering alloy, and specialty coating sectors drove strong tin procurement activity and reinforced sharply bullish pricing conditions across European markets throughout the review period. Significant supply constraints from major Southeast Asian and African tin producing nations tightened global refined tin availability and intensified competition among European downstream buyers for secured volumes. Elevated treatment and refining charges at key smelting operations raised production costs considerably and provided strong upward support to prevailing European market rates.
North America: The tin prices in North America reached 46.70 USD/KG in March 2026. The upward pricing movement registered between December and March 2026 was 27.1%. Active demand for tin products in the electronics manufacturing, food packaging, and soldering markets maintained strong buying and bullish pricing fundamentals in North American markets throughout the review period. Limiting global tin mine output from major tin producing regions such as Southeast Asia and South America kept refined tin product availability and prices elevated, maintaining a firm upward pricing trend for the region. Higher upstream costs for tin mining, processing, and logistics for major tin producing facilities also maintained elevated delivered costs, keeping the upward pricing trend for tin products intact for the quarter.
Market Overview Q4 Ending December 2025
Northeast Asia: The tin prices in Northeast Asia reached 43.16 USD/KG in December 2025. The upward pricing movement registered between September and December 2025 was 21.7%. Reduced mine output and deteriorating ore grades at major extraction operations led to tighter global supply, severely limiting the availability of refined tin across the region and driving the large price gain. As consumer electronics manufacturing schedules accelerated, procurement rivalry intensified amid strong demand from the semiconductor packaging and electronics soldering industries. Upward pricing dynamics were reinforced by rising upstream concentrate and smelting costs, which also increased production costs for local refiners. Strong offtake fundamentals were also maintained by increased consumption in the tinplate and specialty alloy manufacturing segments, and purchasing activity was boosted by downstream fabricators' strategic inventory building in anticipation of ongoing supply constraints, which kept the price momentum sharply bullish throughout the quarter.
Europe: The tin prices in Europe reached 40.27 USD/KG in December 2025. The upward pricing movement registered between September and December 2025 was 23.6%. Acute supply constraints resulting from limited worldwide mine production and decreased availability of imported refined tin severely limited regional volumes, which in turn supported the notable price increase. Throughout the quarter, procurement activity remained strong due to sustained demand from the food grade tinplate, electronics soldering, and specialized chemical manufacturing sectors. Delivered pricing pressures throughout the supply chain were further increased by growing shipping costs and elevating international benchmark valuations. Furthermore, buyers' procurement flexibility was constrained by a lack of alternative sourcing channels, and rising cost dynamics were exacerbated by strong upstream smelting and refining charges.
North America: The tin prices in North America reached 36.75 USD/KG in December 2025. The upward pricing movement registered between September and December 2025 was 14.8%. The notable price rise was fueled by robust demand from the electronics, soldering, tinplate coating, and specialty alloy production sectors, which maintained elevated procurement levels during the quarter. Stricter global supply conditions, driven by reduced mine output and restricted refined tin supply, have elevated international benchmark prices and increased import costs for domestic consumers. Strong upstream smelting and refining expenses drove rising pricing across the supply chain. Additionally, robust demand in the chemical catalyst and bronze alloy sectors bolstered strong consumption fundamentals, while increasing logistics and shipping expenses elevated delivered price points, leading to moderately positive market conditions during the quarter.
Market Overview Q3 Ending September 2025
Northeast Asia: The downward trend in tin prices was primarily driven by a reduction in demand from the manufacturing sector, particularly in relation to the electronics industry. These sectors account for a significant portion of the region's tin consumption, and the slowdown in demand directly impacted the price dynamics. The price dynamics were further strained by the rise in international shipping costs in early Q3 as a result of port congestion and increases in fuel prices. The continuous difficulties in international logistics caused supply chain disruptions in nations like China and Japan, which are important tin producers and consumers. Price volatility was also influenced by changes in exchange rates, especially those involving the Japanese yen. Additionally, in nations like South Korea, legislation meant to lessen their environmental impact had a secondary impact on production costs, which further influenced the trend in prices.
Europe: The increase was largely driven by higher demand from the automotive and renewable energy sectors, which saw an uptick in the use of tin for soldering and battery production. The European market also experienced higher costs associated with international shipping and compliance with stricter environmental regulations, which added to the cost of raw material imports. Additionally, geopolitical factors such as uncertainties around Brexit and supply chain issues in the UK created some short-term price fluctuations. However, the European market's reliance on imports from Southeast Asia and South America continued to exert downward pressure on price margins, as the cost of freight and tariffs remained significant.
North America: The movement was largely influenced by a gradual recovery in demand from the electronics and automotive industries, particularly in the United States and Mexico, which are major consumers of tin-based products. However, cost factors such as rising domestic labor wages, transportation expenses, and inflation contributed to upward price pressures. Additionally, the depreciation of the US dollar against key Asian currencies had a considerable impact on the cost of imports from countries like China and Indonesia. Despite the modest price hike, the North American market remained sensitive to fluctuations in global demand and was impacted by changes in the supply chain due to increased scrutiny on environmental and safety standards.
Tin Price Trend, Market Analysis, and News
IMARC's latest publication, “Tin Prices, Trend, Chart, Demand, Market Analysis, News, Historical and Forecast Data Report 2026 Edition,” presents a detailed examination of the tin market, providing insights into both global and regional trends that are shaping prices. This report delves into the spot price of tin at major ports and analyzes the composition of prices, including FOB and CIF terms. It also presents detailed tin prices trend analysis by region, covering North America, Europe, Asia Pacific, Latin America, and Middle East and Africa. The factors affecting tin pricing, such as the dynamics of supply and demand, geopolitical influences, and sector-specific developments, are thoroughly explored. This comprehensive report helps stakeholders stay informed with the latest market news, regulatory updates, and technological progress, facilitating informed strategic decision-making and forecasting.
Tin Industry Analysis
The global tin market size reached 314.7 Tons in 2025. By 2034, industry analysts expect the market to reach 387.1 Tons, reflecting a projected CAGR of 2.21% during 2026-2034. The market is driven by the increasing demand for tin in the electronics sector, the growing emphasis on renewable energy and electric vehicles, and advancements in recycling technologies.
Latest developments in the Tin industry:
- June 2025: International Resources Holding (IRH) acquired a 56% stake in Alphamin Resources, the operator of the Bisie tin mine in the Democratic Republic of Congo, for USD 367 million. The transaction included offtake rights and followed the mine’s resumption of operations after a temporary shutdown.
- June 2024: Tin explorer Elementos agreed to acquire up to 50% of Iberian Smelting, which owns and operates the Robledallano smelter in Spain, for EUR 3.2 million over a five-year period. The deal was structured to provide Elementos with access to local smelting capacity and downstream opportunities.
- June 2024: Atlantic Tin announced the results of a scoping study at its newly acquired SAMINE processing facility near the Achmmach tin project in Morocco. The acquisition, finalized in late May 2024, included the SAMINE mine and exploitation license, strengthening Atlantic Tin’s presence in the Moroccan tin sector.
Product Description
Tin is a soft, silvery-white metal that belongs to the group of post-transition metals in the periodic table. It plays a significant role in the global consumption and production hierarchy, particularly due to its use in electronics, soldering, and the manufacturing of alloys. Tin’s primary industrial applications include its use in tinplate for packaging, solder for electronics, and coatings for other metals to prevent corrosion. The unique attribute of tin is its ability to withstand high temperatures, making it indispensable in various industrial processes.
Report Coverage
| Key Attributes | Details |
|---|---|
| Product Name | Tin |
| Report Features | Exploration of Historical Trends and Market Outlook, Industry Demand, Industry Supply, Gap Analysis, Challenges, Tin Price Analysis, and Segment-Wise Assessment. |
| Currency/Units | US$ (Data can also be provided in local currency) or Metric Tons |
| Region/Countries Covered | The current coverage includes analysis at the global and regional levels only. Based on your requirements, we can also customize the report and provide specific information for the following countries: Asia Pacific: China, India, Indonesia, Pakistan, Bangladesh, Japan, Philippines, Vietnam, Thailand, South Korea, Malaysia, Nepal, Taiwan, Sri Lanka, Hongkong, Singapore, Australia, and New Zealand Europe: Germany, France, United Kingdom, Italy, Spain, Russia, Turkey, Netherlands, Poland, Sweden, Belgium, Austria, Ireland, Switzerland, Norway, Denmark, Romania, Finland, Czech Republic, Portugal and Greece North America: United States and Canada Latin America: Brazil, Mexico, Argentina, Columbia, Chile, Ecuador, and Peru Middle East & Africa: Saudi Arabia, UAE, Israel, Iran, South Africa, Nigeria, Oman, Kuwait, Qatar, Iraq, Egypt, Algeria, and Morocco The list of countries presented is not exhaustive. Information on additional countries can be provided if required by the client. |
| Information Covered for Key Suppliers |
|
| Customization Scope | The report can be customized as per the requirements of the customer |
| Report Price and Purchase Option |
Plan A: Monthly Updates - Annual Subscription
Plan B: Quarterly Updates - Annual Subscription
Plan C: Biannually Updates - Annual Subscription
|
| Post-Sale Analyst Support | 360-degree analyst support after report delivery |
| Delivery Format | PDF and Excel through email (We can also provide the editable version of the report in PPT/Word format on special request) |
Key Benefits for Stakeholders:
- IMARC’s report presents a detailed analysis of tin pricing, covering global and regional trends, spot prices at key ports, and a breakdown of FOB and CIF prices.
- The study examines factors affecting tin price trend, including input costs, supply-demand shifts, and geopolitical impacts, offering insights for informed decision-making.
- The competitive landscape review equips stakeholders with crucial insights into the latest market news, regulatory changes, and technological advantages, ensuring a well-rounded, strategic overview for forecasting and planning.
- IMARC offers various subscription options, including monthly, quarterly, and biannual updates, allowing clients to stay informed with the latest market trends, ongoing developments, and comprehensive market insights. The tin price charts ensure our clients remain at the forefront of the industry.
Frequently Asked Questions About the Tin Price Trend Report
The tin prices in May 2026 were 53.08 USD/KG in Northeast Asia, 48.66 USD/KG in Europe, and 44.76 USD/KG in North America.
The tin pricing data is updated on a monthly basis.
We provide the pricing data primarily in the form of an Excel sheet and a PDF.
Yes, our report includes a forecast for tin prices.
The regions covered include North America, Europe, Asia Pacific, Middle East, and Latin America. Countries can be customized based on the request (additional charges may be applicable).
Yes, we provide both FOB and CIF prices in our report.
Need more help?
- Speak to our experienced analysts for insights on the current market scenarios.
- Include additional segments and countries to customize the report as per your requirement.
- Gain an unparalleled competitive advantage in your domain by understanding how to utilize the report and positively impacting your operations and revenue.
- For further assistance, please connect with our analysts.
 Request Customization
 Inquire Before Buying
 Speak to an Analyst
 Request Brochure
Benefits of Customization
- Personalize this research
- Triangulate with your data
- Get data as per your format and definition
- Gain a deeper dive into a specific application, geography, customer, or competitor
- Any level of personalization
Get in Touch With Us
UNITED STATES
Phone: +1-201-971-6302
INDIA
Phone: +91-120-433-0800
UNITED KINGDOM
Phone: +44-753-714-6104
Email: [email protected]
Client Testimonials


.webp)


Why Choose Us
IMARC offers trustworthy, data-centric insights into commodity pricing and evolving market trends, enabling businesses to make well-informed decisions in areas such as procurement, strategic planning, and investments. With in-depth knowledge spanning more than 1000 commodities and a vast global presence in over 150 countries, we provide tailored, actionable intelligence designed to meet the specific needs of diverse industries and markets.
1000
+Commodities
150
+Countries Covered
3000
+Clients
20
+Industry
Robust Methodologies & Extensive Resources
IMARC delivers precise commodity pricing insights using proven methodologies and a wealth of data to support strategic decision-making.
Subscription-Based Databases
Our extensive databases provide detailed commodity pricing, import-export trade statistics, and shipment-level tracking for comprehensive market analysis.
Primary Research-Driven Insights
Through direct supplier surveys and expert interviews, we gather real-time market data to enhance pricing accuracy and trend forecasting.
Extensive Secondary Research
We analyze industry reports, trade publications, and market studies to offer tailored intelligence and actionable commodity market insights.
Trusted by 3000+ industry leaders worldwide to drive data-backed decisions. From global manufacturers to government agencies, our clients rely on us for accurate pricing, deep market intelligence, and forward-looking insights.