
United States Articulated Robot Market Size, Share, Trends, and Forecast by Payload, Function, Type, Component, End-Use Industry, and Region, 2026-2034
United States Articulated Robot Market Overview:
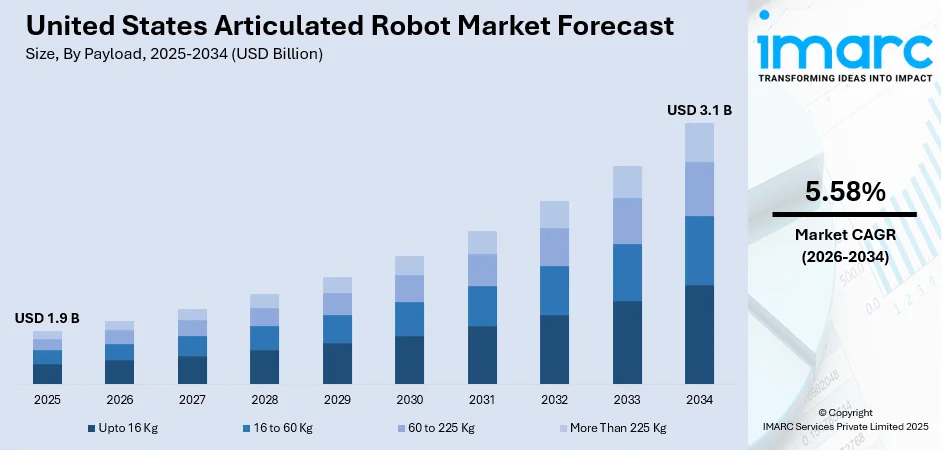
The United States articulated robot market size was valued at USD 1.9 Billion in 2025. Looking forward, the market is expected to reach USD 3.1 Billion by 2034, exhibiting a CAGR of 5.58% during 2026-2034. Midwest currently dominates the market, holding a significant market share in 2025. The market is expanding due to the rising automation across the automotive, electronics, and industrial sectors. The increasing demand for precision, speed, and efficiency in production lines is accelerating adoption. Advancements in smart technologies and workforce shortages further boost growth, shaping the competitive landscape of the United States articulated robot market share.
|
Report Attribute
|
Key Statistics
|
|---|---|
|
Base Year
|
2025
|
|
Forecast Years
|
2026-2034
|
|
Historical Years
|
2020-2025
|
|
Market Size in 2025
|
USD 1.9 Billion |
|
Market Forecast in 2034
|
USD 3.1 Billion |
| Market Growth Rate 2026-2034 | 5.58% |
The market is witnessing significant growth driven by increasing industrial automation across sectors, such as automotive, electronics, aerospace, and logistics. For instance, in June 2025, Amazon deployed its one millionth robot, supported by a new generative AI model that improves fleet efficiency by 10%. Advanced technology enables faster deliveries and lower costs. Over 700,000 employees have been upskilled. Robots are US-made, ensuring quality and continuous feedback between design, production, and operations. As companies seek greater precision, speed, and consistency in production processes, articulated robots are becoming essential for tasks like assembly, welding, packaging, and material handling. Their ability to operate continuously with high accuracy makes them ideal for enhancing productivity and reducing operational errors.
To get more information on this market Request Sample
Labor shortages in manufacturing and rising labor costs are also key factors driving the United States articulated robot market growth. Many US industries are turning to robotics to fill workforce gaps, improve safety, and lower dependency on manual labor. This shift not only reduces long-term costs but also improves workplace conditions by automating repetitive and hazardous tasks. Additionally, the rise of Industry 4.0 has accelerated demand for intelligent robotic systems. Articulated robots integrated with AI, IoT, and machine vision technologies enable real-time monitoring, predictive maintenance, and seamless coordination within smart factory environments. The growing electric vehicle (EV) manufacturing sector is further boosting adoption, as articulated robots play a crucial role in handling complex, high-volume production demands.
United States Articulated Robot Market Trends:
Widespread Adoption of Smart Factories and Automation Systems
The growing implementation of smart factories is significantly driving the demand for articulated robots in the US Advanced facilities like Hyundai’s USD 7.6 billion Metaplant America showcase how automation, AI vision, robotics, and private 5G are integrated to achieve Industry 4.0 milestones. The plant aims to produce 500,000 electric and hybrid vehicles annually, reinforcing the role of robotic systems in large-scale production. Such developments are pushing automation across multiple sectors, including automotive, electronics, and logistics. As more manufacturers adopt similar models, articulated robots become essential for achieving operational efficiency, production scalability, and enhanced precision, making smart factories a pivotal growth driver in the United States articulated robot market trends.
Growing Electric Vehicle (EV) Demand and Industrial Efficiency
The rapid increase in electric vehicle adoption is propelling demand for robotic automation to meet production targets. As of February 2025, electric cars made up 7.9% of the US automotive market, highlighting a shift towards cleaner mobility. This trend demands faster, more accurate, and scalable manufacturing processes, areas where articulated robots excel. Furthermore, industries are under pressure to reduce raw material waste and minimize operational costs, which these robots help address through precision handling and repeatable tasks. This dual push from EV demand and industrial efficiency is significantly contributing to the expansion of articulated robot usage in the manufacturing landscape.
Labor Safety, Cost Reduction, and Technological Advancements
Concerns over worker safety and the ongoing need to cut operational costs are encouraging businesses to adopt articulated robots. According to the United States articulated robot market forecast, these machines reduce human exposure to hazardous tasks while maintaining consistent productivity. At the same time, advancements in IoT and robotics are making these systems smarter and more adaptive. Continuous investments by the US Federal Government into robotics research and development (R&D) are also accelerating innovation and deployment across industries. The integration of IoT allows real-time monitoring, predictive maintenance, and enhanced efficiency, further justifying the upfront investment in automation. Combined, these factors are creating a favorable environment for the growth of articulated robots nationwide.
United States Articulated Robot Industry Segmentation:
IMARC Group provides an analysis of the key trends in each segment of the United States articulated robot market, along with forecasts at the country and regional levels from 2026-2034. The market has been categorized based on payload, function, type, component, and end-use industry.
Analysis by Payload:
- Upto 16 Kg
- 16 to 60 Kg
- 60 to 225 Kg
- More Than 225 Kg
The Up to 16 kg payload category holds the largest share in the market due to its versatility, compact design, and suitability for a wide range of applications. These robots are widely used in industries such as electronics, automotive, consumer goods, and metal fabrication, where tasks like pick-and-place, welding, assembling, and packaging require precision rather than heavy lifting. Their smaller footprint makes them ideal for integration into tight or modular production lines, especially in smart factories and small to mid-sized enterprises. Moreover, their lower cost and ease of deployment make them attractive for companies seeking flexible automation solutions. This combination of affordability, adaptability, and efficiency positions the “Up to 16 kg” segment as the market leader.
Analysis by Function:
- Handling
- Welding
- Dispensing
- Assembling
- Others
Handling holds the largest share in the market due to its extensive application across a variety of industries, including automotive, electronics, logistics, and manufacturing. These robots are essential for tasks such as material loading and unloading, part transfer, palletizing, packaging, and sorting, all of which demand precision, speed, and repeatability. With the rise of e-commerce and the need for streamlined warehouse operations, the demand for robotic handling solutions has surged. Additionally, handling robots help reduce human labor in repetitive or hazardous environments, enhancing workplace safety and operational efficiency. Their ability to operate continuously with high accuracy and minimal errors makes them a vital tool, driving their widespread adoption and dominance in the market.
Analysis by Type:
- 4-Axis or Less
- 5-Axis
- 6-Axis or More
4-axis or fewer articulated robots are widely used for simple, repetitive tasks such as palletizing, packaging, and basic material handling. Their lower cost, ease of programming, and sufficient flexibility for straightforward applications make them ideal for small to mid-sized manufacturers. These robots provide efficient performance with minimal maintenance, driving adoption in sectors where high-speed but limited-range motion is sufficient. Their affordability and reliability contribute significantly to their large share in the United States articulated robot market outlook.
5-axis articulated robots offer a balance between performance and complexity, making them suitable for mid-level applications like assembly, welding, and part transfer. They provide better maneuverability than 4-axis models while being less expensive and complex than 6-axis alternatives. This makes them appealing to manufacturers seeking enhanced precision without high operational costs. Their adaptability across various industries and ability to handle moderately complex tasks contribute to their strong position in the US articulated robot market.
6-axis or more articulated robots dominate advanced automation due to their exceptional flexibility, allowing movement across all directions and angles. These robots are essential for complex operations such as intricate assembly, welding, painting, and 3D handling in automotive, electronics, and aerospace sectors. Their ability to mimic human arm motion enables high-precision and multitasking capabilities. As industries adopt smarter and more versatile automation solutions, the demand for 6-axis robots continues to grow, securing a leading market share.
Analysis by Component:
- Controller
- Arm
- End Effector
- Drive
- Sensor
- Others
Controllers are expected to hold a significant share in the market as they serve as the brain of the robotic system, coordinating all movements and functions. Advanced controllers enable high-precision operations, integration with AI and IoT platforms, and real-time adjustments. Their role in optimizing performance, ensuring safety, and supporting complex tasks across industries like automotive and electronics makes them indispensable in modern automation setups, contributing to their dominant market share.
The robot arm is central to any articulated robot, offering flexibility and range of motion across multiple axes. It performs key tasks like lifting, moving, welding, or assembling with high precision. As demand grows for robots capable of mimicking human dexterity in varied industrial environments, the importance of reliable, versatile arms increases. Their crucial role in executing a wide array of industrial operations makes them a core component, thereby securing a large market share.
End effectors, attached to the robot arm, perform the actual task, such as gripping, welding, or painting. Their adaptability to specific applications across sectors like automotive, food processing, and packaging makes them highly valuable. With rising demand for task-specific automation and customization, end effectors are increasingly essential for enhancing operational efficiency, securing their strong market presence.
Analysis by End-Use Industry:
- Automotive
- Electrical and Electronics
- Chemicals, Rubber and Plastics
- Metal and Machinery
- Food and Beverages
- Precision Engineering and Optics
- Pharmaceuticals and Cosmetics
- Others
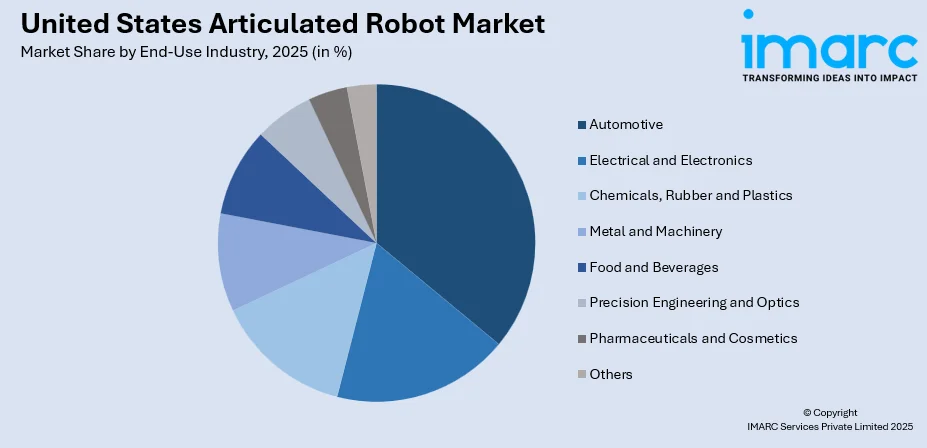
The automotive sector holds the largest share in the market due to its long-standing focus on automation, precision, and high-volume production. Articulated robots are extensively used in this industry for welding, painting, assembly, material handling, and quality inspection, tasks that demand consistent accuracy and efficiency. As automakers transition toward electric vehicles (EVs), new manufacturing processes further increase the need for robotic integration. Additionally, major automotive manufacturers continue to invest in smart factories and Industry 4.0 technologies, driving further adoption of advanced robotics. The sector’s emphasis on reducing labor costs, minimizing defects, and improving productivity ensures that articulated robots remain a crucial part of automotive production lines, maintaining their dominant position in the overall market landscape.
Regional Analysis:
- Northeast
- Midwest
- South
- West
The United States articulated robot market demand in the Midwest is primarily driven by the region’s strong manufacturing base, especially in automotive, metal fabrication, and industrial machinery. States like Michigan, Ohio, and Indiana are major hubs for automotive production, where articulated robots are widely used for welding, assembly, and material handling. The push toward smart factories and automation to enhance productivity and reduce labor dependency is also accelerating adoption. Additionally, the presence of several Tier 1 suppliers and OEMs fosters continuous investment in robotic technologies. Government incentives, workforce upskilling initiatives, and collaborations between robotics companies and academic institutions further support market growth. The Midwest’s focus on reviving and modernizing traditional manufacturing sectors is a significant catalyst for the expanding use of articulated robots.
Competitive Landscape:
The United States articulated robot market is highly competitive, driven by rapid industrial automation and demand for precision manufacturing. Key players include ABB, FANUC, KUKA, Yaskawa, and Kawasaki, collectively holding a significant market share. These companies compete on product innovation, reliability, and integration of AI and IoT capabilities. Universal Robots, under Teradyne, leads the collaborative robot (cobot) segment with its six-axis models. Domestic innovation is also rising, with startups like Boston Dynamics, Agility Robotics, and Figure AI making strides in humanoid and flexible robotics. Strategic partnerships, research and development (R&D) investments, and expanding applications in automotive, electronics, and logistics sectors are intensifying the landscape. As the US government pushes for advanced robotics development, competition between global giants and domestic pioneers is expected to accelerate.
The report provides a comprehensive analysis of the competitive landscape in the United States articulated robot market with detailed profiles of all major companies.
Latest News and Developments:
- May 2025: Amazon unveiled its new articulated robot named Vulcan at the Delivering the Future event in Dortmund, Germany, showcasing its ability to sense touch and handle tasks once limited to humans. Tesla had earlier developed Optimus, a humanoid articulated robot designed to perform a range of autonomous activities such as walking, lifting, and manipulating objects.
- June 2025: Hugging Face unveiled articulated robot HopeJR and compact Reachy Mini as part of its open-source robotics expansion after acquiring Pollen Robotics in April 2025. HopeJR featured 66 degrees of freedom for lifelike articulation, reinforcing the firm’s push for accessible and transparent robotics.
- March 2025: Contoro Robotics raised USD 12 Million in Series A funding to scale its articulated robot designed for trailer unloading automation. States Logistics in California had already used the articulated robot, which reduced manual labor in one of the warehouse's most demanding tasks.
- February 2025: OMRON certified Wiferion’s wireless charging for its LD series, enabling articulated robots and AMRs to recharge efficiently during operation with minimal downtime. Wiferion’s inductive solution had powered high-demand components like articulated arms without mechanical wear, as demonstrated by RAMP at a large automotive site.
- January 2025: LG Electronics acquired a majority 51% stake in Bear Robotics to strengthen its robotics portfolio, including articulated robot solutions. The acquisition followed LG’s earlier USD 60 Million investment and aimed to integrate Bear Robotics’ AI-powered technologies into LG's commercial robot business.
United States Articulated Robot Market Report Scope:
| Report Features | Details |
|---|---|
| Base Year of the Analysis | 2025 |
| Historical Period | 2020-2025 |
| Forecast Period | 2026-2034 |
| Units | Billion USD |
| Scope of the Report |
Exploration of Historical and Forecast Trends, Industry Catalysts and Challenges, Segment-Wise Historical and Future Market Assessment:
|
| Payloads Covered | Upto 16 Kg, 16 to 60 Kg, 60 to 225 Kg, More Than 225 Kg |
| Functions Covered | Handling, Welding, Dispensing, Assembling, Others |
| Types Covered | 4-Axis or Less, 5-Axis, 6-Axis or More |
| Components Covered | Controller, Arm, End Effector, Drive, Sensor, Others |
| End-Use Industries Covered | Automotive, Electrical and Electronics, Chemicals, Rubber and Plastics, Metal and Machinery, Food and Beverages, Precision Engineering and Optics, Pharmaceuticals and Cosmetics, Others |
| Region Covered | Northeast, Midwest, South, West |
| Customization Scope | 10% Free Customization |
| Post-Sale Analyst Support | 10-12 Weeks |
| Delivery Format | PDF and Excel through Email (We can also provide the editable version of the report in PPT/Word format on special request) |
Key Benefits for Stakeholders:
- IMARC’s report offers a comprehensive quantitative analysis of various market segments, historical and current market trends, market forecasts, and dynamics of the United States articulated robot market from 2020-2034.
- The research study provides the latest information on the market drivers, challenges, and opportunities in the United States articulated robot market.
- Porter's Five Forces analysis assists stakeholders in assessing the impact of new entrants, competitive rivalry, supplier power, buyer power, and the threat of substitution. It helps stakeholders to analyze the level of competition within the United States articulated robot industry and its attractiveness.
- Competitive landscape allows stakeholders to understand their competitive environment and provides an insight into the current positions of key players in the market.
Frequently Asked Questions About the United States Articulated Robot Market Report
The articulated robot market in the United States was valued at USD 1.9 Billion in 2025.
The United States articulated robot market is projected to exhibit a CAGR of 5.58% during 2026-2034, reaching a value of USD 3.1 Billion by 2034.
The United States articulated robot market is driven by the rising demand for automation in manufacturing (especially automotive, electronics, and food/beverage) to boost productivity, precision, and efficiency. Some of the other key factors include increasing labor costs, smart factory initiatives (Industry 4.0), and advancements in AI, machine learning, and collaborative robotics.
Midwest currently dominates the United States articulated robot market due to its strong manufacturing base, especially the automotive sector's automation needs for EV production. Other factors include rising labor costs, significant labor shortages, reshoring initiatives, and increasing adoption of Industry 4.0 and AI-powered solutions for enhanced efficiency and competitiveness.
Need more help?
- Speak to our experienced analysts for insights on the current market scenarios.
- Include additional segments and countries to customize the report as per your requirement.
- Gain an unparalleled competitive advantage in your domain by understanding how to utilize the report and positively impacting your operations and revenue.
- For further assistance, please connect with our analysts.
 Request Customization
 Speak to an Analyst
 Request Brochure
 Inquire Before Buying
Benefits of Customization
- Personalize this research
- Triangulate with your data
- Get data as per your format and definition
- Gain a deeper dive into a specific application, geography, customer, or competitor
- Any level of personalization
Get in Touch With Us
UNITED STATES
Phone: +1-201-971-6302
INDIA
Phone: +91-120-433-0800
UNITED KINGDOM
Phone: +44-753-714-6104
Email: [email protected]
Client Testimonials


.webp)


