
United States Biofertilizer Market Size, Share, Trends and Forecast by Type, Crop, Microorganism, Mode of Application, and Region, 2026-2034
United States Biofertilizer Market Size, Share, Trends & Forecast (2026-2034)
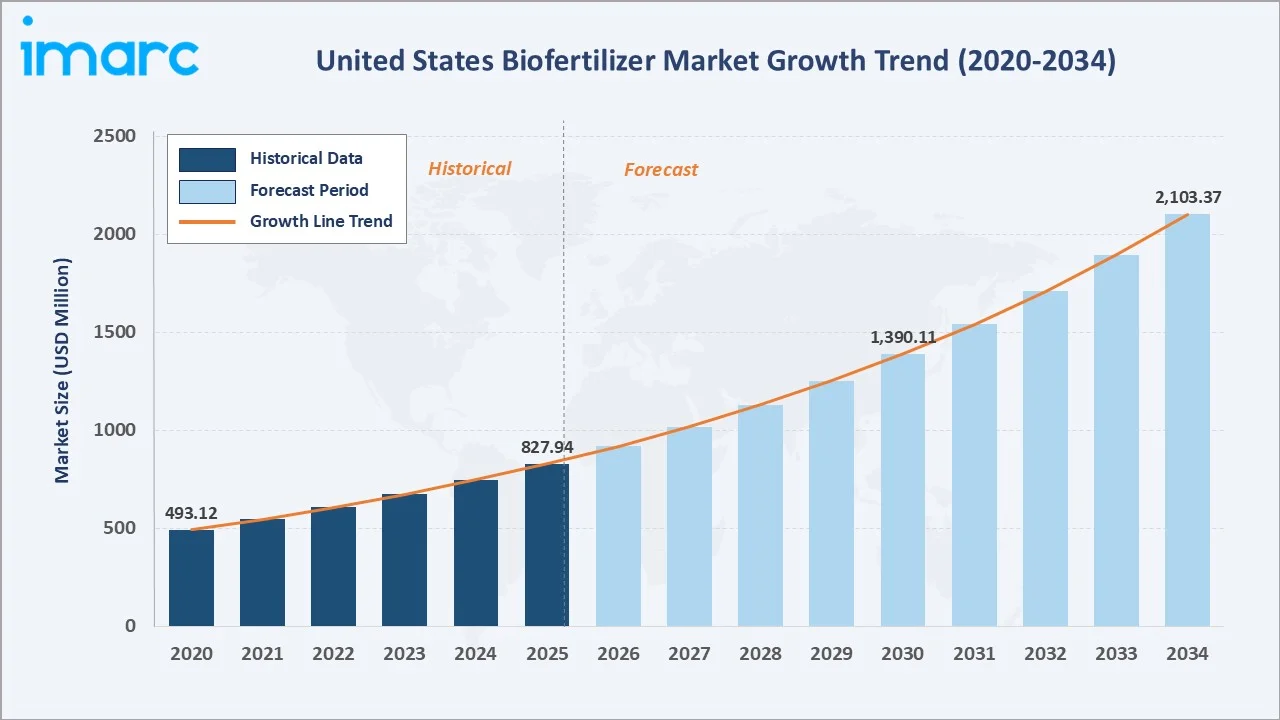
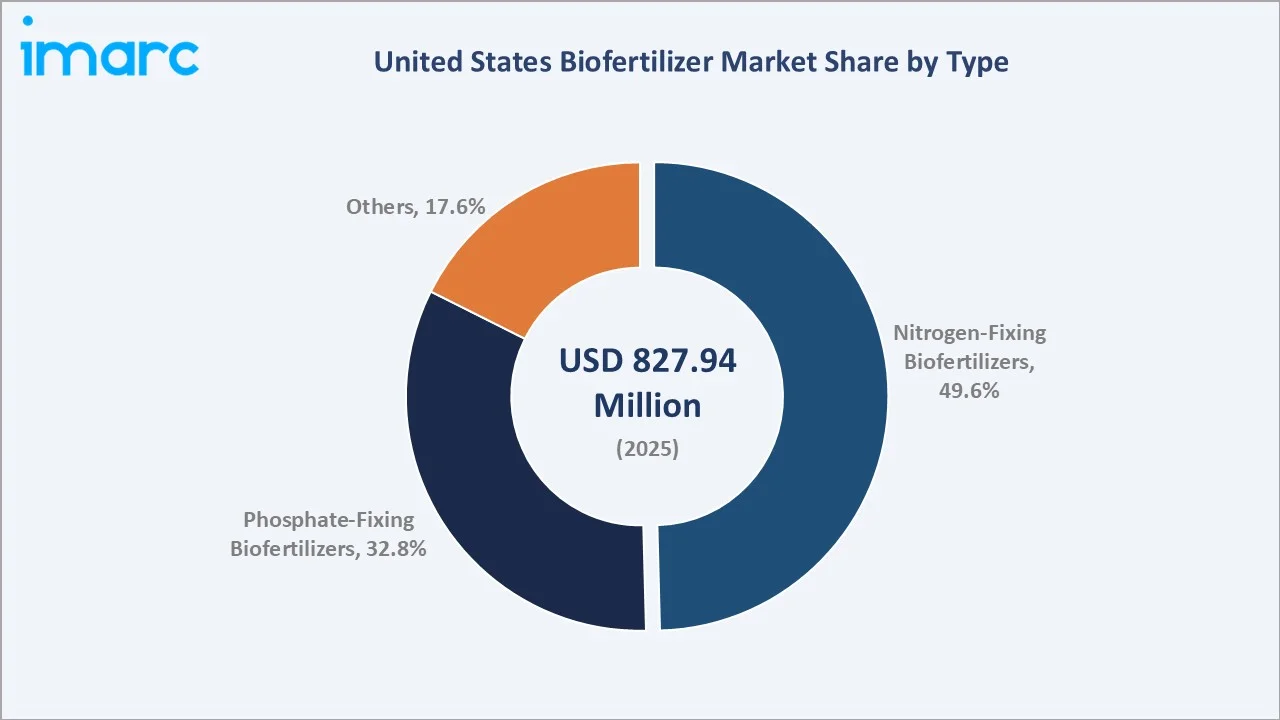
The United States biofertilizer market reached USD 827.94 Million in 2025 and is projected to reach USD 2,103.37 Million by 2034, growing at a CAGR of 10.92% during 2026-2034. The market is driven by increasing demand for sustainable agriculture, soil health improvement, and reduced reliance on chemical fertilizers. The U.S. Department of Agriculture allocated over $3 billion in FY2024 to support farmers and forest landowners in adopting voluntary conservation programs and climate-smart practices under the Investing in America agenda. This funding encourages the shift toward sustainable inputs, accelerating the adoption of biofertilizers. Nitrogen-fixing biofertilizers lead at 49.6% type share. Seed treatment dominates application at 46.2%. The Midwest commands 34.8% of market revenues.
Market Snapshot
|
Metric |
Value |
|
Market Size (2025) |
USD 827.94 Million |
|
Forecast Market Size (2034) |
USD 2,103.37 Million |
|
CAGR (2026-2034) |
10.92% |
|
Base Year |
2025 |
|
Historical Period |
2020-2025 |
|
Forecast Period |
2026-2034 |
|
Largest Type |
Nitrogen-Fixing Biofertilizers (49.6%, 2025) |
|
Dominant Application |
Seed Treatment (46.2%, 2025) |
|
Leading Region |
Midwest (34.8%, 2025) |
The market grew from USD 493.12 Million in 2020 to USD 827.94 Million in 2025, anchored at USD 1,390.11 Million in 2030, and forecast to reach USD 2,103.37 Million by 2034. The synthetic fertilizer price crisis permanently elevated US farmers' economic interest in biological alternatives, creating a structural market shift from biofertilizers being seen as specialty organic products to mainstream agricultural inputs across conventional row-crop farming systems.
To get more information on this market, Request Sample
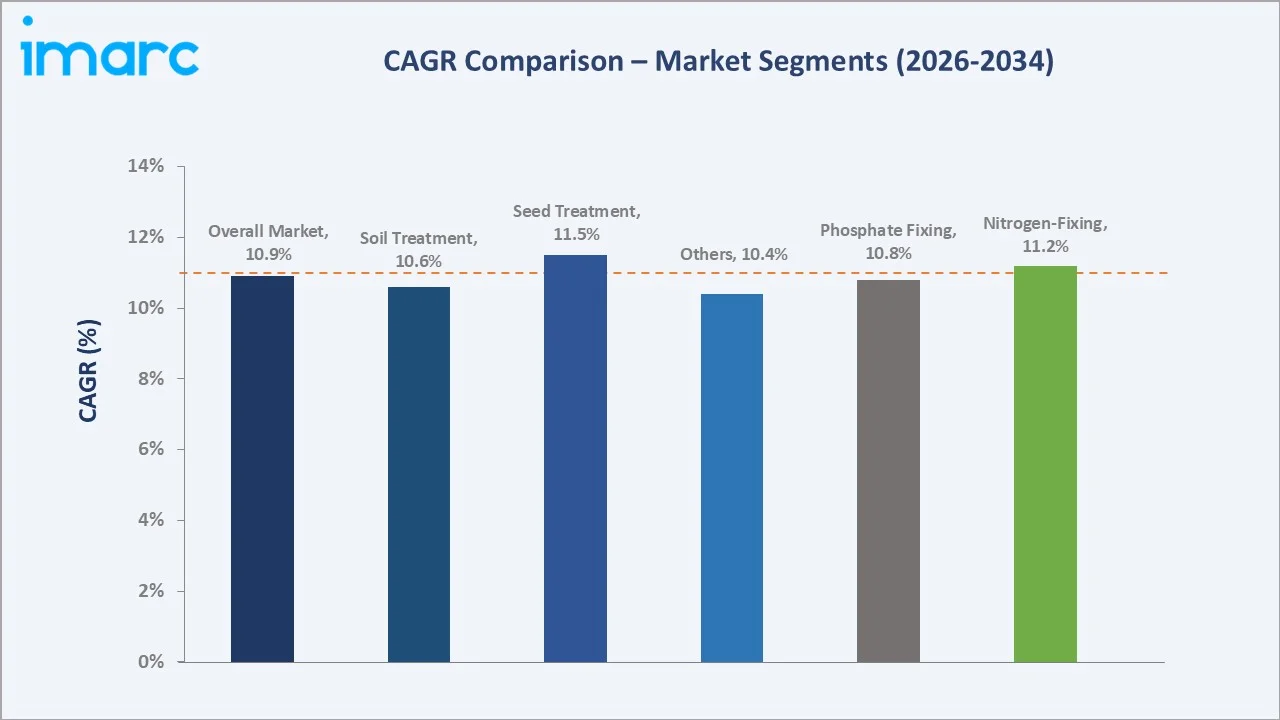
Seed treatment grows fastest at ~11.5% CAGR (2026-2034), driven by the precision delivery advantages of coating biofertilizer microorganisms directly onto seeds, placing biological inoculants at the exact root zone interface where nitrogen fixation and phosphate solubilization occur. Nitrogen-fixing biofertilizers grow at ~11.2% CAGR, outpacing phosphate-fixing at ~10.8%, reflecting the greater economic value of nitrogen replacement as the highest-cost conventional crop input.
Executive Summary
The United States biofertilizer market reached USD 827.94 Million in 2025, representing one of the fastest-growing agricultural biologicals segments, driven by the convergence of synthetic fertilizer cost pressure and the US organic food market creating premium-priced demand for certified biological inputs. The market is projected to reach USD 2,103.37 Million by 2034 at 10.92% CAGR.
Nitrogen-fixing biofertilizers command 49.6% market share (2025), led by Rhizobium-based soybean inoculants, Azospirillum inoculants for corn and wheat, and next-generation products. Seed treatment at 46.2% reflects precision agronomic delivery advantages. The Midwest at 34.8% leads through its concentration of US corn-soy row crop production.
Key Market Insights
|
Insight |
Data |
|
Largest Type |
Nitrogen-Fixing - 49.6% share (2025) |
|
Leading Application Mode |
Seed Treatment - 46.2% share (2025) |
|
Dominant Region |
Midwest - 34.8% market share (2025) |
Key Analytical Observations Supporting the Above Data:
- Nitrogen-Fixing Biofertilizers at 49.6% anchored by soybean inoculant as the US's most commercially established biofertilizer: Rhizobium inoculants applied to soybean seed before planting is the oldest commercially deployed biofertilizer technology, with most of the US soybean acres receiving inoculant treatment annually.
- Seed Treatment at 46.2% offering precision delivery advantages for commercial row-crop farming: Coating biofertilizer microorganisms directly onto crop seeds using polymer binders and protective adjuvants places biological inoculants at the precise root-soil interface where nutrient mobilization activity is most beneficial.
- Midwest at 34.8% anchored by soybean acres and Climate-Smart program concentration: The Corn Belt states concentrate most of the US corn and US soybean acreage, the primary biofertilizer target crops.
United States Biofertilizer Market Overview
The United States biofertilizer market encompasses all microbial-based biological fertilizer products that enhance crop nutrient availability through nitrogen fixation, phosphate solubilization, potassium mobilization, and plant growth-promoting rhizobacteria activity. Products include Rhizobium and Bradyrhizobium nitrogen inoculants for legumes, Azospirillum and Azotobacter free-living nitrogen fixers for cereals, phosphate-solubilizing bacteria (Bacillus megaterium, Pseudomonas fluorescens), arbuscular mycorrhizal fungi (AMF), and potassium-mobilizing biofertilizers.
The ecosystem integrates university microbial strain research, commercial fermentation and formulation manufacturers, regulatory oversight, agricultural distributor networks, and US farms applying biofertilizers across corn, soybean, cotton, vegetables, and specialty crops. Macroeconomic factors include increasing consumer demand for organic and sustainably grown food, rising environmental awareness, and government policies promoting sustainable agricultural practices.
Market Dynamics
To evaluate market opportunities, Request Sample
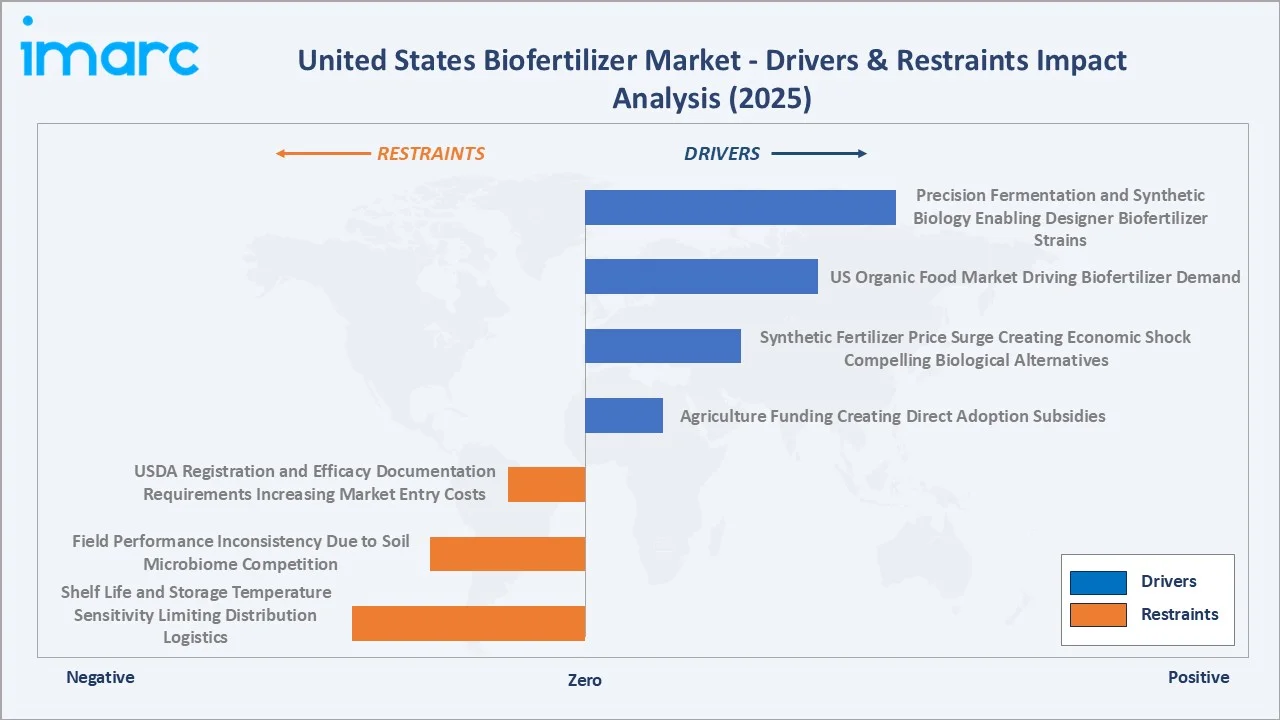
Market Drivers
- Agriculture Funding Creating Direct Adoption Subsidies: The U.S. Department of Agriculture allocated over $3 billion in FY2024 to support farmers and forest landowners in adopting voluntary conservation programs and climate-smart practices under the Investing in America agenda. Biofertilizer use reduces on-farm synthetic nitrogen application, directly lowering agriculture's N2O greenhouse gas emissions.
- Synthetic Fertilizer Price Surge Creating Economic Shock Compelling Biological Alternatives: Global nitrogen fertilizer prices surged between 2020 and early 2022 due to natural gas price escalation and supply chain disruptions. While prices partially normalized post-2022, they remained above pre-2020 levels through 2025, permanently elevating farmers' economic interest in biological nitrogen replacement.
- US Organic Food Market Driving Biofertilizer Demand: The US organic food market is growing, with organic premiums of 20-50% over conventional products. Organic corn and organic soybeans generate premium revenues that more than offset biofertilizer input costs, creating the strongest per-acre ROI case for biofertilizer investment in the US market.
Market Restraints
- Shelf Life and Storage Temperature Sensitivity Limiting Distribution Logistics: Living microbial biofertilizer formulations, such as peat-based, liquid, and granular carriers all containing viable microorganism populations, typically have shorter shelf lives at 2-8°C storage temperature, versus conventional chemical fertilizers at ambient temperature. This logistics constraint creates quality consistency risks that conventional fertilizer competitors do not face and requires significant supply chain investment from biofertilizer manufacturers.
- Field Performance Inconsistency Due to Soil Microbiome Competition and Environmental Variability: Biofertilizer efficacy varies significantly across the highly diverse US soil types and climate zones, from humid Midwest to arid Southwest. Indigenous soil microbial communities in high-organic-matter Corn Belt soils can outcompete introduced Rhizobium strains, reducing inoculant efficacy on fields with established native nitrogen-fixing populations.
Market Opportunities
- Precision Fermentation and Synthetic Biology Enabling Designer Biofertilizer Strains: Emerging synthetic biology platforms are enabling the design of biofertilizer microorganisms with enhanced nitrogen fixation capacity, improved stress tolerance, and competitive colonization advantages over native soil bacteria. These next-generation strains are commercializing at premium prices that reflect their superior agronomic performance.
- Biofertilizer-Carbon Credit Stacking Creating Self-Funding Adoption Programs: Biofertilizer-carbon credit stacking enables farmers to earn carbon credits through sustainable practices, making biofertilizer adoption self-financing. This incentivizes farmers to switch to biofertilizers by offsetting costs through the sale of carbon credits, thus driving wider adoption of eco-friendly farming practices and boosting market growth.
Market Challenges
- USDA Registration and Efficacy Documentation Requirements Increasing Market Entry Costs: Biofertilizer products sold in the US must navigate complex multi-layer registration requirements. The combined registration process costs high and takes 18-36 months per product, creating significant barriers for small-scale US biofertilizer innovators and limiting the pace of new product commercialization versus the biological innovation pipeline.
- Compatibility Challenges with Conventional Seed Treatment Fungicides and Insecticides: The conventional US seed treatment market applies fungicides and nematicides to most of the corn and soybean seed before biofertilizer inoculant application. These synthetic seed treatment chemicals can reduce biofertilizer microbial viability when co-applied without proper formulation protection.
Emerging Market Trends
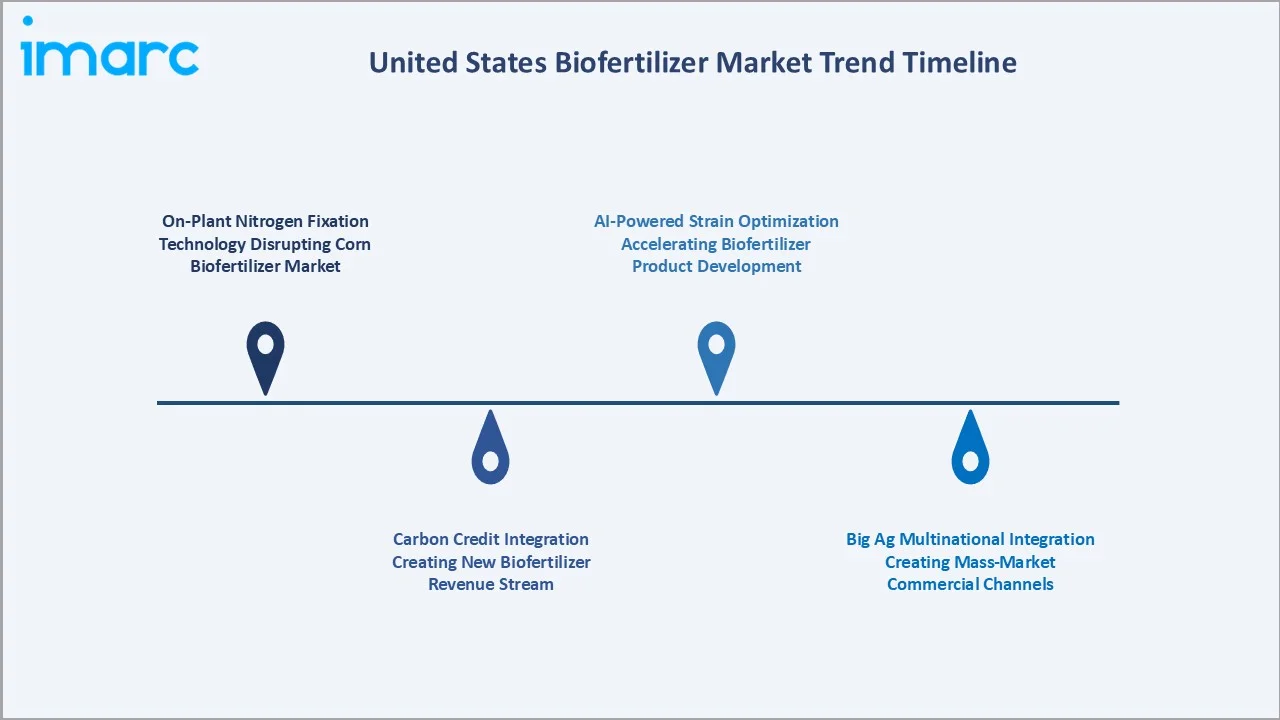
1. On-Plant Nitrogen Fixation Technology Disrupting Corn Biofertilizer Market
On-plant nitrogen fixation technology is disrupting the US biofertilizer market by offering a sustainable solution to enhance corn yields through natural nitrogen fixation, reducing reliance on synthetic fertilizers. This innovation is driving growth in the corn biofertilizer segment by improving crop productivity and soil health while lowering input costs and environmental impact.
2. Carbon Credit Integration Creating New Biofertilizer Revenue Stream
Carbon credit integration is creating a new revenue stream for the US biofertilizer market by allowing farmers to earn credits for adopting sustainable practices like using biofertilizers that reduce carbon emissions. This incentivizes the adoption of eco-friendly fertilizers, enhancing market growth as farmers generate additional income while contributing to climate goals.
3. Big Ag Multinational Integration Creating Mass-Market Commercial Channels
Big agricultural multinationals integrating biofertilizers into their portfolios are creating mass-market commercial channels by leveraging their extensive distribution networks and customer bases. This trend is accelerating the widespread adoption of biofertilizers, making them more accessible to large-scale farmers and driving significant growth in the market.
4. AI-Powered Strain Optimization Accelerating Biofertilizer Product Development
AI-powered strain optimization is accelerating biofertilizer product development by using machine learning to identify and enhance the most effective microbial strains for nutrient delivery and soil health. This technology speeds up the innovation process, leading to more efficient, tailored biofertilizer solutions that meet specific crop and environmental needs, driving growth in the market.
Industry Value Chain Analysis
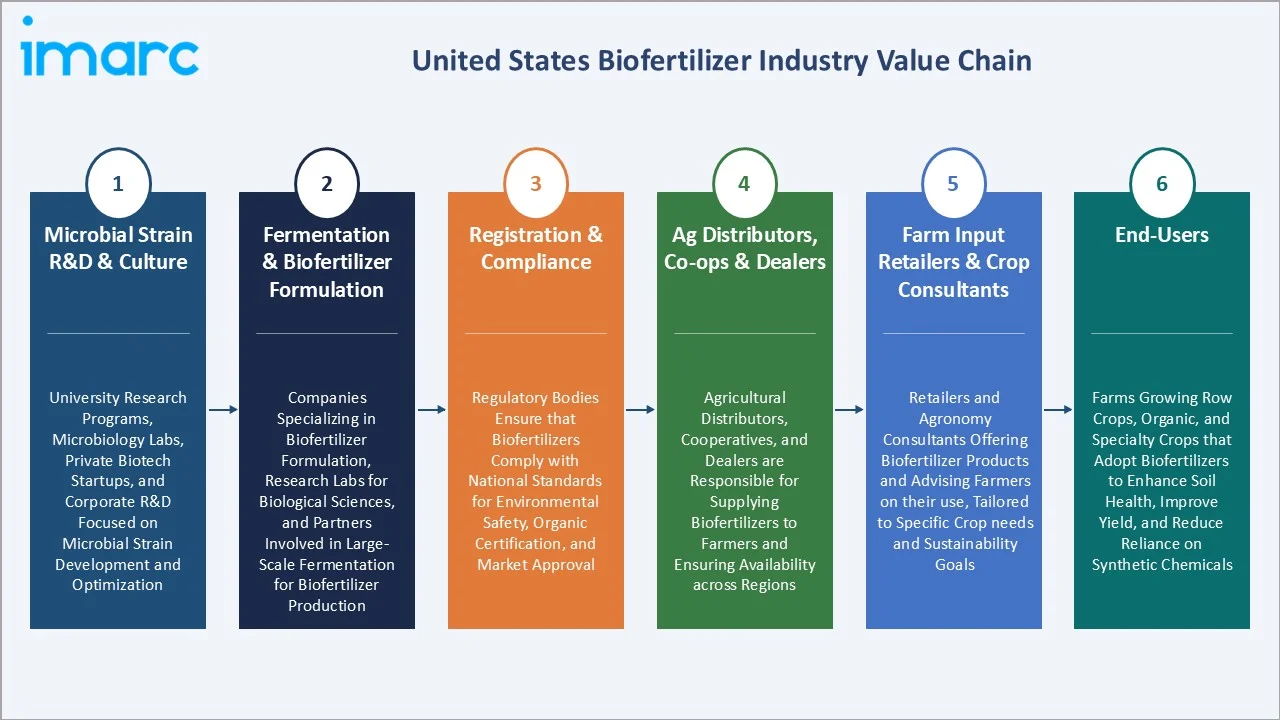
The US biofertilizer value chain integrates microbial research and strain development through fermentation, formulation, regulatory approval, agricultural distribution, and farm application, serving US crop acres. Biofertilizer manufacturers capture 35-55% gross margins on premium strain products; distributors earn 15-25% margins; crop consultants earn 8-15% recommendation fees.
|
Stage |
Key Participants |
|
Microbial Strain R&D & Culture |
University research programs, microbiology labs, private biotech startups, and corporate R&D focused on microbial strain development and optimization |
|
Fermentation & Biofertilizer Formulation |
Companies specializing in biofertilizer formulation, research labs for biological sciences, and partners involved in large-scale fermentation for biofertilizer production |
|
Registration & Compliance |
Regulatory bodies ensure that biofertilizers comply with national standards for environmental safety, organic certification, and market approval |
|
Ag Distributors, Co-ops & Dealers |
Agricultural distributors, cooperatives, and dealers are responsible for supplying biofertilizers to farmers and ensuring availability across regions |
|
Farm Input Retailers & Crop Consultants |
Retailers and agronomy consultants offering biofertilizer products and advising farmers on their use, tailored to specific crop needs and sustainability goals |
|
End-Users |
Farms growing row crops, organic, and specialty crops that adopt biofertilizers to enhance soil health, improve yield, and reduce reliance on synthetic chemicals |
The conventional agricultural distribution network is increasingly critical to biofertilizer market growth, as these distributors reach the conventional row-crop farmers who represent biofertilizer's largest expansion opportunity beyond established organic farm markets. Biofertilizer manufacturers' ability to secure preferred product status and sales force training commitments from these mainstream distributors is a key competitive differentiator.
Technology Landscape in the United States Biofertilizer Industry
Genomic Editing for Enhanced Nitrogen Fixation
Genomic editing for enhanced nitrogen fixation enables the development of microbes that can more efficiently fix nitrogen from the atmosphere. This technology reduces the need for synthetic nitrogen fertilizers, improves soil health, and boosts crop yields, creating opportunities for biofertilizer innovation and expanding sustainable farming practices.
AI-Powered Microbial Screening and Consortia Design
AI-powered microbial screening and consortia design are transforming the market by using machine learning to identify and optimize the most effective microbial strains for specific crops and soil conditions. This technology accelerates the development of tailored biofertilizer products, enhances nutrient efficiency, and drives more sustainable agricultural practices, further expanding the market for bio-based fertilizers.
Polymer Encapsulation and Extended Shelf-Life Formulation
Polymer encapsulation and extended shelf-life formulation protect microbial organisms from environmental stress, enhancing their stability and effectiveness over time. This innovation allows for longer storage and more consistent performance, expanding the use of biofertilizers in various agricultural settings and improving their commercial viability.
Market Segmentation Analysis
The report covers the following segments:
| Segment Category | Leading Segment | Market Share | Year |
|---|---|---|---|
| Type | Nitrogen-Fixing Biofertilizers | 49.6% | 2025 |
| Crop | Cereals and Grains | 🔒 | 2025 |
| Microorganism | Cyanobacter | 🔒 | 2025 |
| Mode of Application | Seed Treatment | 46.2% | 2025 |
| Region | Midwest | 34.8% | 2025 |

By Type
Nitrogen-fixing biofertilizers lead at 49.6% market share (2025). This segment encompasses Rhizobium/Bradyrhizobium soybean inoculants, Azospirillum lipoferum and brasilense inoculants for corn and wheat, free-living Azotobacter chroococcum products, and next-generation genetically optimized strains. Nitrogen replacement economic value creates the strongest economic case for biofertilizer investment across all US crop systems.
To access detailed market analysis, Request Sample
Phosphate-fixing biofertilizers at 32.8% include PSB (Bacillus megaterium, Pseudomonas fluorescens) and AMF mycorrhizal biofertilizers serving specialty crop, organic, and row-crop markets. The segment grows at ~10.8% CAGR (2026-2034), driven by specialty crop growers' documented phosphorus uptake efficiency improvements from mycorrhizal inoculation. Others at 17.6% encompasses potassium-mobilizing biofertilizers, zinc-solubilizing bacteria, and PGPR products with multiple nutrient mobilization activities.
By Mode of Application
Seed treatment leads at 46.2% market share (2025). Liquid peat slurry, polymer film coating, and dry powder seed treatment formulations apply biofertilizer microorganisms directly to individual seeds at central processing facilities or on-farm before planting. Commercial seed treatment applicators can treat with precise biofertilizer dose rates, integrating seamlessly into existing seed treatment workflows.
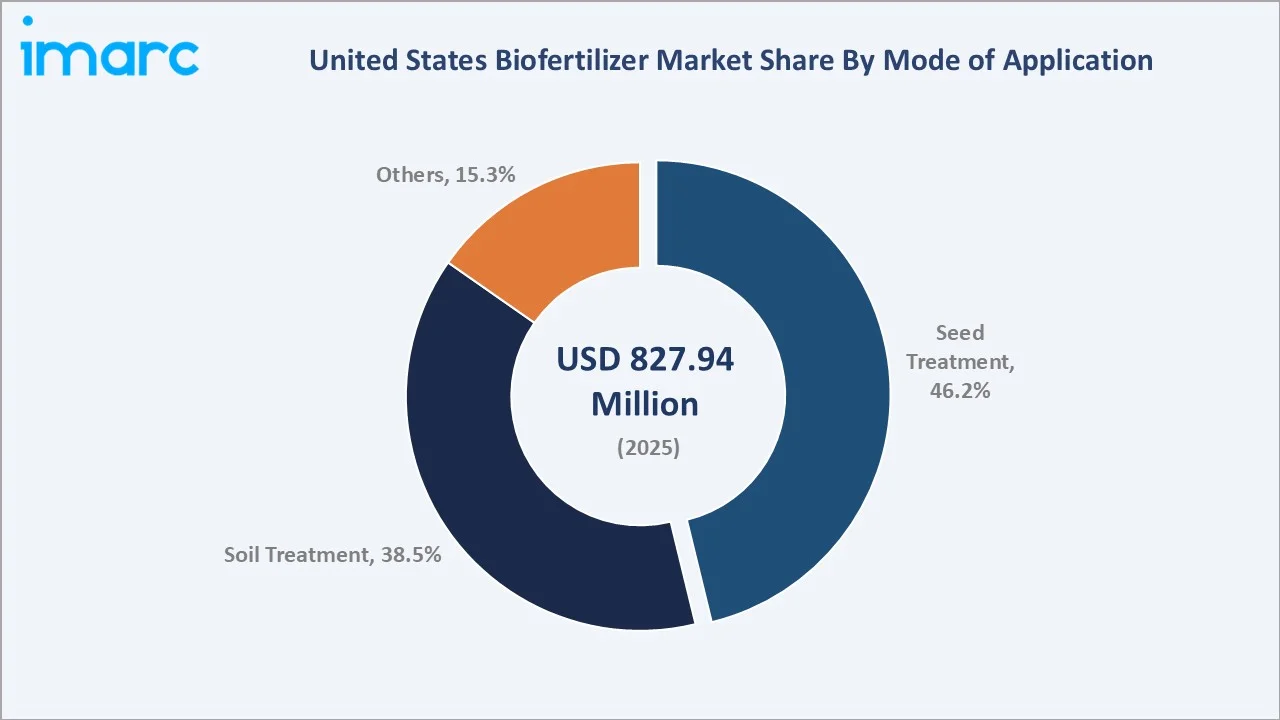
Soil treatment at 38.5% encompasses granular biofertilizer in-furrow application, fertigation through drip irrigation systems, and broadcast liquid biofertilizer incorporated before planting. Soil treatment biofertilizers grow at ~10.6% CAGR, driven by California's precision drip irrigation infrastructure and organic vegetable operations requiring soil-applied mycorrhizal inoculants. Others at 15.3% includes foliar biofertilizer spray applications and transplant dipping, particularly for greenhouse, nursery, and transplanted vegetable production.
Regional Market Insights
|
Region |
Share (2025) |
Key Growth Drivers & Characteristics |
|
Midwest |
34.8% |
Dominated by large row-crop production, with a significant portion of the U.S. corn and soybean acreage. High adoption of nitrogen-fixing biofertilizers, particularly in the agricultural belt. |
|
South |
27.6% |
Large agricultural base, especially in crops like rice, cotton, and soybeans. Growing adoption of biological fertilizers. Increasing interest in organic and sustainable farming practices. |
|
West |
20.9% |
Home to a diverse range of crops, including specialty crops like fruits, vegetables, and wine grapes. High adoption of mycorrhizal and phosphate-solubilizing biofertilizers. |
|
Northeast |
16.7% |
Strong demand for organic farming. Focus on soil health and sustainability, with increasing use of biofertilizers in specialty crops like seeds and grass. |
The Midwest's 34.8% dominance is structurally reinforced by the convergence of the US's three most important biofertilizer drivers in a single geographic region: the world's largest soybean crop requiring Rhizobium inoculation; the highest concentration of climate-smart practice payments flowing to Corn Belt row-crop farmers adopting biological nitrogen reduction; and the nation's most extensive land-grant university agronomic extension network providing scientifically credible biofertilizer adoption support directly to farm operators.
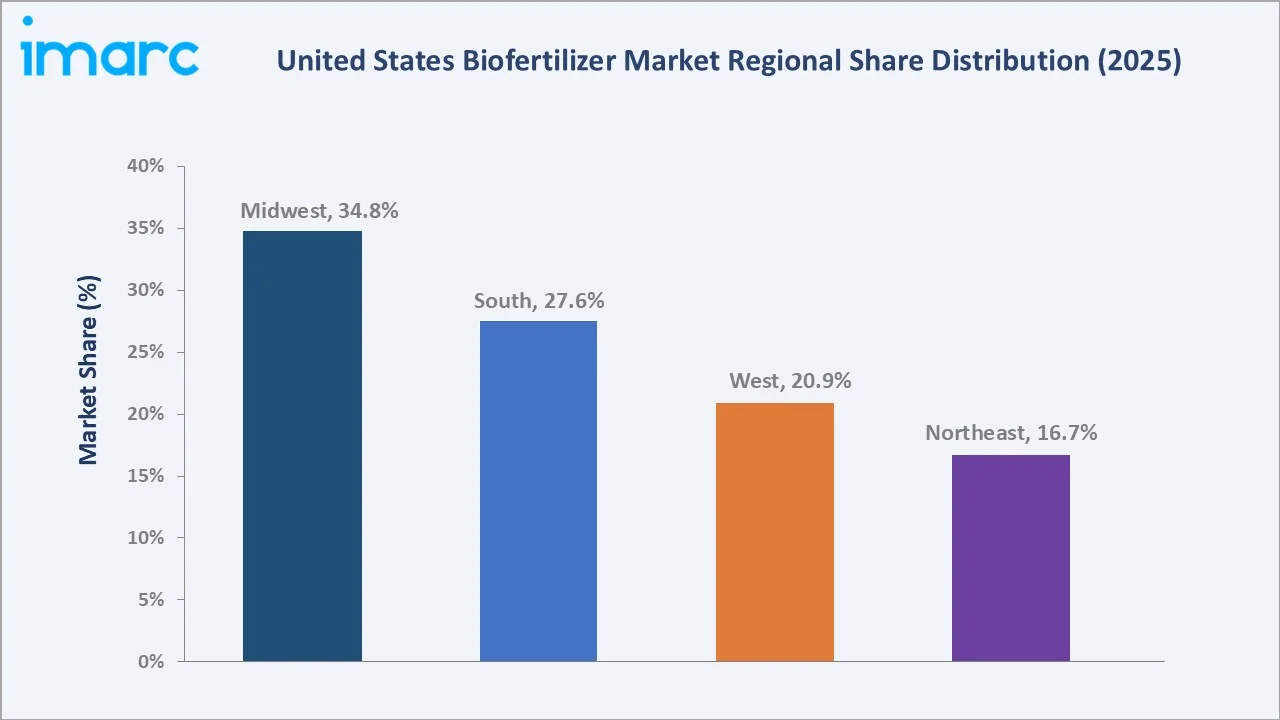
The South's 27.6% reflects Texas's large sorghum and cotton biofertilizer market and the Southeast's premium-priced organic vegetable markets in Florida and Georgia, driving high-value biofertilizer adoption. The West's 20.9% is dominated by California, home to certified organic farms and the US's most intensive specialty crop production, requiring premium biological input solutions.
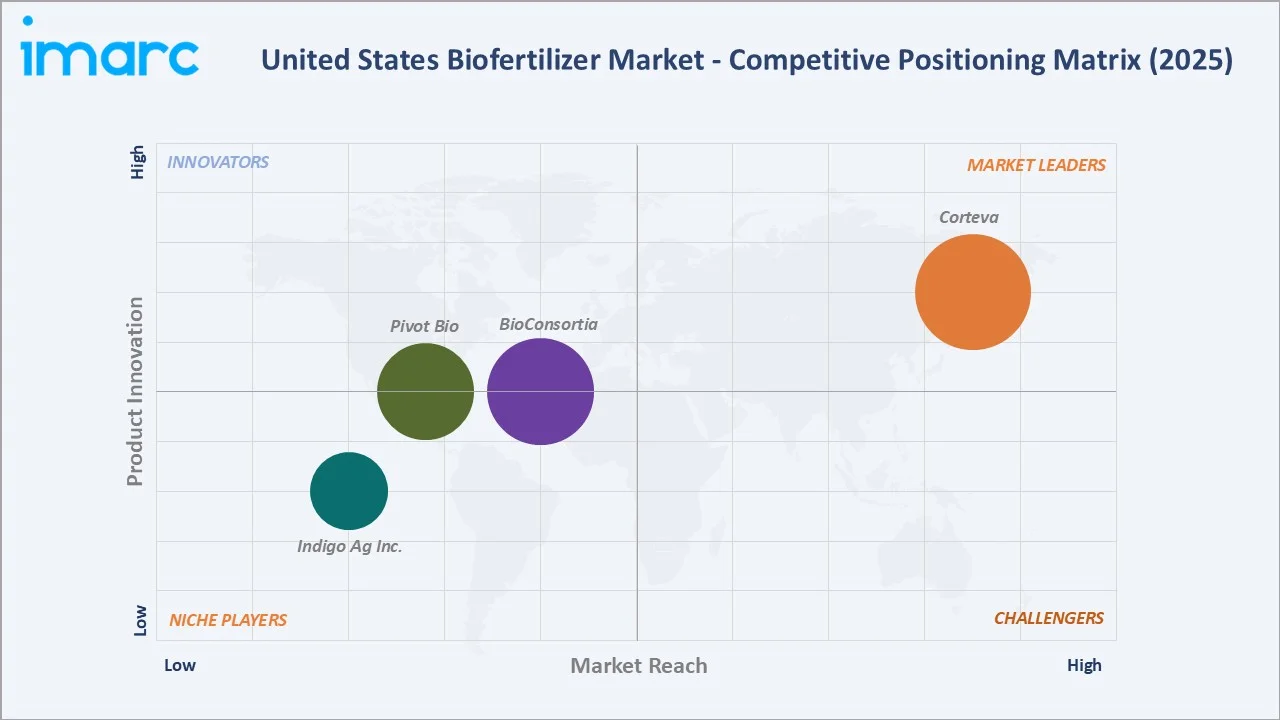
Competitive Landscape
The United States biofertilizer market is moderately concentrated at the multinational agricultural company level. Corteva, BioConsortia, and Pivot Bio together capture approximately 45-50% of US biofertilizer revenues (2025) through their integrated seed treatment biological programs and mainstream agricultural distribution networks. The market fragments significantly in specialty segments, organic biofertilizers, mycorrhizal products, and next-generation nitrogen fixation, where innovation differentiation enables premium positioning.
|
Company Name |
Brand |
Market Position |
Core Strength |
|
Corteva |
Pioneer, Utrisha N |
Market Leader |
Pioneer brand inoculant technologies are designed to maximize feed performance by optimizing the desirable traits of your forages. |
|
BioConsortia |
N-POWER |
Established Player |
BioConsortia develops crop protection and nurturing products based on beneficial microbes identified and enhanced through its proprietary R&D platform. |
|
Pivot Bio |
PROVEN, RETURN, RETAIN, CERT-N |
Established Player |
Pivot Bio is dedicated to supporting farmers with products that optimize crop production through specifically timed and placed nitrogen delivery. |
|
Indigo Ag Inc. |
biotrinsic |
Niche Player |
Indigo Ag's portfolio encompasses a range of plant benefits, all resulting in more reliable plant performance under biotic and abiotic stress, meaning more farm profitability. |
Pivot Bio's commercial validation of genomically optimized nitrogen fixation in corn represents the US biofertilizer market's most commercially significant competitive disruption. Pivot Bio's performance superiority versus traditional Azospirillum inoculants is creating a bifurcated competitive landscape where conventional inoculants compete on price and distribution while next-generation products compete on documented agronomic performance and carbon credit-linked value propositions.
Key Company Profiles
Corteva
Corteva is the US biofertilizer market's most strategically significant participant, integrating biological nitrogen fixation into Pioneer seed brands.
- Brands: Pioneer, Utrisha N
- Recent Developments: In March 2024, Corteva launched Corteva Catalyst, a new investment and partnership platform focused on accessing and bringing to market agricultural innovations that advance the company’s R&D priorities and drive value creation.
- Strategic Focus: Integration of biofertilizers into Pioneer seed franchise, creating biofertilizer-as-standard commercial norm for Corteva's US corn acres.
Pivot Bio
Pivot Bio is the US biofertilizer market's most commercially disruptive company, delivering the industry's highest-documented nitrogen replacement value through its genomically optimized PROVEN product.
- Brands: PROVEN, RETURN, RETAIN, CERT-N.
- Recent Developments: In March 2026, Pivot Bio unveiled RETAIN Dry, a new planter box treatment designed to help sorghum growers seamlessly integrate Pivot Bio’s advanced nitrogen-fixing microbial technology into their crop nutrition strategies.
- Strategic Focus: PROVEN as the market-leading corn nitrogen biofertilizer through superior performance documentation.
Market Concentration Analysis
The United States biofertilizer market exhibits moderate concentration at the commercial distribution level and high fragmentation at the product innovation level. Corteva, BioConsortia, and Pivot Bio together capture approximately 45-50% of the US biofertilizer revenues (2025) through their integration of biological inoculants into mainstream seed treatment programs serving conventional row-crop farmers. However, in the innovation tier, startups are capturing disproportionate investment and market attention.
The market exhibits a clear bifurcation between commodity Rhizobium inoculants and premium next-generation products. This premiumization dynamic is accelerating total market value growth above volume growth. Venture capital investment in US biofertilizer startups, with follow-on acquisitions of venture-backed companies expected as multinational ag companies seek to access next-generation nitrogen fixation technologies to compete with Pivot Bio's commercial traction.
Investment & Growth Opportunities
Fastest Growing Segments
Seed treatment (~11.5% CAGR), nitrogen-fixing biofertilizers (~11.2% CAGR), next-generation genomically optimized nitrogen fixation (~35%+ CAGR from Pivot Bio base), biofertilizer-linked carbon credit programs (~25% CAGR), and AMF mycorrhizal specialty crop products (~15% CAGR) represent the US biofertilizer market's highest-growth investment vectors through 2034.
Emerging Market Opportunities
The US's non-organic corn acres represent biofertilizer's largest untapped adoption potential. Reducing the average US corn nitrogen application from 150 lbs to 125 lbs through biofertilizer supplementation across the country would generate high demand for annual biofertilizer product demand.
Investment Themes
- Next-generation nitrogen fixation strain development: Pivot Bio's genomic editing approach for corn nitrogen fixation is commercially validated but still represents less than 5% of US corn acres. Investment in competitive strain development, for sorghum, wheat, cotton, rice, and specialty crops where on-plant nitrogen fixation technology is nascent, creates large addressable markets for second-mover next-generation nitrogen fixation products.
- Biofertilizer-carbon credit integrated programs: The convergence of biofertilizer adoption with voluntary carbon credit revenues creates a multi-revenue stacking structure that can make biofertilizer adoption self-funding for US farmers. Platform companies integrating biofertilizer recommendation, application verification, and carbon credit monetization represent the highest-value commercial model in the US biofertilizer ecosystem.
Future Market Outlook (2026-2034)
The United States biofertilizer market is projected to grow from USD 827.94 Million in 2025 to USD 2,103.37 Million by 2034, delivering a 10.92% CAGR over the forecast period. The market's anchor value of USD 1,390.11 Million in 2030 reflects a fundamentally transformed US agricultural input landscape, where biological nitrogen and phosphate products have transitioned from specialty organic inputs to mainstream agricultural inputs used on US commercial row-crop acres, supported by a multi-billion-dollar federal climate-smart agriculture subsidy structure and validated by Pivot Bio's commercial demonstration of economically compelling on-plant nitrogen fixation.
Three structural forces define the US biofertilizer market's trajectory with high predictability through 2034: the synthetic fertilizer cost base permanently elevated, creating enduring economic pressure on nitrogen input cost reduction; climate-smart agriculture funding; and next-generation genomically optimized nitrogen fixation products achieving the agronomic performance threshold needed to justify adoption by evidence-based conventional farmers who require documented ROI before input substitution.
Research Methodology
Primary Research
Primary research comprised structured interviews with 70+ industry stakeholders (2025), including US agronomists from Iowa State University Extension, Purdue Cooperative Extension, and University of California Davis; biofertilizer product managers; USDA NRCS district conservationists managing EQIP climate-smart practice payment programs; Certified Crop Advisers from Iowa, Illinois, and Minnesota; and organic farm managers from California and Vermont.
Secondary Research
Secondary research encompassed USDA National Agricultural Statistics Service (NASS) crop production and input use surveys 2024, USDA EQIP practice code payment data 2024-2025, Organic Trade Association (OTA) US organic market report 2024, EPA FIFRA microbial pesticide registration database, USDA NOP approved materials list updates, venture capital investment databases for biofertilizer startup investment tracking, company annual reports and investor presentations, and university trial data aggregations from 2020-2025 Land Grant University systems. Over 120 secondary sources were reviewed.
Forecasting Models
Market revenue forecasts were developed using bottom-up crop-type x biofertilizer penetration rate x average revenue per acre models for nitrogen-fixing and phosphate-fixing segments, with mode of application split calibrated against commercial seed treatment adoption data and USDA EQIP program enrollment projections. Key inputs include USDA crop acreage projections, IRA conservation program spending schedules, carbon credit market price scenarios, Pivot Bio PROVEN adoption S-curve projections, and organic farm growth rates from USDA Organic Survey forward projections.
United States Biofertilizer Market Report Scope:
| Report Features | Details |
|---|---|
| Base Year of the Analysis | 2025 |
| Historical Period | 2020-2025 |
| Forecast Period | 2026-2034 |
| Units | Million USD |
| Scope of the Report |
Exploration of Historical Trends and Market Outlook, Industry Catalysts and Challenges, Segment-Wise Historical and Future Market Assessment:
|
| Types Covered | Nitrogen-Fixing Biofertilizers, Phosphate-Fixing Biofertilizers, Others |
| Crops Covered | Cereals and Grains, Pulses and Oilseeds, Fruits and Vegetables, Others |
| Microorganisms Covered | Cyanobacter, Rhizobium, Phosphate Solubilizing Bacteria, Azotobacter, Others |
| Mode of Applications Covered | Seed Treatment, Soil Treatment, Others |
| Regions Covered | Northeast, Midwest, South, West |
| Companies Covered | Corteva, BioConsortia, Pivot Bio, Indigo Ag Inc., etc. |
| Customization Scope | 10% Free Customization |
| Post-Sale Analyst Support | 10-12 Weeks |
| Delivery Format | PDF and Excel through Email (We can also provide the editable version of the report in PPT/Word format on special request) |
Key Benefits for Stakeholders:
- IMARC’s report offers a comprehensive quantitative analysis of various market segments, historical and current market trends, market forecasts, and dynamics of the United States biofertilizer market from 2020-2034.
- The research study provides the latest information on the market drivers, challenges, and opportunities in the United States biofertilizer market.
- Porter's Five Forces analysis assists stakeholders in assessing the impact of new entrants, competitive rivalry, supplier power, buyer power, and the threat of substitution. It helps stakeholders to analyze the level of competition within the United States biofertilizer industry and its attractiveness.
- Competitive landscape allows stakeholders to understand their competitive environment and provides an insight into the current positions of key players in the market.
Frequently Asked Questions About the United States Biofertilizer Market Report
The US biofertilizer market reached USD 827.94 Million in 2025, driven by soybean acres receiving Rhizobium inoculant, Pivot Bio PROVEN reaching high corn acres, and the US organic food market requiring biological inputs.
The market grows at 10.92% CAGR during 2026-2034, reaching USD 2,103.37 Million by 2034, driven by next-generation nitrogen fixation products, multinational integration into seed treatment programs, IRA cost-share subsidies, and carbon credit-biofertilizer revenue stacking.
Nitrogen-fixing biofertilizers lead at 49.6% (2025), anchored by Rhizobium soybean inoculant, Azospirillum corn inoculants, and Pivot Bio's next-generation on-plant nitrogen fixation technology.
Seed treatment leads at 46.2% (2025) and grows fastest at ~11.5% CAGR, driven by precision delivery advantages placing microorganisms at the root-soil interface, compatibility with commercial seed treatment equipment, and multinational seed companies integrating biological inoculants into seed treatment packages.
The Midwest leads at 34.8% (2025), anchored by soybean acres requiring Rhizobium inoculation, corn belt adoption of next-generation nitrogen fixation products, and land-grant university extension agronomist biofertilizer recommendations.
Leading companies include Corteva, BioConsortia, Pivot Bio, and Indigo Ag Inc., among others.
The market is projected to reach approximately USD 1,390.11 Million by 2030, with Pivot Bio PROVEN reaching most of the US corn acres, biofertilizer-carbon credit programs, and multinational seed treatment integration reaching most of the acres.
Pivot Bio PROVEN uses genomically optimized Rhodopseudomonas palustris applied to corn seeds to deliver consistent on-plant nitrogen fixation.
Global synthetic nitrogen prices surged 200% between 2020 and 2022, making biofertilizer nitrogen replacement economics compelling for conventional corn farmers.
Soybean, corn, specialty crops, and organic crops are the primary US biofertilizer market crops.
Need more help?
- Speak to our experienced analysts for insights on the current market scenarios.
- Include additional segments and countries to customize the report as per your requirement.
- Gain an unparalleled competitive advantage in your domain by understanding how to utilize the report and positively impacting your operations and revenue.
- For further assistance, please connect with our analysts.
 Request Customization
 Speak to an Analyst
 Request Brochure
 Inquire Before Buying
Benefits of Customization
- Personalize this research
- Triangulate with your data
- Get data as per your format and definition
- Gain a deeper dive into a specific application, geography, customer, or competitor
- Any level of personalization
Get in Touch With Us
UNITED STATES
Phone: +1-201-971-6302
INDIA
Phone: +91-120-433-0800
UNITED KINGDOM
Phone: +44-753-714-6104
Email: [email protected]
Client Testimonials


.webp)


