
United States Bus Market Size, Share, Trends and Forecast by Type, Fuel Type, Seat Capacity, Application, and Region, 2026-2034
United States Bus Market Summary:
The United States bus market size was valued at USD 13,835.98 Million in 2025 and is projected to reach USD 20,994.85 Million by 2034, growing at a compound annual growth rate of 4.74% from 2026-2034. The market is driven by accelerating fleet electrification initiatives, expanding public transportation infrastructure, and robust federal funding programs supporting zero-emission vehicle adoption. Rising urbanization patterns and enhanced interstate connectivity requirements propel demand for modern bus configurations. Technological integration including advanced driver assistance systems, telematics platforms, and passenger connectivity features transform fleet modernization strategies. School transportation electrification programs and metropolitan transit system upgrades contribute significantly.
Key Takeaways and Insights:
- By Type: Single deck dominates the market with a share of 92.8% in 2025, driven by extensive deployment across interstate networks and regional routes, offering operational versatility, terrain flexibility, and infrastructure compatibility driving sustained transit agency adoption.
- By Fuel Type: Diesel leads the market with a share of 43% in 2025, owing to established refueling infrastructure, proven reliability, extended range capabilities, and cost-effective maintenance frameworks, maintaining operator preference despite accelerating electrification trends across transportation sectors.
- By Seat Capacity: 31-50 seats represent the largest segment with a market share of 55% in 2025, driven by balancing operational efficiency with passenger accommodation, effectively serving transit services, educational transportation, tourism applications, and maintaining urban maneuverability advantages.
- By Application: Transit bus dominates the market with a share of 60% in 2025, owing to metropolitan authority deployments and suburban networks, driven by urban mobility requirements, congestion mitigation strategies, and sustainable transportation mandates.
- Key Players: The market shows moderate competition, with established manufacturers maintaining production and dealer networks, while emerging EV specialists focus on battery-electric technologies, integrated charging solutions, and innovation in compliance and distribution systems. Some of the key players operating in the market include AB Volvo, Blue Bird Corporation, BYD Co. Ltd., Gillig LLC, GreenPower Motor Company Inc., NFI Group Inc., and The Lion Electric Company.
The United States bus market experiences robust expansion propelled by unprecedented federal funding allocations supporting fleet modernization and zero-emission vehicle transition programs. According to reports, in November 2025, the Federal Transit Administration awarded $2 Billion to 165 transit systems nationwide to modernize infrastructure and add approximately 2,400 new buses, strengthening service reliability and clean transit efforts. Moreover, infrastructure investment legislation channels substantial capital toward public transportation enhancement, enabling transit agencies to replace aging diesel fleets with advanced propulsion technologies. Environmental consciousness drives regulatory frameworks mandating emissions reductions, particularly in metropolitan areas facing air quality challenges. Educational institutions prioritize student safety and environmental stewardship through bus fleet electrification initiatives. Highway infrastructure revitalization projects enhance interstate connectivity, stimulating intercity and regional bus service expansion. Technological innovation incorporating autonomous driving capabilities, advanced safety systems, and passenger amenities elevates operational efficiency while improving user experience. Demographic shifts toward urban concentration intensify public transportation demand, necessitating capacity expansion across metropolitan transit networks throughout the nation.
United States Bus Market Trends:
Fleet Electrification Acceleration and Infrastructure Development
Transportation agencies across diverse jurisdictions are transitioning toward battery-electric and hydrogen fuel cell technologies at unprecedented rates, fundamentally transforming fleet composition strategies. As per sources, in 2025, the Central Midlands Regional Transit Authority (The COMET) deployed two battery‑electric and two hydrogen fuel cell buses funded by a $2.9 Million FTA grant, integrating them into daily service as part of its sustainable transit initiative. Furthermore, this shift encompasses not merely vehicle procurement but comprehensive ecosystem development including charging infrastructure deployment, grid integration solutions, and energy management platforms. Transit authorities collaborate with utility providers to establish depot-based charging facilities while exploring vehicle-to-grid applications that generate ancillary revenue streams. Educational institutions leverage federal grant programs to replace traditional diesel school buses with zero-emission alternatives, simultaneously addressing environmental goals and operational cost reduction objectives.
Advanced Technology Integration and Connected Fleet Management
Modern bus platforms increasingly incorporate sophisticated telematics systems, artificial intelligence-driven route optimization algorithms, and predictive maintenance capabilities that revolutionize fleet operations management. According to reports, New York City Transit’s bus fleet was recognized with a Special Recognition distinction at the UITP Awards for using Preteckt’s AI‑powered predictive maintenance across more than 1,500 buses, significantly boosting reliability and reducing service disruptions. Moreover, real-time vehicle diagnostics enable proactive maintenance scheduling, reducing unexpected breakdowns and improving service reliability. Passenger information systems provide dynamic routing updates, estimated arrival times, and capacity information through mobile applications and digital displays. Advanced driver assistance technologies including collision avoidance systems, lane departure warnings, and pedestrian detection enhance safety performance while reducing insurance costs.
Sustainable Transportation Policies and Regulatory Framework Evolution
Legislative mandates and regulatory requirements increasingly prioritize emissions reduction, environmental sustainability, and climate action goals throughout federal, state, and municipal jurisdictions. As per sources, in June 2025, California awarded $500 Million to 133 educational agencies for 1,000 electric school buses and charging infrastructure under the ZESBI program, prioritizing rural and disadvantaged districts. Moreover, zero-emission vehicle purchase requirements establish definitive timelines for diesel phase-out, compelling transit agencies to accelerate electrification planning regardless of budget constraints. Carbon neutrality commitments adopted by major metropolitan areas create market pull for clean transportation technologies. Environmental justice initiatives direct funding toward disadvantaged communities historically burdened by transportation-related air pollution, expanding electric bus deployment into previously underserved markets.
Market Outlook 2026-2034:
The United States bus market demonstrates robust growth driven by infrastructure investment, fleet electrification mandates, and capacity expansion. Revenue projections reflect sustained federal funding supporting zero-emission procurement alongside state initiatives. Technological advancements in battery systems and autonomous capabilities enhance value propositions while reducing costs. Transit agencies prioritize lifecycle cost optimization benefiting advanced propulsion technologies. School transportation modernization represents substantial opportunity as educational institutions replace aging fleets under favorable grant programs. The market generated a revenue of USD 13,835.98 Million in 2025 and is projected to reach a revenue of USD 20,994.85 Million by 2034, growing at a compound annual growth rate of 4.74% from 2026-2034.
United States Bus Market Report Segmentation:
|
Segment Category |
Leading Segment |
Market Share |
|
Type |
Single Deck |
92.8% |
|
Fuel Type |
Diesel |
43% |
|
Seat Capacity |
31-50 Seats |
55% |
|
Application |
Transit Bus |
60% |
Type Insights:
To get detailed analysis of this market, Request Sample
- Single Deck
- Double Deck
Single deck dominates with a market share of 92.8% of the total United States bus market in 2025.
Single deck configurations dominate through exceptional versatility addressing interstate, intercity, and urban transportation requirements nationwide. Their streamlined design facilitates operation on standard highway infrastructure without clearance restrictions constraining multi-story alternatives. As per sources, in 2025, San Francisco MTA ordered 42 New Flyer 40‑foot hybrid buses, part of New Flyer’s backlog, reinforcing single‑deck transit adoption in the city’s fleet. Further, manufacturing economies of scale reduce procurement costs while established maintenance protocols ensure service continuity. Accessibility features including low-floor boarding, wheelchair ramps, and mobility device spaces comply with federal disability requirements more efficiently. School transportation applications overwhelmingly favor single deck layouts enabling rapid student boarding and evacuation procedures essential for safety compliance.
Transit agencies appreciate standardized platform architecture supporting parts commonality across diverse fleet compositions, reducing inventory costs and maintenance complexity. Regional tour operators select single deck coaches for fuel efficiency advantages and driver familiarity benefits. Double deck configurations serve niche applications concentrated in high-capacity intercity corridors and premium tourism services. However, infrastructure limitations including bridge clearances, tunnel restrictions, and maintenance facility constraints restrict deployment opportunities. Consequently, single deck buses remain the overwhelmingly preferred choice within United States transportation landscape.
Fuel Type Insights:
- Diesel
- Electric and Hybrid
- Others
Diesel leads with a share of 43% of the total United States bus market in 2025.
Diesel maintains a substantial market position leveraging comprehensive refueling infrastructure spanning urban centers, suburban corridors, and rural regions nationwide. Mature technology delivers proven reliability across diverse operating conditions from extreme winter climates to intense summer heat. According to sources, NJ Transit approved a $500 Million fleet modernization to purchase 260 clean diesel buses and 26 battery-electric buses, reinforcing continued diesel reliance during large-scale replacement cycles. Moreover, extended operational range capabilities exceeding electric alternatives accommodate long-distance intercity routes and rural service areas lacking charging infrastructure. Fleet operators benefit from established maintenance expertise, readily available replacement parts, and predictable service costs supporting lifecycle planning and budgeting processes effectively.
Diesel in modern engines incorporate advanced emissions control technologies including selective catalytic reduction and diesel particulate filters meeting stringent environmental standards while maintaining performance characteristics. Biodiesel blend compatibility provides pathways toward reduced carbon intensity while preserving operational advantages. Purchase price benefits relative to electric alternatives appeal to budget-constrained agencies prioritizing immediate fleet replacement over lifecycle cost optimization. Despite accelerating electrification momentum, diesel maintains relevance through operational flexibility, infrastructure availability, and economic advantages across numerous transportation applications.
Seat Capacity Insights:
- 15-30 Seats
- 31-50 Seats
- More than 50 Seats
31-50 seats exhibit a clear dominance with a 55% share of the total United States bus market in 2025.
31-50 seats dominate market adoption through optimal balance between operational flexibility and passenger accommodation requirements across diverse transportation applications. School transportation services favor this capacity range, efficiently serving neighbourhood routes while maintaining manageable vehicle dimensions for residential street navigation. In May 2024, the U.S. EPA awarded nearly $900 Million to about 530 school districts to fund over 3,400 clean school buses nationwide, with 92 percent electric buses. Furthermore, transit agencies deploy these buses on suburban feeder routes, community circulators, and lower-density corridors where full-size coaches prove economically inefficient. Tour operators appreciate their versatility for corporate shuttles, hotel transfers, and small group excursions requiring flexible capacity solutions.
Manufacturing standardization concentrates product development resources within this segment, delivering competitive pricing through production volume economies and supply chain efficiencies. Operator familiarity with standard wheelbase dimensions facilitates driver training programs while parts commonality across manufacturers reduces inventory requirements and maintenance complexity. Accessibility features including wheelchair lifts and designated securement areas integrate seamlessly within standard floor plans meeting federal compliance requirements. This capacity range effectively balances passenger volume demands with operational maneuverability requirements across urban and suburban environments.
Application Insights:
- Transit Bus
- Intercity/Coaches
- Others
Transit bus leads with a market share of 60% of the total United States bus market in 2025.
Transit bus constitutes the dominant market segment serving metropolitan transit authorities, municipal operators, and regional transportation agencies providing essential mobility services connecting communities. Urban bus rapid transit systems deploy dedicated fleets operating high-frequency corridors with specialized infrastructure including bus lanes, signal priority, and enhanced stations improving service reliability. Suburban transit networks connect residential areas with employment centers, educational institutions, and commercial districts addressing daily commuting patterns. Federal funding programs prioritize transit infrastructure supporting continued fleet investment and modernization initiatives.
Zero-emission mandates adopted by major metropolitan areas drive electrification of transit bus, transforming procurement strategies and operational frameworks. Operational characteristics including frequent stops, lower average speeds, and predictable routes align favorably with battery-electric technology capabilities and charging infrastructure requirements. Transit agencies increasingly evaluate fleet procurement through total cost of ownership perspectives, recognizing long-term operational savings offsetting higher initial electric vehicle (EV) costs. Paratransit services provide federally mandated transportation for individuals unable to utilize fixed-route services, expanding market scope significantly.
Regional Insights:
To get detailed analysis of this market, Request Sample
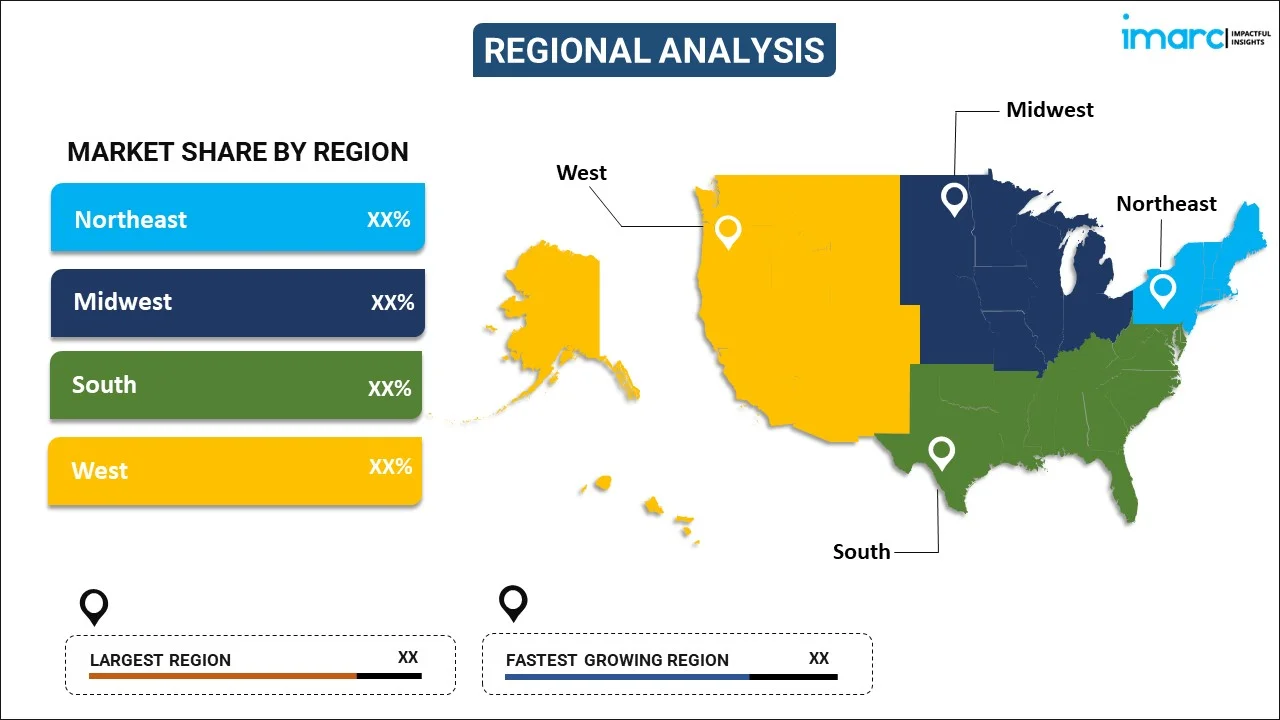
- Northeast
- Midwest
- South
- West
Northeast demonstrates strong market activity characterized by dense urban populations and extensive transit networks with progressive policies accelerating zero-emission adoption. State climate legislation compels electrification while urban density supports service frequency. Educational institutions replace diesel school buses through federal funding despite historical winter performance concerns.
Midwest balances traditional diesel reliance with emerging electrification constrained by budget and infrastructure challenges. Manufacturing heritage supports local production while rural areas favor diesel powertrains. Winter climates challenged performance though technology addresses concerns. Federal programs expand electric access to underserved rural districts.
South experiences robust growth driven by population expansion and metropolitan development addressing congestion challenges. Warm climates favor electric performance while air conditioning stresses batteries during heat. State governments demonstrate varied zero-emission approaches. Natural gas infrastructure supports deployment while school transportation electrification programs advance.
West leads national electrification trends through stringent regulations and substantial incentives with early-adopter initiatives. California maintains dominance with ambitious zero-emission mandates and dedicated funding. Major coastal areas operate hundreds of battery-electric buses. Mountain states balance rural challenges with emerging environmental priorities while managing constraints.
Market Dynamics:
Growth Drivers:
Why is the United States Bus Market Growing?
Infrastructure Modernization and Federal Funding Programs
Transportation infrastructure investment legislation channels unprecedented federal resources toward public transit enhancement through multi-year funding commitments creating substantial market opportunities. In July 2024, the FTA announced ~$1.5 Billion in federal funding under the Bipartisan Infrastructure Law to modernize U.S. bus fleets, support bus facilities, and deploy clean transit buses nationwide. Moreover, transit agencies access competitive grant programs, formula-based allocations, and low-interest financing mechanisms supporting fleet replacement initiatives. Clean School Bus Program provides dedicated resources enabling educational institutions to transition toward zero-emission vehicles regardless of local budget constraints. Priority funding directs resources toward disadvantaged communities historically burdened by transportation-related pollution. State matching fund requirements leverage federal dollars, multiplying available resources for bus procurement. Bipartisan political support ensures program continuity providing fleet operators confidence in long-term funding availability.
Environmental Regulations and Climate Action Mandates
Regulatory frameworks establish increasingly stringent emissions requirements, zero-emission vehicle purchase mandates, and carbon reduction targets reshaping industry competitive dynamics. As per sources, in July 2024, U.S. transit agencies had adopted over 7,028 full-size zero-emission buses, a 14 percent increase from the previous year, demonstrating regulatory impact on electrification. Further, state-level legislation requires transit agencies meet specific zero-emission fleet percentage targets with established compliance timelines. Metropolitan areas adopt climate action plans incorporating public transportation electrification as essential decarbonization strategy. Air quality non-attainment designations trigger federal requirements for emissions reduction measures including clean vehicle adoption. Environmental justice initiatives address historical pollution disparities by prioritizing zero-emission vehicle deployment in disadvantaged communities. Renewable fuel standards create market incentives for alternative propulsion systems while safety regulations mandate advanced features.
Technological Innovation and Total Cost of Ownership Improvements
Battery technology advancement delivers extended operational ranges approaching diesel performance while substantially reducing energy costs compared to conventional fuels. In January 2025, Long Beach Transit secured 30 next‑generation battery‑electric Xcelsior CHARGE NG buses, reinforcing confidence in battery‑electric reliability and extended range for frequent service operations. Furthermore, maintenance requirements decrease dramatically through simplified drivetrains eliminating failure-prone components including transmissions, exhaust systems, and emissions control equipment. Lifecycle cost analyses increasingly favor EVs as battery replacement costs decline and operational savings accumulate over extended service lives. Charging infrastructure maturation provides depot-based solutions and on-route opportunity charging. Fleet management software integrates vehicle telematics, predictive maintenance algorithms, and energy optimization tools.
Market Restraints:
What Challenges the United States Bus Market is Facing?
High Initial Capital Investment Requirements
Zero-emission vehicles command substantially higher purchase prices compared to conventional diesel alternatives, creating immediate budget challenges for transit agencies operating under fiscal constraints. Battery-electric buses typically cost multiples of diesel equivalents, straining capital budgets and requiring creative financing arrangements. Charging infrastructure investments including electrical service upgrades, equipment procurement, and facility modifications add substantial costs limiting adoption.
Range Limitations and Charging Infrastructure Constraints
Battery capacity limitations restrict operational range particularly during extreme weather conditions when heating and cooling demands reduce available miles significantly. Rural service areas with extended routes exceeding EV capabilities necessitate continued diesel dependence. Charging time requirements remove vehicles from service, reducing effective fleet utilization compared to rapid diesel refueling operations.
Supply Chain Vulnerabilities and Production Capacity Constraints
Critical component shortages including semiconductor chips, battery materials, and specialized manufacturing equipment disrupt production schedules and extend delivery timelines substantially. Lithium, cobalt, nickel, and rare earth element supply limitations create cost volatility and availability concerns. Battery manufacturing capacity concentrated among limited suppliers creates vulnerability to production disruptions affecting market growth.
Competitive Landscape:
The United States bus manufacturing industry exhibits a moderate competitive intensity with established domestic producers alongside international manufacturers and EV specialists. Traditional builders leverage extensive dealer networks, service capabilities, and transit agency relationships. Product portfolios span complete vehicle lineups from small-capacity cutaways to full-size coaches with diverse propulsion options. Specialized EV manufacturers challenge incumbents through focused battery-electric development and innovative business models. Industry consolidation continues as larger players acquire competitors while capacity expansions respond to growing market demand.
Some of the key players include:
- AB Volvo
- Blue Bird Corporation
- BYD Co. Ltd.
- Gillig LLC
- GreenPower Motor Company Inc.
- NFI Group Inc.
- The Lion Electric Company
Recent Developments:
- In October 2025, Miami-Dade County inaugurated the 20-mile Metro Express Bus Rapid Transit system, the longest BRT route in the U.S., featuring all-electric buses, 14 modern stations, dedicated lanes, real-time arrival displays, and enhanced passenger amenities, supporting sustainable, efficient urban transit and regional mobility.
United States Bus Market Report Coverage:
| Report Features | Details |
|---|---|
| Base Year of the Analysis | 2025 |
| Historical Period | 2020-2025 |
| Forecast Period | 2026-2034 |
| Units | Billion USD |
| Scope of the Report | Exploration of Historical and Forecast Trends, Industry Catalysts and Challenges, Segment-Wise Historical and Predictive Market Assessment:
|
| Types Covered | Single Deck, Double Deck |
| Fuel Types Covered | Diesel, Electric and Hybrid, Others |
| Seat Capacities Covered | 15-30 Seats, 31-50 Seats, More Than 50 Seats |
| Applications Covered | Transit Bus, Intercity/Coaches, Others |
| Regions Covered | Northeast, Midwest, South, West |
| Companies Covered | AB Volvo, Blue Bird Corporation, BYD Co. Ltd., Gillig LLC, GreenPower Motor Company Inc., NFI Group Inc., The Lion Electric Company, etc. |
| Customization Scope | 10% Free Customization |
| Post-Sale Analyst Support | 10-12 Weeks |
| Delivery Format | PDF and Excel through Email (We can also provide the editable version of the report in PPT/Word format on special request) |
Frequently Asked Questions About the United States Bus Market Report
The United States bus market size was valued at USD 13,835.98 Million in 2025.
The United States bus market is expected to grow at a compound annual growth rate of 4.74% from 2026-2034 to reach USD 20,994.85 Million by 2034.
Single deck held the largest market share, driven by operational versatility across diverse transportation applications, infrastructure compatibility advantages, and manufacturing standardization benefits. Their streamlined configuration facilitates deployment without clearance restrictions while supporting efficient boarding procedures and federal accessibility requirements.
Key factors driving the United States bus market include unprecedented federal infrastructure funding supporting fleet modernization, stringent environmental regulations mandating zero-emission adoption, advancing battery technologies improving operational viability, metropolitan transit expansion addressing urbanization, and total cost of ownership advantages favoring advanced propulsion systems.
Major challenges include high upfront vehicle costs straining capital budgets, limited charging infrastructure in remote areas constraining electric deployment, inconsistent government incentive continuity creating planning uncertainty, supply chain constraints affecting critical components, and varying consumer awareness requiring extensive stakeholder education initiatives.
Need more help?
- Speak to our experienced analysts for insights on the current market scenarios.
- Include additional segments and countries to customize the report as per your requirement.
- Gain an unparalleled competitive advantage in your domain by understanding how to utilize the report and positively impacting your operations and revenue.
- For further assistance, please connect with our analysts.
 Request Customization
 Speak to an Analyst
 Request Brochure
 Inquire Before Buying
Benefits of Customization
- Personalize this research
- Triangulate with your data
- Get data as per your format and definition
- Gain a deeper dive into a specific application, geography, customer, or competitor
- Any level of personalization
Get in Touch With Us
UNITED STATES
Phone: +1-201-971-6302
INDIA
Phone: +91-120-433-0800
UNITED KINGDOM
Phone: +44-753-714-6104
Email: [email protected]
Client Testimonials


.webp)


