
United States Busbar Market Size, Share, Trends and Forecast by Power Rating, Conductor, End User, Industry, and Region, 2026-2034
United States Busbar Market Size, Share, Trends & Forecast (2026-2034)
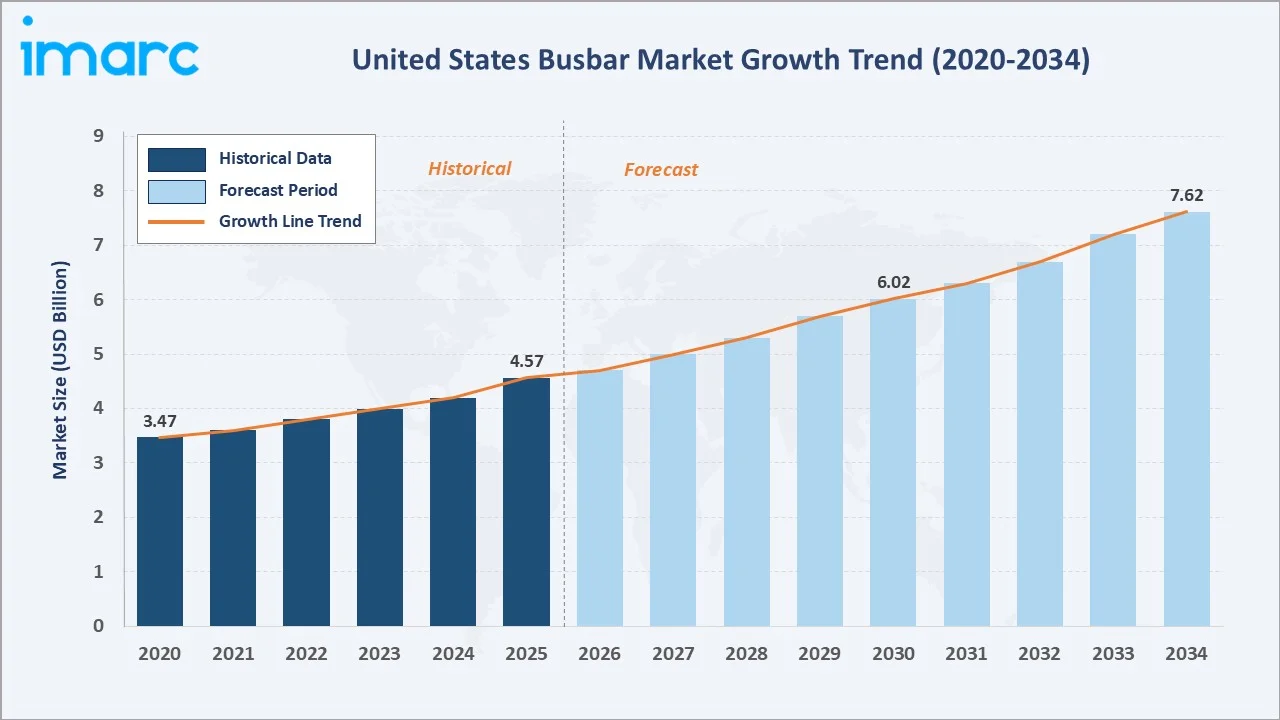
The United States busbar market reached USD 4.57 Billion in 2025 and is projected to reach USD 7.62 Billion by 2034, growing at a CAGR of 5.66% during 2026-2034. The market is driven by rising demand for efficient and compact power distribution systems across industrial, commercial, and utility applications. The Infrastructure Investment and Jobs Act's USD 1.2 Trillion allocation, data center buildout, HVDC transmission expansion, and EV manufacturing facility construction drive sustained market growth. Low power rating leads at 41.7%. Copper dominates conductor material at 63.4%. The West region commands 32.5% of market revenues.
Market Snapshot
|
Metric |
Value |
|
Market Size (2025) |
USD 4.57 Billion |
|
Forecast Market Size (2034) |
USD 7.62 Billion |
|
CAGR (2026-2034) |
5.66% |
|
Base Year |
2025 |
|
Historical Period |
2020-2025 |
|
Forecast Period |
2026-2034 |
|
Largest Power Rating |
Low (41.7%, 2025) |
|
Dominant Conductor |
Copper (63.4%, 2025) |
|
Leading Region |
West (32.5%, 2025) |
The market expanded from USD 3.47 Billion in 2020 to USD 4.57 Billion in 2025, anchored at USD 6.02 Billion in 2030, and forecast to reach USD 7.62 Billion by 2034. Post-COVID infrastructure recovery, combined with the unprecedented scale of US clean energy transition investment, created compounding busbar demand across utility substations, renewable energy interconnections, and semiconductor fabrication facilities.
To get more information on this market, Request Sample
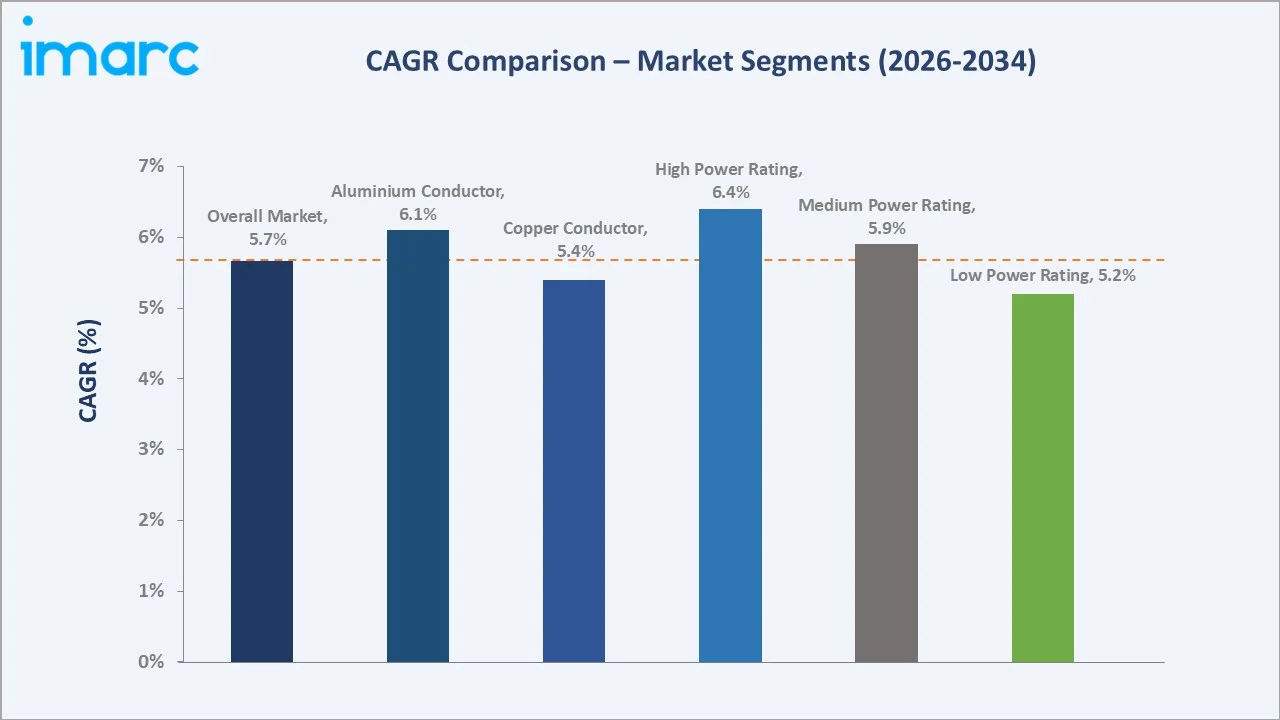
High power rating grows fastest at ~6.4% CAGR (2026-2034), driven by HVDC transmission lines requiring ultra-high-current busbars for offshore wind and solar interconnection, and EV battery gigafactory electrical infrastructure. Aluminium conductors grow at ~6.1% CAGR - faster than copper's ~5.4% - as cost optimization drives aluminium busbar adoption in utility substations and commercial buildings where weight and cost advantages outweigh copper's superior conductivity.
Executive Summary
The United States busbar market reached USD 4.57 Billion in 2025, driven by the intersection of three major infrastructure investment cycles occurring simultaneously: the IIJA's USD 1.2 Trillion infrastructure bill allocating USD 73 Billion to grid modernization; the data center construction boom; and the IRA's USD 369 Billion clean energy manufacturing incentives driving semiconductor fab and EV battery plant construction requiring high-current busbar electrical infrastructure. The market is projected to reach USD 7.62 Billion by 2034 at 5.66% CAGR.
Low power rating busbars command 41.7% of the 2025 market, serving commercial buildings, residential high-rises, light industrial facilities, and commercial data centers with low-current distribution needs. Copper maintains 63.4% conductor dominance through its superior electrical conductivity, lower joint resistance, and established certification advantage in US industrial and utility specifications. The West at 32.5% leads regionally through California's renewable energy buildout, data center expansion, and semiconductor fab construction wave.
Key Market Insights
|
Insight |
Data |
|
Largest Power Rating |
Low - 41.7% share (2025) |
|
Dominant Conductor |
Copper - 63.4% share (2025) |
|
Leading Region |
West - 32.5% market share (2025) |
Key Analytical Observations Supporting the Above Data:
- Low power rating at 41.7% anchored by commercial building and light industrial demand: Low-power busbars (up to 800A) serve the US's commercial buildings requiring switchboard-to-distribution panel power routing, industrial facilities needing machine tool and process power distribution, and housing units undergoing progressive electrical modernization.
- Copper at 63.4% reflecting US industrial specification standards and NEC code preference: The US national standards are historically written with copper as the reference conductor material, creating specification inertia that preserves copper dominance.
- West at 32.5% driven by California renewable energy and infrastructure: California's renewable energy procurement program requires extensive new transmission substation busbar infrastructure for solar and wind interconnection.
United States Busbar Market Overview
The United States busbar market encompasses all rigid and flexible electrical conductor bars used for power distribution across utility, industrial, commercial, and residential applications. Busbars serve as the low-impedance backbone of electrical power distribution systems, replacing individual wires in high-current applications from 100A residential panels to 6,300A industrial busway systems and 500kV+ transmission substation busbars. The market includes copper and aluminium busbars across power rating categories from residential panel boards to grid-scale HVDC transmission.
The ecosystem integrates raw material suppliers, busbar manufacturers, switchgear assemblers, electrical distributors, EPC contractors, and end-user sectors spanning utilities, industrials, data centers, and commercial construction. The macroeconomic factors include rapid urbanization, industrial expansion, and increasing electricity demand across commercial and residential sectors. Rising investments in renewable energy, grid modernization, data centers, and electrification trends are further supporting market growth.
Market Dynamics
To evaluate market opportunities, Request Sample
Market Drivers
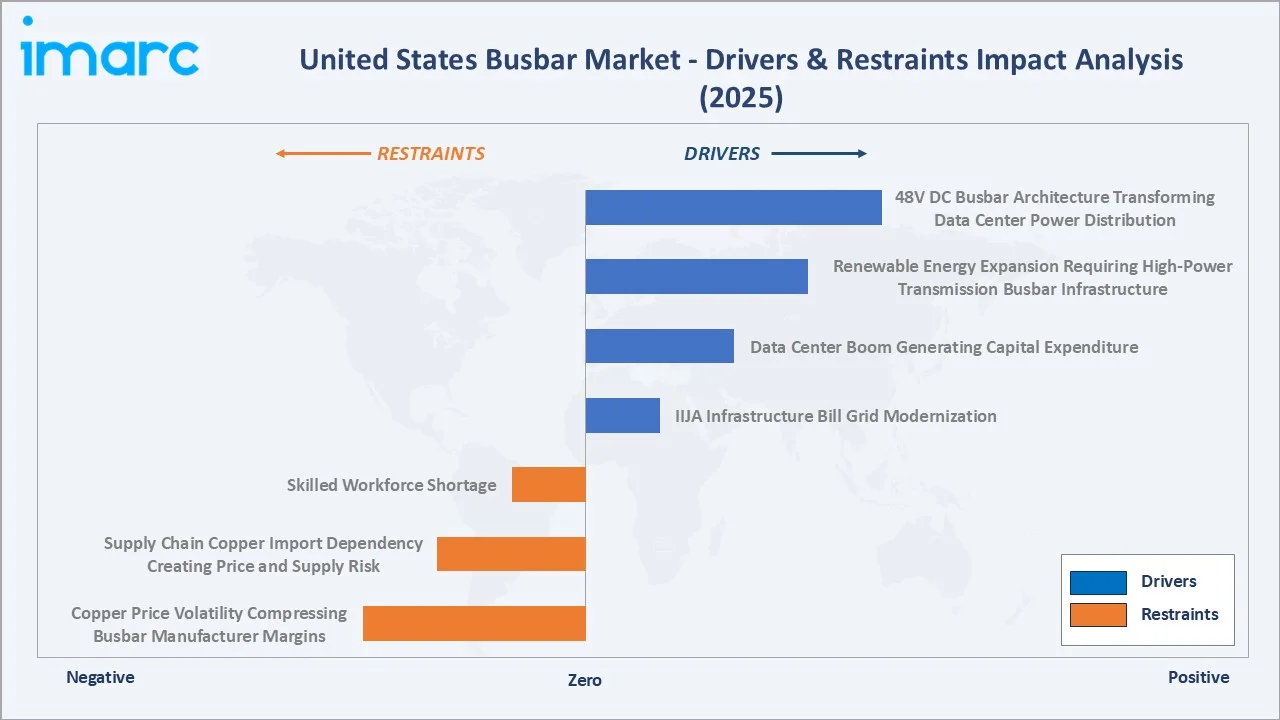
- IIJA USD 1.2 Trillion Infrastructure Bill Driving Grid Modernization Busbar Demand: The Infrastructure Investment and Jobs Act (IIJA, 2021) allocated USD 73 Billion to rebuild the electric grid and includes several provisions to reinforce the resilience of the electric grid. Grid modernization projects require modern gas-insulated switchgear with solid-dielectric busbars or SF6-free alternatives.
- Data Center Boom Generating Capital Expenditure: US data center capital expenditure exceeded, as hyperscale operators accelerate AI infrastructure deployment. Each hyperscale data center requires high electrical infrastructure investments, including primary busbar systems, switchgear busbar assemblies, and overhead plug-in busway distribution.
- Renewable Energy Expansion Requiring High-Power Transmission Busbar Infrastructure: In the first half of 2024 (Q1–Q2), the United States added about 14.1 GWh (4.3 GWac) of energy storage capacity to the grid, marking the highest installation level ever recorded for that period, each project requiring transmission interconnection with high-voltage busbar assemblies at point-of-common-coupling substations.
Market Restraints
- Copper Price Volatility Compressing Busbar Manufacturer Margins: LME copper growth driven by global supply constraints from Chilean and Peruvian mine production shortfalls and accelerating EV copper demand. Manufacturers face pricing lag risk when long-term project contracts are signed at pre-spike copper prices, with material costs subsequently escalating 20-40% during multi-year project construction timelines.
- Supply Chain Copper Import Dependency Creating Price and Supply Risk: The US copper production dropped 3% last year from 2023, with refined copper supply dependent on imports from other sources. US busbar manufacturers without long-term copper procurement contracts face spot market price risk, that compressed industry margins.
Market Opportunities
- Gas-Insulated Switchgear (GIS) Replacing Air-Insulated Switchgear in Urban Substations: US urban utilities are replacing legacy air-insulated switchgear substations with compact gas-insulated switchgear systems that use SF6 or SF6-free dielectric gas around enclosed copper busbars.
- 48V DC Busbar Architecture Transforming Data Center Power Distribution: AI server infrastructure is driving US hyperscale data centers to adopt 48V direct current (DC) power distribution using specialized DC busbars that reduce voltage conversion steps, eliminating 15-25% distribution losses versus traditional AC systems.
Market Challenges
- Skilled Electrical Engineering Workforce Shortage Constraining Project Execution: The shortfall in electrical engineers and power systems technicians is hampering the market growth. Busbar installation requires licensed electricians with specialized training in high-current systems, arc flash safety, and torque-controlled bolted joint assembly. The labor shortage is extending project timelines by 6-18 months, creating revenue recognition timing risk for busbar manufacturers and distributors.
- Environmental Regulation: While creating demand for SF6-free alternatives, the regulatory transition creates specification uncertainty for utilities planning multi-year substation refurbishment programs, delaying final equipment procurement decisions and compressing busbar project award timelines.
Emerging Market Trends
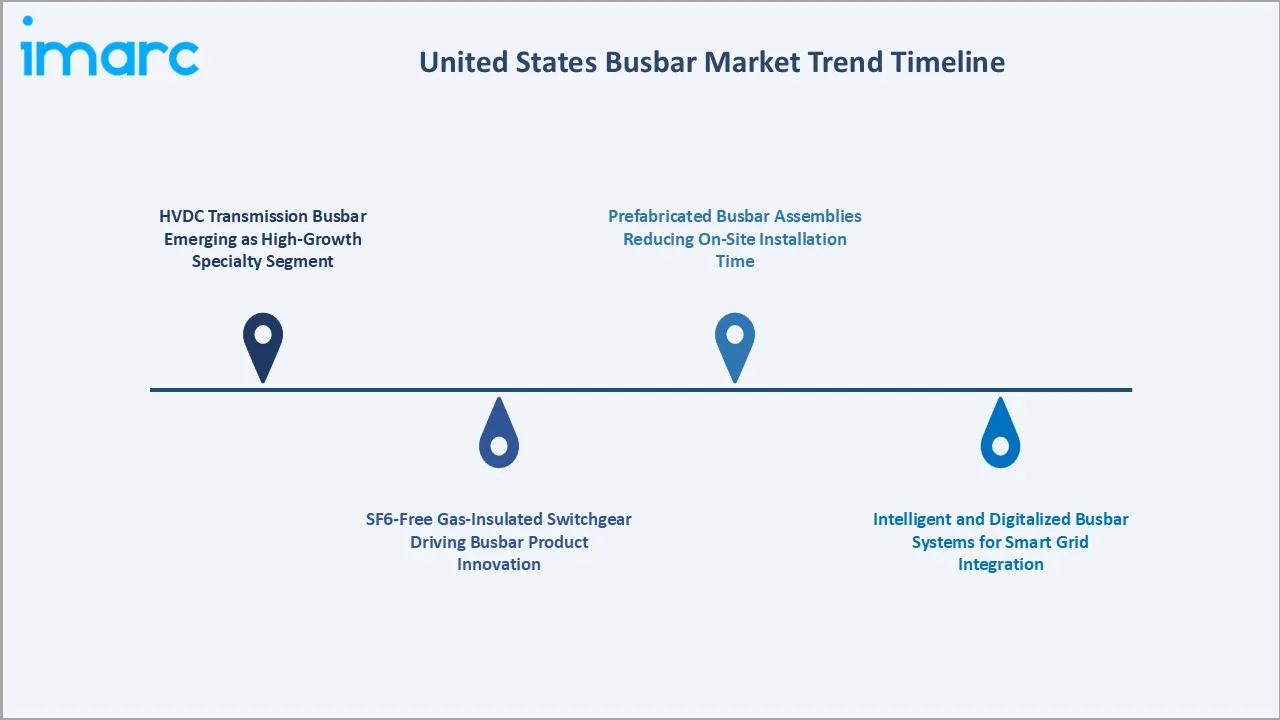
1. HVDC Transmission Busbar Emerging as High-Growth Specialty Segment
High-voltage direct current (HVDC) transmission is expanding in the US as long-distance clean energy corridors connect remote wind and solar resources to population centers. These systems require specialized high-voltage busbar configurations to ensure efficient power flow, grid stability, and reduced transmission losses, particularly in modernized and smart grid infrastructures.
2. SF6-Free Gas-Insulated Switchgear Driving Busbar Product Innovation
SF6-free gas-insulated switchgear is driving busbar product innovation in the US by pushing manufacturers to redesign systems using alternative insulation technologies such as vacuum, clean air, and low-GWP gas mixtures. This transition is leading to advanced busbar designs with improved environmental performance, integrated monitoring capabilities, and compatibility with modern grid infrastructure, as utilities shift toward sustainable and regulation-compliant power distribution solutions.
3. Intelligent and Digitalized Busbar Systems for Smart Grid Integration
Leading busbar manufacturers are embedding IoT sensors, thermal monitoring systems, and communication interfaces into busbar assemblies, creating intelligent busbar trunking systems that provide real-time load monitoring, hot-spot detection, and predictive maintenance alerts.
4. Prefabricated Busbar Assemblies Reducing On-Site Installation Time
Prefabricated busbar assemblies significantly reduce on-site installation time through modular, plug-and-play components manufactured off-site. This approach minimizes labor requirements, lowers installation errors, and enables faster project completion compared to traditional cabling systems, supporting cost efficiency and rapid infrastructure deployment.
Industry Value Chain Analysis
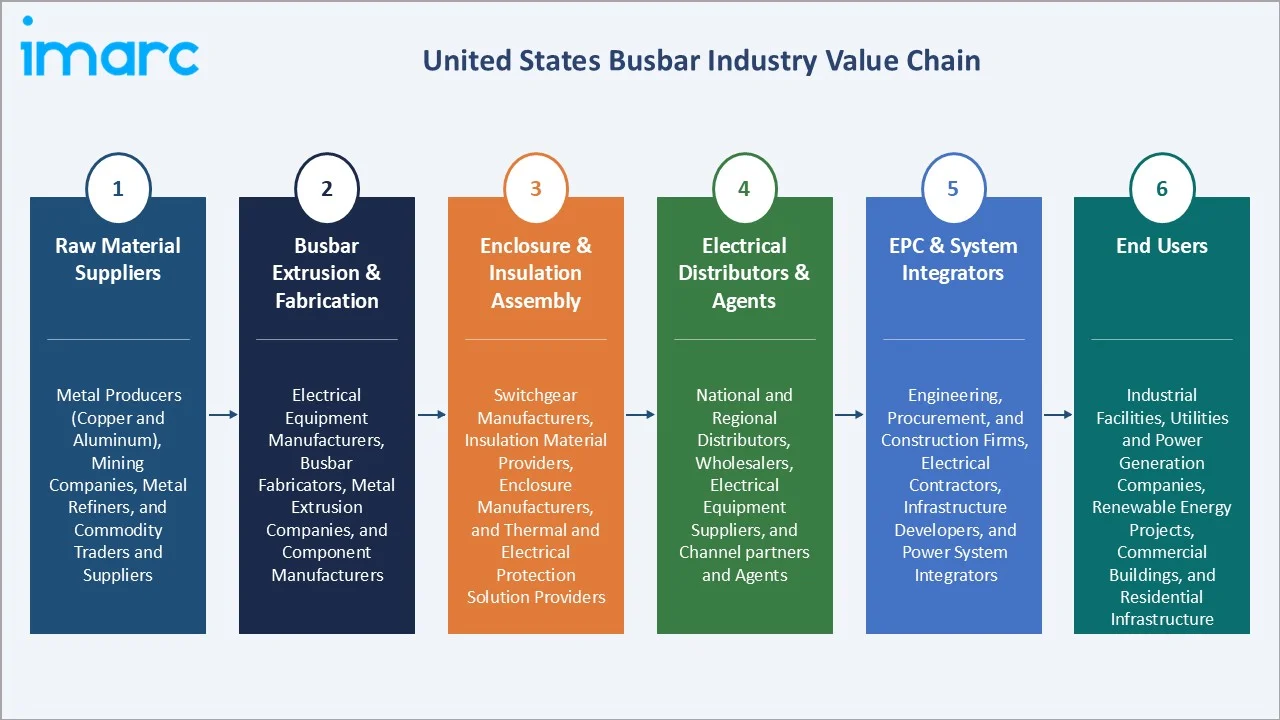
The US busbar market value chain integrates copper and aluminium raw material sourcing through extrusion fabrication, insulation assembly, electrical distribution, and EPC installation, serving industrial, utility, commercial, and residential end-users. Busbar manufacturers capture 35-50% gross margins on specialty high-power and GIS busbar systems; distribution adds 15-25%; EPC integration adds further value through engineering and installation services.
|
Stage |
Key Participants |
|
Raw Material Suppliers |
Metal producers (copper and aluminum), mining companies, metal refiners, and commodity traders and suppliers |
|
Busbar Extrusion & Fabrication |
Electrical equipment manufacturers, busbar fabricators, metal extrusion companies, and component manufacturers |
|
Enclosure & Insulation Assembly |
Switchgear manufacturers, insulation material providers, enclosure manufacturers, and thermal and electrical protection solution providers |
|
Electrical Distributors & Agents |
National and regional distributors, wholesalers, electrical equipment suppliers, and channel partners and agents |
|
EPC & System Integrators |
Engineering, procurement, and construction firms, electrical contractors, infrastructure developers, and power system integrators |
|
End Users |
Industrial facilities, utilities and power generation companies, renewable energy projects, commercial buildings, and residential infrastructure |
The US busbar value chain's most strategically important tier is electrical distribution distribute 60-70% of US busbar products to EPC contractors and industrial end users. Distributor relationships and technical specification support capabilities determine which busbar manufacturers' products are recommended for projects, making distribution channel management a critical competitive advantage for manufacturers competing on equal technical merit.
Technology Landscape in the United States Busbar Industry
High-Voltage and HVDC Busbar Technology
Ultra-high-voltage busbar systems for HVDC transmission and EHV transmission applications represent the most technically demanding busbar segment. Gas-insulated busbar (GIB) technology, using SF6 or SF6-free alternative gas at elevated pressure to insulate copper tubular conductors within grounded aluminum enclosures, enables compact high-voltage busbar installation in space-constrained urban substations and offshore converter platforms.
Intelligent Monitoring and Thermal Management Technology
Fiber-optic distributed temperature sensing (DTS) embedded within busbar enclosures provides continuous thermal monitoring with 0.1°C resolution, detecting overloaded joints or insulation degradation before catastrophic failure. Predictive analytics platforms process busbar sensor data to predict remaining useful life and optimize maintenance scheduling.
48V DC Busbar Architecture for AI Data Centers
48V DC busbar architecture is shaping the US busbar industry by enabling more efficient, high-density power distribution in AI-driven data centers, reducing energy losses compared to traditional AC systems. This approach supports higher compute loads, improves thermal management, and simplifies power infrastructure, making it critical for next-generation data center design.
Market Segmentation Analysis
The report covers the following segments:
|
Segment Category |
Leading Segment |
Market Share |
Year |
|
Power Rating |
Low |
41.7% |
2025 |
|
Conductor |
Copper |
63.4% |
2025 |
|
End User |
Industrial |
🔒 |
2025 |
|
Industry |
Chemicals and Petroleum |
🔒 |
2025 |
|
Region |
West |
32.5% |
2025 |

By Power Rating
Low power rating leads at 41.7% market share (2025). Low-power busbars (up to 800A) serve the most pervasive demand source in the US market, commercial building switchboards (office, healthcare, education, retail), light industrial facilities, and residential high-rise electrical distribution risers. The US commercial construction market in building permits ensures continuous low-power busbar specification and installation demand. Low-power busbar grows at ~5.2% CAGR (2026-2034) as commercial construction and building renovation spending sustains volume growth.

To access detailed market analysis, Request Sample
Medium power rating at 33.6% serves large industrial facilities, utility distribution substations, and mid-tier data centers with 800-3200A busbar requirements. High power at 24.7% grows fastest at ~6.4% CAGR, driven by HVDC transmission projects, gigafactory electrical infrastructure, and hyperscale data center primary distribution systems requiring 3,200-6,300A busbar systems.
By Conductor
Copper busbars lead at 63.4% market share (2025). Copper's dominance reflects US industry specification standards, superior electrical conductivity, and established joint-connection reliability in industrial environments where aluminium's oxide formation at contact surfaces can increase joint resistance over time. Data center and industrial customers consistently specify copper busbar for high-reliability critical applications, sustaining copper's value leadership despite 3-4x higher material cost versus aluminium alternatives.
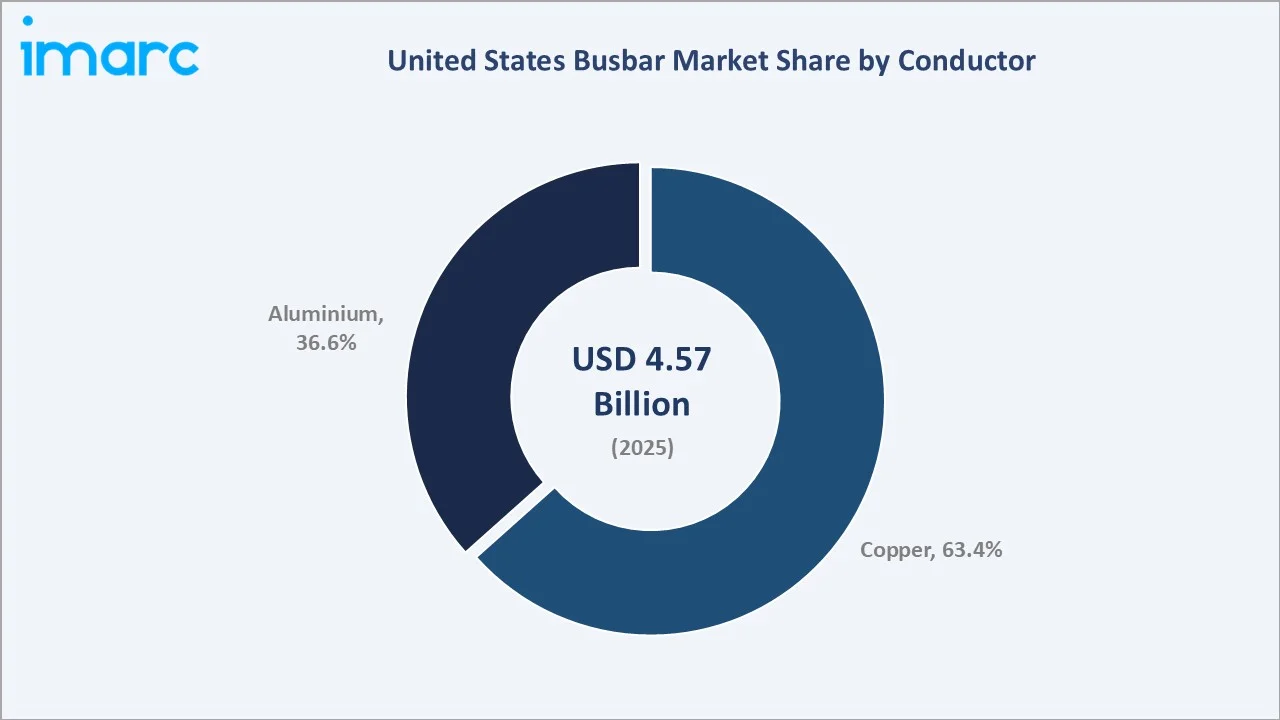
Aluminium at 36.6% grows at ~6.1% CAGR, as US utilities and commercial developers increasingly optimize installed cost through aluminium specification. Aluminium has a density around one-third that of copper, reducing structural support requirements and installation labor, while its lower material cost enables project budget reallocation toward other systems.
Regional Market Insights
|
Region |
Share (2025) |
Key Growth Drivers & Characteristics |
|
West |
32.5% |
Strong renewable energy deployment is driving demand for efficient power distribution, a high concentration of data centers and semiconductor facilities, and increasing investments in grid interconnection and electrification infrastructure |
|
South |
27.3% |
Rapid grid modernization and transmission expansion, growing data center hubs and industrial development, and rising demand from commercial construction and EV infrastructure projects |
|
Midwest |
21.6% |
Strong industrial base, including manufacturing and heavy industries, increasing adoption in EV and battery manufacturing facilities, and ongoing upgrades in power distribution infrastructure |
|
Northeast |
18.6% |
High demand from commercial buildings and urban infrastructure, focus on grid reliability and resilience investments, and increasing integration of renewable energy and distributed power systems |
The West's 32.5% dominance reflects California's unique combination of the US's largest commercial construction market, the nation's most aggressive renewable energy integration program, and the highest concentration of technology company data center investment.
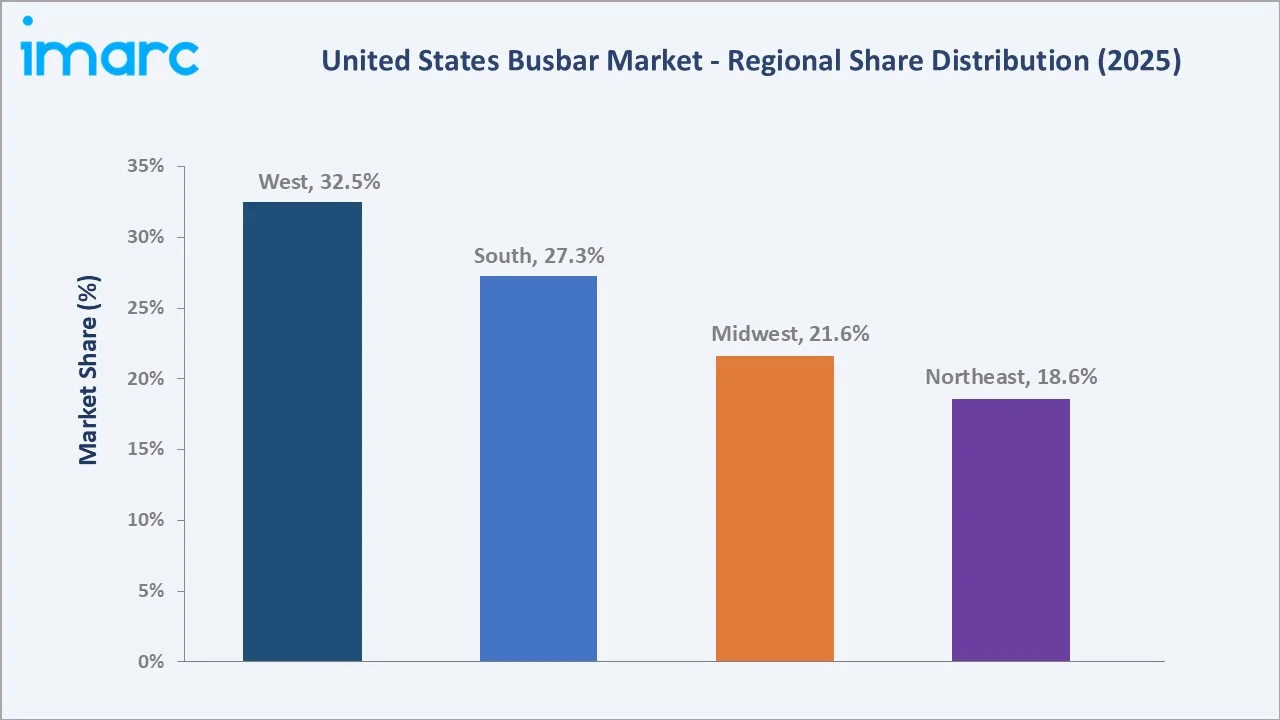
The South's 27.3% is anchored by Texas, the US's largest electricity consumer requiring continuous grid infrastructure investment. The Midwest's 21.6% is driven by Ohio's Intel semiconductor fab.
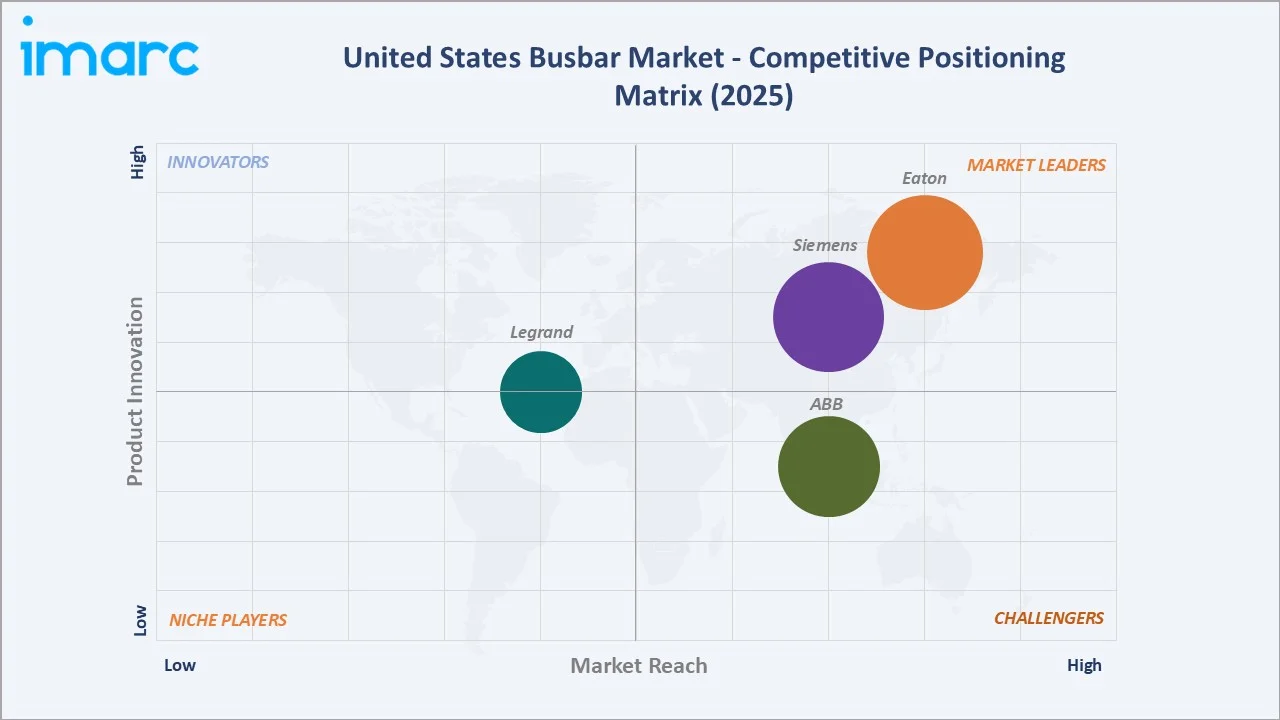
Competitive Landscape
The US busbar market is moderately concentrated at the large manufacturer level. Eaton, Siemens, and ABB, together, capture approximately 45-50% of total US busbar revenues (2025) through their comprehensive product portfolios spanning low-voltage busway to high-voltage GIS busbar systems. The market fragments significantly in specialty segments such as plug-in overhead busway, HVDC busbar, and data center-specific DC busbar.
|
Company Name |
Product Line |
Market Position |
Core Strength |
|
Eaton |
Eaton SVX/SPX DC Busbars |
Market Leader |
One of the world's largest power management companies |
|
Siemens |
SIVACON 8PS busbar trunking systems |
Market Leader |
The SIVACON 8PS busbar trunking systems known for its superior alternative to cable that’s cost-effective, efficient, flexible, and safe. |
|
ABB |
PSN 2/34 FI-SN Assembling Kit Busbar, PSN 2/46 FI-SN Assembling Kit Busbar |
Strong Challenger |
ABB busbar systems enable safe and easy cross-wiring of miniature circuit breakers, residual current devices and other Modular DIN-Rail products. |
|
Legrand |
Zucchini XCP Busbar, Zucchini Medium Rating Busbar, Zucchini LB Plus |
Established Player |
Legrand doubled its U.S. Presence with acquisition of the Wiremold Company |
The competitive landscape is being reshaped by the data center boom and utility-scale renewable energy buildout - both creating demand for specialty high-power and digitally-integrated busbar products where technical differentiation enables premium pricing versus commodity low-voltage busway.
Key Company Profiles
Eaton
Eaton is one of the world's largest power management companies and the US busbar market's undisputed commercial and technical leader.
- Product Portfolio: Eaton SVX/SPX DC Busbars.
- Recent Developments: In October 2025, Eaton introduced a reference architecture to accelerate 800 VDC power adoption in AI data centers, aligned with NVIDIA’s infrastructure design. The solution integrates busbar-based power distribution, supercapacitors, DC connectors, and thermal containment systems to enhance efficiency, reliability, and support high-density computing demands.
- Strategic Focus: Data center busbar market leadership and IoT-integrated busbar as a premium product line.
Siemens
Siemens holds a strong position in the U.S. busbar market through its Smart Infrastructure division, offering advanced power distribution solutions for industrial, commercial, and data center applications. The company’s portfolio includes modular busbar trunking systems such as SIVACON, designed to provide efficient, flexible, and space-saving alternatives to traditional cabling.
- Product Portfolio: SIVACON 8PS busbar trunking systems
- Recent Developments: In April 2026, Siemens Smart Infrastructure introduced a new portfolio of DC protection and switching solutions, including the SENTRON 3QD2 semiconductor circuit breaker and SIRIUS 3RF5 solid-state device. Integrated with SIVACON switchboards and busbar systems, the solutions support efficient and reliable low-voltage power distribution for data centers, industrial facilities, battery storage, and renewable energy integration.
- Strategic Focus: Strengthening its position in the U.S. busbar market through digitalized, energy-efficient, and modular power distribution solutions under its smart infrastructure division.
Market Concentration Analysis
The US busbar market exhibits moderate concentration, with the top 3 manufacturers, Eaton, Siemens, and ABB, together capturing approximately 45-50% of total US busbar revenues (2025). Concentration is highest in high-voltage and HVDC segments, where technical barriers to entry and certification costs limit competitive participation to 3-5 global manufacturers per segment. The low-voltage commercial busway segment is more competitive.
Market fragmentation increases significantly where hundreds of panel board manufacturers, electrical contractors, and regional busbar fabricators supply custom-cut copper and aluminium busbars for switchboard and MCC (motor control center) assemblies. This fragmented lower tier is characterized by commodity pricing, minimal product differentiation, and price-driven purchase decisions where raw material cost passthrough dominates margin dynamics.
Investment & Growth Opportunities
Fastest Growing Segments
High power rating (~6.4% CAGR), aluminium conductor (~6.1% CAGR), HVDC busbar specialty segment (~15%+ CAGR from a smaller base), data center 48V DC busbar (~20%+ CAGR), and GIS busbar for urban substation replacement (~8-10% CAGR) represent the US busbar market's highest-growth investment vectors through 2034. HVDC busbar represents the highest-growth specialty segment as the US adds new HVDC transmission corridors.
Emerging Market Opportunities
The US offshore wind industry requires submarine cable landing substations with specialized high-power busbar assemblies for AC/DC converter stations at each offshore project interconnection. Each offshore wind converter platform (HVDC offshore substation) requires USD 80-150 Million in high-voltage busbar and GIS switchgear, creating a cumulative offshore wind-specific busbar opportunity through 2035.
Investment Themes
- HVDC and EHV transmission busbar manufacturing: US HVDC busbar production is currently dominated by ABB and Siemens. Domestic HVDC busbar manufacturing capacity represents a strategic gap, creating an investment opportunity for US-based high-voltage manufacturing.
- Data center 48V DC busbar systems: The shift from AC to 48V DC power distribution in AI data centers requires new busbar products with DC-specific ratings, arc suppression, and monitoring capabilities. This technically differentiated product category offers 25-35% gross margins, representing a premium market segment aligned with the highest-growth US electrical infrastructure sector.
Future Market Outlook (2026-2034)
The United States busbar market is projected to grow from USD 4.57 Billion in 2025 to USD 7.62 Billion by 2034, delivering a 5.66% CAGR over the forecast period. The market's anchor value of USD 6.02 Billion in 2030 reflects the commercial realization of three simultaneous infrastructure investment cycles, grid modernization reaching peak deployment phase, data center construction compounding on AI infrastructure demand, and IRA-incentivized semiconductor and EV manufacturing facility construction completing initial build-out phases, that collectively represent the largest simultaneous electrical infrastructure investment in US history.
Three structural forces define the US busbar market's growth trajectory with exceptional visibility through 2034: the investment frameworks providing USD 73 Billion in dedicated grid funding, creating government-mandated demand that is contractually committed through multi-year project pipelines; the AI computing revolution driving data center capital expenditure; and the high power rating segment's structural demand growth as US electrical infrastructure transitions from the 1960s-era low-current design assumption toward higher-current systems required by EV charging infrastructure, industrial electrification, and HVDC transmission.
Research Methodology
Primary Research
Primary research comprised structured interviews with 70+ industry stakeholders (2025), including US utility substation engineers from Duke Energy, Pacific Gas & Electric, and American Electric Power; electrical engineers from major data center developers; product managers; Wesco International and Graybar Electric electrical distribution executives; and NEMA (National Electrical Manufacturers Association) standards committee members governing busbar specifications.
Secondary Research
Secondary research encompassed NEMA industry electrical equipment shipment data 2024, DOE Grid Deployment Office project tracking database, FERC Order 1920 transmission planning filings, EPA SF6 regulation proposal documentation, Edison Electric Institute (EEI) utility capital expenditure survey 2024, Data Center Dynamics US construction pipeline data, company investor presentations and earnings disclosures, LME copper and aluminium commodity price data, and NEC 2023 Edition busbar specification requirements. Over 125 secondary sources were reviewed.
Forecasting Models
Market revenue forecasts were developed using bottom-up segmental models incorporating power rating demand growth rates calibrated against US utility capital expenditure surveys, data center construction pipeline data, semiconductor fab construction timelines, and EV manufacturing facility buildout schedules. Key inputs include IIJA spending disbursement schedules from DOE/FHWA, IRA manufacturing credit utilization projections (CBO 2024), US EIA electricity infrastructure investment scenarios, copper and aluminium commodity price forward curves, and DOE Grid Deployment Office transmission project pipeline data through 2034.
United States Busbar Market Report Coverage
| Report Features | Details |
|---|---|
| Base Year of the Analysis | 2025 |
| Historical Period | 2020-2025 |
| Forecast Period | 2026-2034 |
| Units | Billion USD |
| Scope of the Report |
Exploration of Historical Trends and Market Outlook, Industry Catalysts and Challenges, Segment-Wise Historical and Future Market Assessment:
|
| Power Ratings Covered | High, Medium, Low |
| Conductors Covered | Copper, Aluminium |
| End Users Covered | Industrial, Commercial, Residential, Utilities |
| Industries Covered | Chemicals and Petroleum, Metals and Mining, Manufacturing, Others |
| Region Covered | Northeast, Midwest, South, West |
| Companies Covered | Eaton, Siemens, ABB, Legrand, etc. |
| Customization Scope | 10% Free Customization |
| Post-Sale Analyst Support | 10-12 Weeks |
| Delivery Format | PDF and Excel through Email (We can also provide the editable version of the report in PPT/Word format on special request) |
Frequently Asked Questions About the United States Busbar Market Report
The US busbar market reached USD 4.57 Billion in 2025, driven by grid modernization investment, data center construction capex, IRA-incentivized EV and semiconductor manufacturing, and renewable energy interconnection infrastructure buildout.
The market grows at 5.66% CAGR during 2026-2034, reaching USD 7.62 Billion by 2034, driven by HVDC expansion, data center 48V DC busbar, SF6-free GIS substation replacement, EV gigafactory electrical infrastructure, and offshore wind converter station busbar demand.
Low power rating leads at 41.7% (2025), serving commercial building switchboards, light industrial facilities, and residential high-rise distribution.
Copper dominates at 63.4% (2025), reflecting superior conductivity and industrial specification preference.
The West leads at 32.5% (2025), driven by California's renewable energy grid buildout, Nevada and Oregon data center hyperscale clusters, and Arizona's semiconductor manufacturing expansion requiring high-current process power distribution busbar.
Leading companies include Eaton, Siemens, ABB, and Legrand, among others.
The US busbar market is projected to reach approximately USD 6.02 Billion by 2030, driven by HVDC busbar demand, 48V DC data center busbar standardization, SF6-free GIS penetration, and aluminium specification reaching 40% of total conductor volume.
The IIJA's USD 73 Billion clean energy transmission allocation funds grid modernization requiring modern GIS switchgear busbar replacement for aging 1960s-era AIS substations.
Aluminium grows at ~6.1% CAGR versus copper's ~5.4%, driven by US utility and commercial cost optimization. Aluminium's lower material cost and lower weight reduce long conductor run costs significantly.
HVDC (High Voltage Direct Current) busbar handles ±320kV to ±800kV DC power in transmission converter stations for long-distance clean energy transmission. Growing at 15%+ CAGR as the US adds HVDC transmission for offshore wind and Sunbelt solar-to-demand-center corridors.
Need more help?
- Speak to our experienced analysts for insights on the current market scenarios.
- Include additional segments and countries to customize the report as per your requirement.
- Gain an unparalleled competitive advantage in your domain by understanding how to utilize the report and positively impacting your operations and revenue.
- For further assistance, please connect with our analysts.
 Request Customization
 Speak to an Analyst
 Request Brochure
 Inquire Before Buying
Benefits of Customization
- Personalize this research
- Triangulate with your data
- Get data as per your format and definition
- Gain a deeper dive into a specific application, geography, customer, or competitor
- Any level of personalization
Get in Touch With Us
UNITED STATES
Phone: +1-201-971-6302
INDIA
Phone: +91-120-433-0800
UNITED KINGDOM
Phone: +44-753-714-6104
Email: [email protected]
Client Testimonials


.webp)


