
United States Business Intelligence Market Size, Share, Trends and Forecast by Component, Deployment, Organization Size, End-Use Industry, and Region, 2026-2034
United States Business Intelligence Market Size, Share, Trends & Forecast (2026-2034)
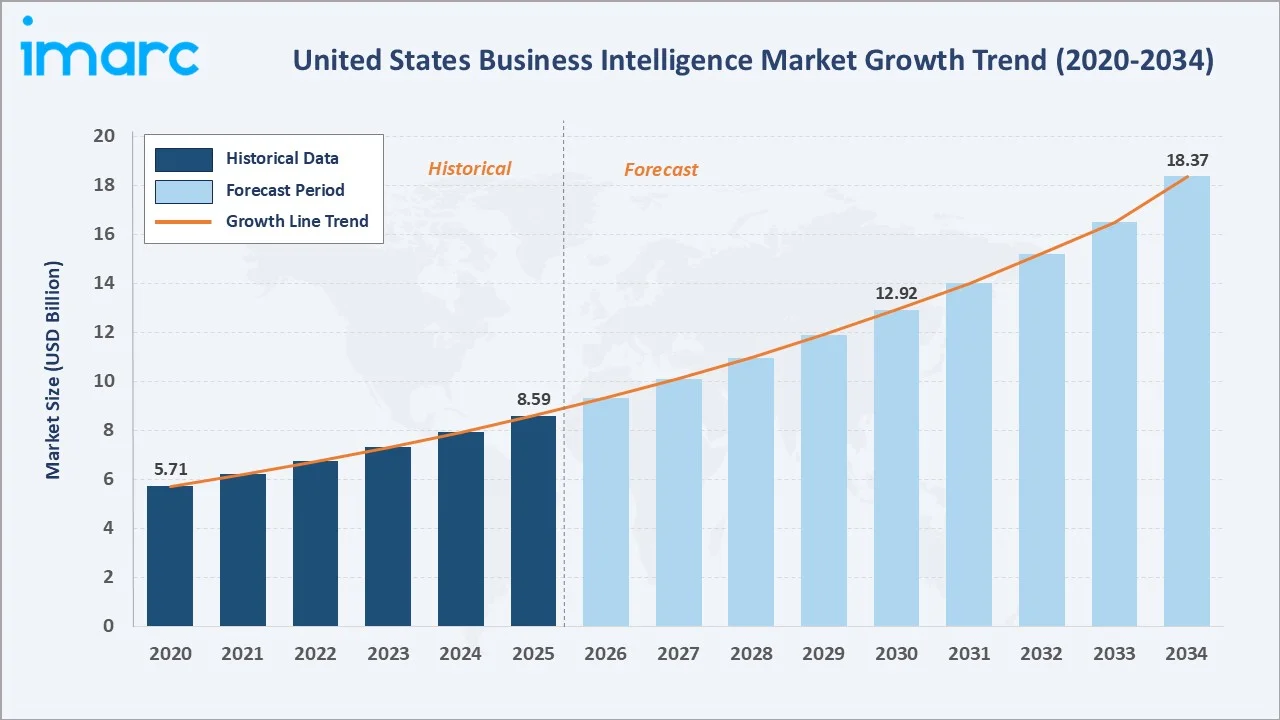
The United States business intelligence market reached USD 8.59 Billion in 2025 and is projected to reach USD 18.37 Billion by 2034, growing at a CAGR of 8.50% during 2026-2034. The United States commands the world's largest business intelligence market, driven by a pervasive enterprise data-driven decision-making culture, the world's deepest concentration of BI platform vendors, and accelerating AI-augmented analytics adoption across financial services, healthcare, retail, and government sectors.
Market Snapshot
|
Metric |
Value |
|
Market Size (2025) |
USD 8.59 Billion |
|
Forecast Market Size (2034) |
USD 18.37 Billion |
|
CAGR (2026-2034) |
8.50% |
|
Base Year |
2025 |
|
Historical Period |
2020-2025 |
|
Forecast Period |
2026-2034 |
The South region leads with a 33.2% market share in 2025, anchored by Texas's and Florida's dense enterprise and government technology adoption base and Virginia's federal IT spending concentration. Cloud-based deployment commands a 61.7% share of the deployment breakdown, while software and platform components retain the largest share at 68.4% across components.
To get more information on this market, Request Sample
The US business intelligence market is underpinned by three structural forces: the Gartner-documented shift from IT-centric reporting to business-user self-service analytics; the Microsoft Power BI dominance; and the AI augmentation of BI platforms with natural language query, automated insight generation, and predictive analytics that is transforming BI from a descriptive analysis tool into a forward-looking decision intelligence platform.
Executive Summary
The United States business intelligence market is experiencing sustained expansion, driven by the enterprise digital transformation imperative, the democratization of analytics through self-service BI platforms, and the integration of generative AI and augmented analytics capabilities into mainstream BI tools. The market reached USD 8.59 Billion in 2025 and is forecast to reach USD 18.37 Billion by 2034, growing at a CAGR of 8.50%.
Cloud-based deployment dominates with a 61.7% share in 2025, reflecting the enterprise migration from legacy on-premises BI deployments toward cloud-native platforms that reduce IT infrastructure overhead, enable real-time data integration, and provide subscription pricing models that convert BI from capital expenditure to operational expenditure. Software and platform components command a 68.4% share, encompassing BI platform licenses, cloud BI subscriptions, embedded analytics SDKs, and data visualization tools.
The South region at 33.2% leads regionally, driven by Texas's concentration of Fortune 500 headquarters, Florida's large financial services and healthcare industries, and Virginia's federal government IT procurement. Leading vendors collectively represent the world's most competitive BI vendor ecosystem, continuously advancing analytics capabilities through AI integration and cloud platform innovation.
Key Market Insights
|
Insight |
Data |
|
Largest Deployment Mode |
Cloud-based – 61.7% share (2025) |
|
Fastest Growing Deployment |
Cloud-based – ~11.2% CAGR (2026-2034) |
|
Largest Component |
Software and Platform – 68.4% share (2025) |
|
Fastest Growing Component |
Software and Platform – ~9.6% CAGR (2026-2034) |
|
Leading Region |
South – 33.2% share (2025) |
|
Top Companies |
Microsoft, Salesforce, Inc., SAP SE, IBM Corporation, Oracle |
Key Analytical Observations Supporting The Above Data:
- Cloud-based deployment at 61.7% (2025) dominates as US enterprises are systematically migrating legacy on-premises BI deployments to cloud-native platforms, including Microsoft Power BI Premium, Tableau Cloud, and Qlik Sense SaaS that provide automatic updates, elastic scaling, and consumption-based pricing that aligns BI costs with actual usage rather than peak capacity provisioning.
- Software and Platform at 68.4% (2025) reflects the capital-intensive nature of enterprise BI platform licensing, creating recurring SaaS subscription revenue streams that anchor vendor revenue independent of professional services cycles.
- The South's 33.2% share (2025) reflects Texas's emergence as the primary US enterprise technology hub outside Silicon Valley. Florida's large financial services, healthcare, and tourism industries add complementary demand, which creates government-specific BI demand anchored by classified and unclassified analytics platforms.
- Services at 31.6% (2025) encompass BI implementation consulting, data engineering, model development, training, and managed analytics services as enterprises shift from one-time BI platform deployments toward continuous analytics optimization programs where BI consultants provide ongoing data science and dashboard development services under multi-year managed analytics contracts.
United States Business Intelligence Market Overview
Business intelligence encompasses the technologies, processes, and practices that transform raw enterprise data into actionable insights supporting operational, tactical, and strategic decision-making. The market spans traditional reporting and query tools, self-service visualization platforms, augmented analytics with AI-driven insight generation, embedded analytics integrated into business applications, real-time operational intelligence, and predictive and prescriptive analytics.
The transition from structured data reporting to unstructured data analytics, real-time operational analytics, and AI-generated insights is expanding the BI market's technical and economic scope. This is driving investment in next-generation platforms that support semantic layers, AI copilots, and natural language interfaces that make analytics accessible to non-technical business users.
Market Dynamics
To evaluate market opportunities, Request Sample
Market Drivers
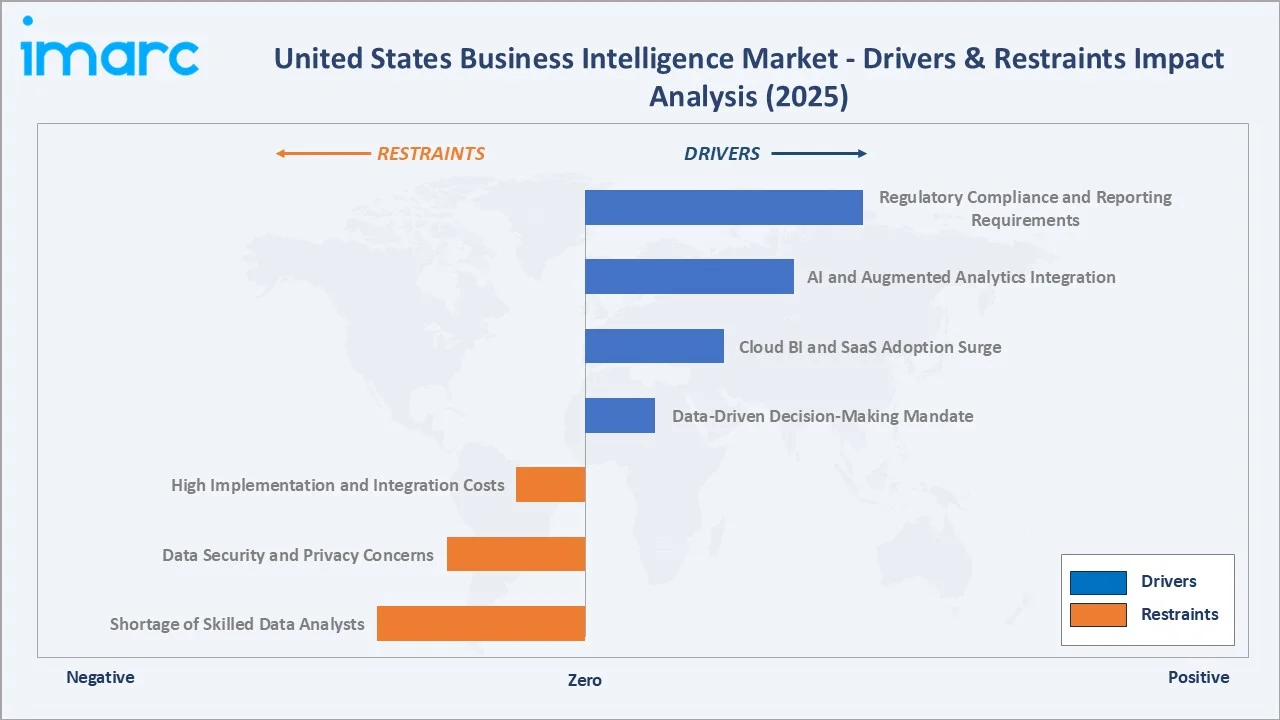
- Data-Driven Decision-Making Mandate: Data-driven companies are 23 times more likely to outperform competitors in customer acquisition, nearly 19 times more likely to remain profitable, and almost seven times more likely to retain customers. This performance evidence has converted BI investment from an IT discretionary budget item to a C-suite strategic priority, with US enterprise BI software spending growing at 12%+ annually among S&P 500 companies.
- Cloud BI and SaaS Adoption Surge: Microsoft's March 2025 announcement that Microsoft Fabric has surpassed 70% Fortune 500 penetration demonstrates the enterprise market's rapid shift toward cloud-native integrated analytics ecosystems. Salesforce, Inc.'s Tableau Cloud migration strategy and AWS QuickSight's consumption-based pricing are collectively converting on-premises BI budgets to cloud subscriptions.
- AI and Augmented Analytics Integration: The 2025 Gartner Magic Quadrant for Analytics and Business Intelligence Platforms identified 'Agentic AI' and proactive analytics as the defining capability themes, with Microsoft Power BI Copilot, Tableau Einstein AI, Qlik AutoML, and ThoughtSpot's Spotter LLM-powered analytics enabling business users to generate insights through natural language questions without SQL or data science expertise.
- Regulatory Compliance and Reporting Requirements: US regulatory mandates create non-discretionary BI investment that is independent of enterprise IT budget cycles. Growing requirements across financial reporting, healthcare compliance, cybersecurity, ESG disclosures, and audit transparency are further driving demand for automated dashboards, real-time reporting, and governed analytics platforms in the United States business intelligence market.
Market Restraints
- High Implementation and Integration Costs: Enterprise BI platform implementations for Fortune 500 organizations cost USD 500,000–5 million for initial deployment and USD 100,000–500,000 annually in maintenance and enhancement. These costs create 18–36 month business case approval cycles that slow adoption among mid-market enterprises and create budget competition with other digital transformation priorities.
- Data Security and Privacy Concerns: US enterprises managing sensitive customer, financial, or health data face significant governance challenges when migrating on-premises BI to cloud platforms. Data residency requirements, encryption standards, and audit trail documentation needs add 20–40% to cloud BI migration project costs.
- Shortage of Skilled Data Analysts: The U.S. faces a shortage of more than 250,000 data scientists, with McKinsey projecting that by 2026, demand will exceed supply by nearly 50%. This talent scarcity constrains enterprise BI deployment capacity. Even organizations with platform licenses face delays in developing analytics content and maintaining data models due to insufficient internal analytics staff.
Market Opportunities
- Embedded Analytics in Business Applications: The embedded analytics market is growing at 25%+ CAGR as vendors, including Salesforce, Inc., ServiceNow, Workday, and Microsoft, embed analytics natively into their application platforms. Sigma Computing's embedded analytics SDK, Qlik's embedded analytics APIs, and Microsoft's Power BI Embedded service are enabling ISVs to monetize analytics as a premium feature within their own products.
- Real-Time Operational Analytics for Manufacturing and Logistics: US manufacturers and logistics operators are deploying real-time BI at accelerating rates as supply chain resilience becomes a board-level priority post-COVID. Palantir's Foundry platform and Snowflake's Cortex AI are enabling real-time operational intelligence use cases that traditional batch-reporting BI platforms cannot support, expanding the market's technical and economic scope beyond historical descriptive analytics.
Market Challenges
- Platform Consolidation and Vendor Rationalization: US enterprises that deployed multiple point BI tools during the 2010s self-service analytics wave are now executing 'BI rationalization' programs. This rationalization is creating large enterprise contract opportunities for winning vendors while generating displacement risk for losing vendors.
- Data Literacy and Change Management Barriers: Limited data literacy across business teams and resistance to adopting self-service analytics tools can slow BI implementation in the United States business intelligence market. Organizations are increasingly investing in training, governance frameworks, and user-friendly BI platforms to improve adoption and maximize the value of data-driven decision-making.
Emerging Market Trends
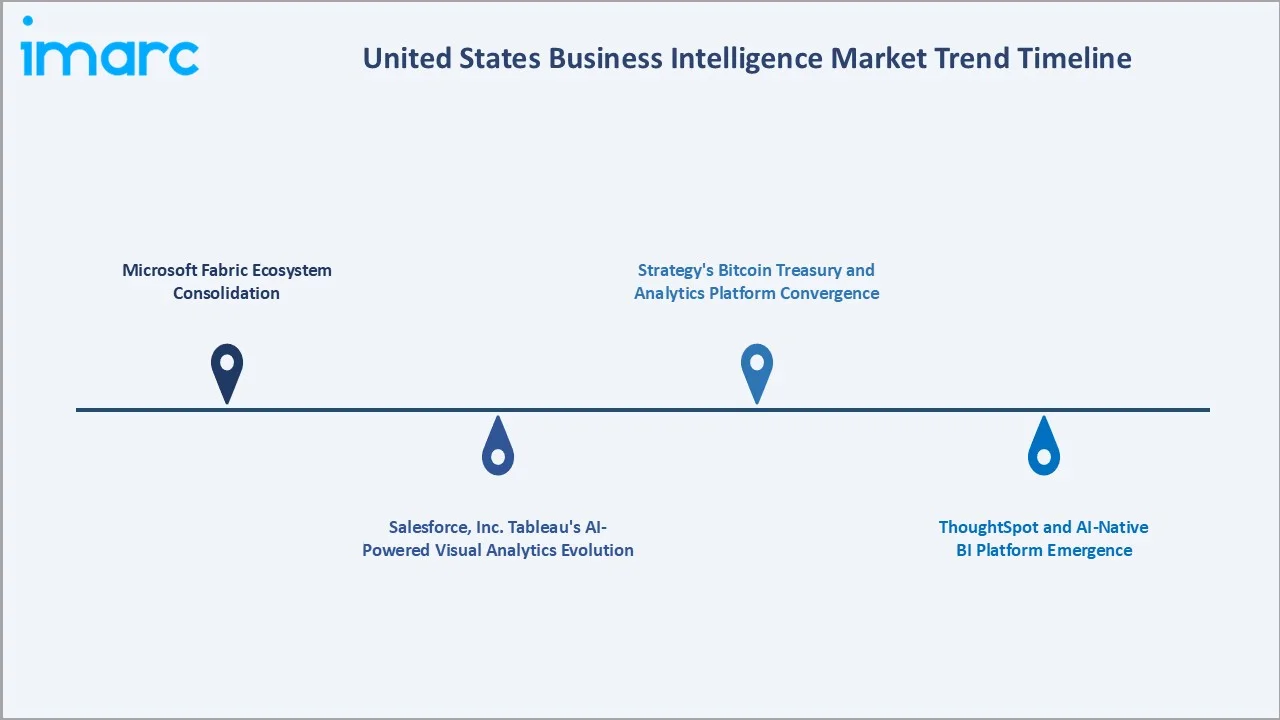
1. Microsoft Fabric Ecosystem Consolidation
Microsoft's unified data analytics platform, Microsoft Fabric, has achieved penetration in 74% of Fortune 500 companies by March 2025, establishing itself as the enterprise standard BI platform. Fabric's integration with Microsoft 365 Copilot creates a seamless analytics experience where business users can request data insights through natural language within Teams, Excel, and PowerPoint.
2. Salesforce, Inc. Tableau's AI-Powered Visual Analytics Evolution
Salesforce, Inc. Tableau achieved its 12th consecutive year in the Gartner Magic Quadrant Leaders position in 2024, delivering over 140 new product features, including Tableau Einstein AI integration, Tableau Pulse AI-generated insight summaries, and enhanced Server, Cloud, and Desktop capabilities. Tableau's 2025 focus on democratizing analytics reflects the market's structural shift toward self-service analytics that expands the addressable user base beyond trained data professionals to include all business users.
3. ThoughtSpot and AI-Native BI Platform Emergence
ThoughtSpot advanced into the Gartner Magic Quadrant Leaders quadrant in 2024, representing the emergence of AI-native BI platforms that were designed from inception around natural language query and generative AI rather than retrofitting AI onto legacy reporting architectures. ThoughtSpot's Spotter LLM-powered analytics is pioneering the natural language analytics category that Gartner identifies as the defining BI capability trend for 2025–2027.
4. Strategy's Bitcoin Treasury and Analytics Platform Convergence
Strategy's transformation into a Bitcoin-focused company has created a unique convergence of analytics software revenue and digital asset treasury management that is differentiating Strategy in both the BI software and cryptocurrency institutional adoption markets. Strategy One, delivering enterprise analytics, mobile BI, and embedded analytics capabilities, continues to generate USD 460 million annually in software revenue, while the company's Bitcoin strategy has created significant shareholder value through Bitcoin appreciation.
Industry Value Chain Analysis
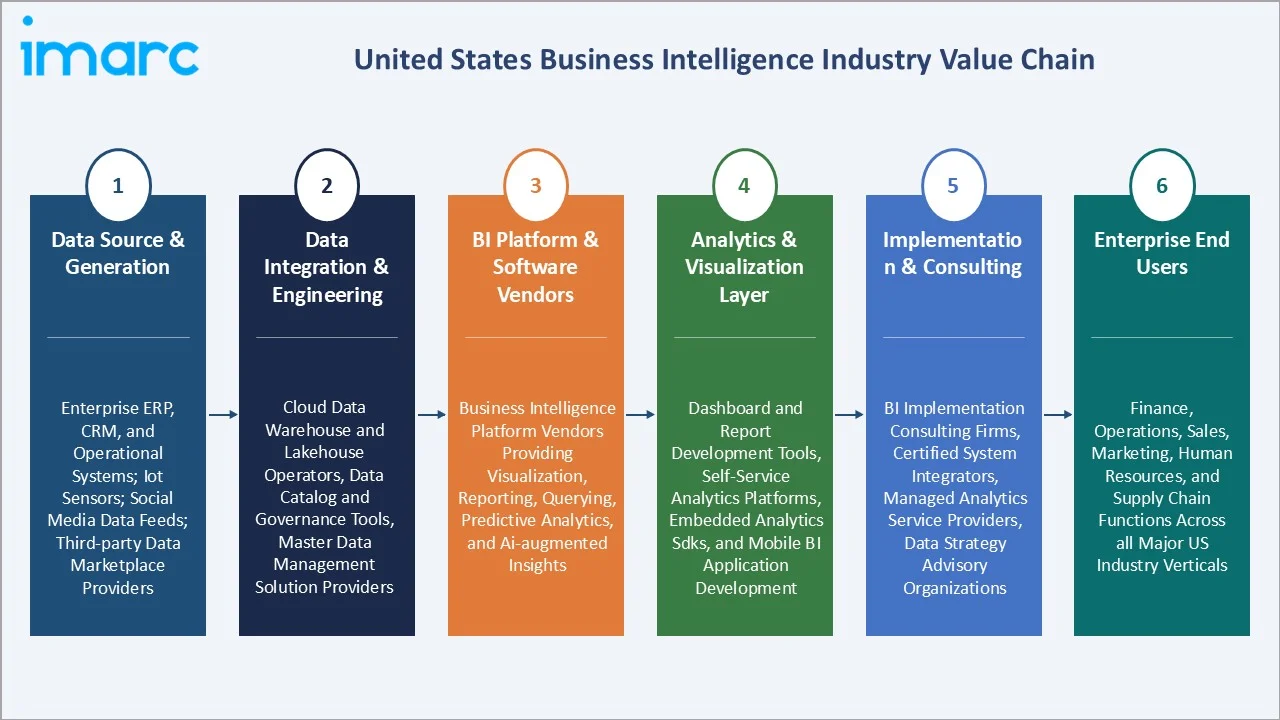
The US business intelligence value chain spans data source generation through enterprise decision-making, with each stage occupied by specialized technology providers, platform vendors, system integrators, and consulting organizations whose collective performance determines the speed, quality, and ROI of enterprise analytics programs.
|
Stage |
Key Players / Examples |
|
Data Source & Generation |
Enterprise ERP, CRM, and operational systems; IoT sensors; social media data feeds; third-party data marketplace providers |
|
Data Integration & Engineering |
Cloud data warehouse and lakehouse operators, data catalog and governance tools, master data management solution providers |
|
BI Platform & Software Vendors |
Business intelligence platform vendors providing visualization, reporting, querying, predictive analytics, and AI-augmented insights |
|
Analytics & Visualization Layer |
Dashboard and report development tools, self-service analytics platforms, embedded analytics SDKs, and mobile BI application development |
|
Implementation & Consulting |
BI implementation consulting firms, certified system integrators, managed analytics service providers, data strategy advisory organizations |
|
Enterprise End Users |
Finance, operations, sales, marketing, human resources, and supply chain functions across all major US industry verticals |
Technology Landscape in the United States Business Intelligence Industry
Cloud-Native BI Platforms and Data Lakehouse Architecture
The US business intelligence market's technology foundation is shifting from traditional on-premises data warehouse and reporting architectures toward cloud-native data lakehouse platforms. This lakehouse architecture enables unified analytics across structured and unstructured data at a petabyte scale, expanding BI use cases beyond historical ERP reporting to include ML model monitoring, NLP sentiment analysis, and computer vision quality control.
Augmented Analytics and Natural Language Querying
The 2025 Gartner Magic Quadrant identified augmented analytics as the dominant technical capability theme. Microsoft Power BI Copilot, Tableau Einstein AI, Qlik AutoML, and ThoughtSpot's Spotter enable natural language queries that generate instant visualizations without SQL or data science expertise. This capability democratization is the primary driver of BI user base expansion that underlies the market's long-term CAGR sustainability.
Embedded Analytics and API-First BI Architecture
Embedded analytics is the fastest-growing BI technology category in the US market. Sigma Computing's cloud-native embedded analytics, Qlik's Embedded Analytics SDK, and Microsoft's Power BI Embedded service are enabling SaaS vendors to deliver analytics as a native feature within their products, creating premium feature tiers that generate analytics subscription revenue for non-BI software companies.
Market Segmentation Analysis
The report covers the following segments:
|
Segment Category |
Leading Segment |
Market Share |
Year |
|
Deployment |
Cloud-based |
61.7% |
2025 |
|
Component |
Software and Platform |
68.4% |
2025 |
|
End-Use Industry |
🔒 |
🔒 |
2025 |
|
Organization Size |
🔒 |
🔒 |
2025 |
|
Region |
South |
33.2% |
2025 |

By Deployment
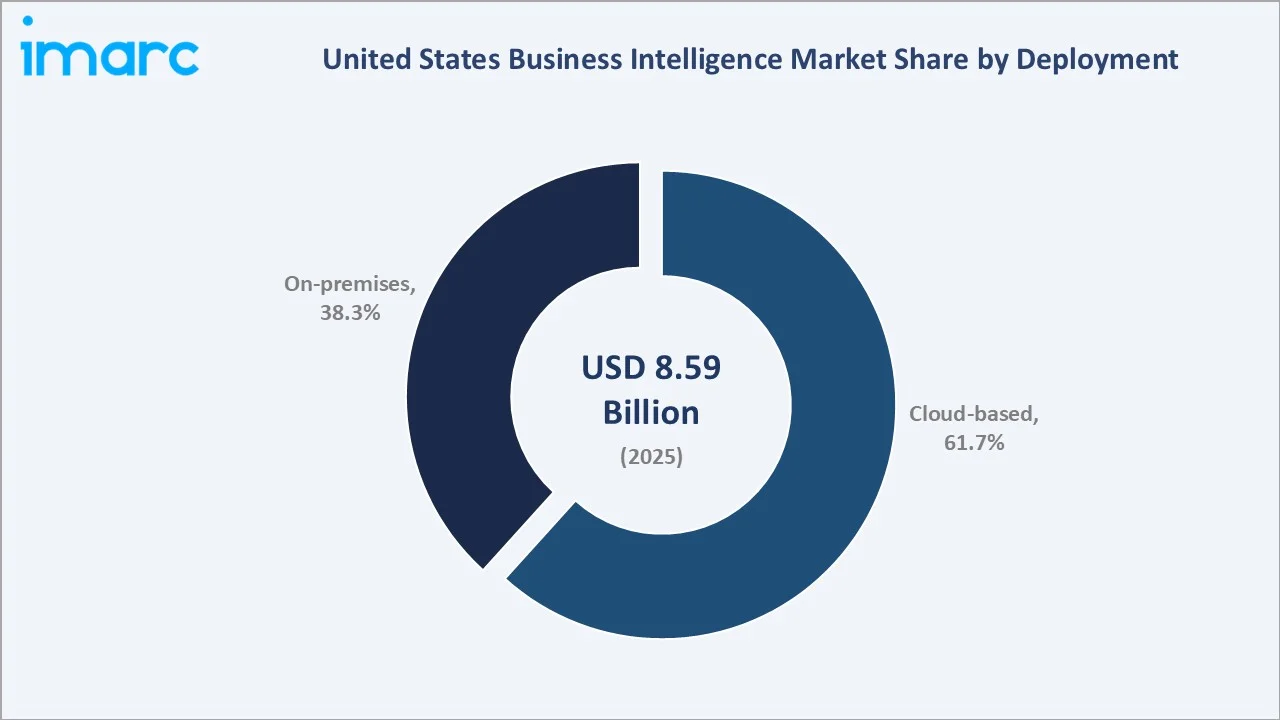
Cloud-based deployment dominates with a 61.7% share in 2025, reflecting the enterprise migration from legacy on-premises BI servers toward subscription-based cloud platforms that provide automatic feature updates, elastic scaling for peak reporting periods, and consumption-based pricing.
To access detailed market analysis, Request Sample
On-premises deployment represents 38.3% of the market, sustained by regulated industries that require complete physical control over BI infrastructure and cannot migrate to public cloud due to compliance, security classification, or latency requirements. On-premises BI remains the required deployment model for classified government analytics and for enterprises with multi-billion-row real-time databases.
By Component
Software and platform commands a 68.4% share in 2025, reflecting the capital-intensive nature of enterprise BI platform procurement. Microsoft Power BI Premium capacity licenses, Tableau Enterprise Server licenses, SAP BusinessObjects Enterprise, and IBM Cognos Analytics subscriptions represent multi-year, multi-million-dollar commitments that create durable recurring revenue for platform vendors regardless of professional services budget fluctuations.
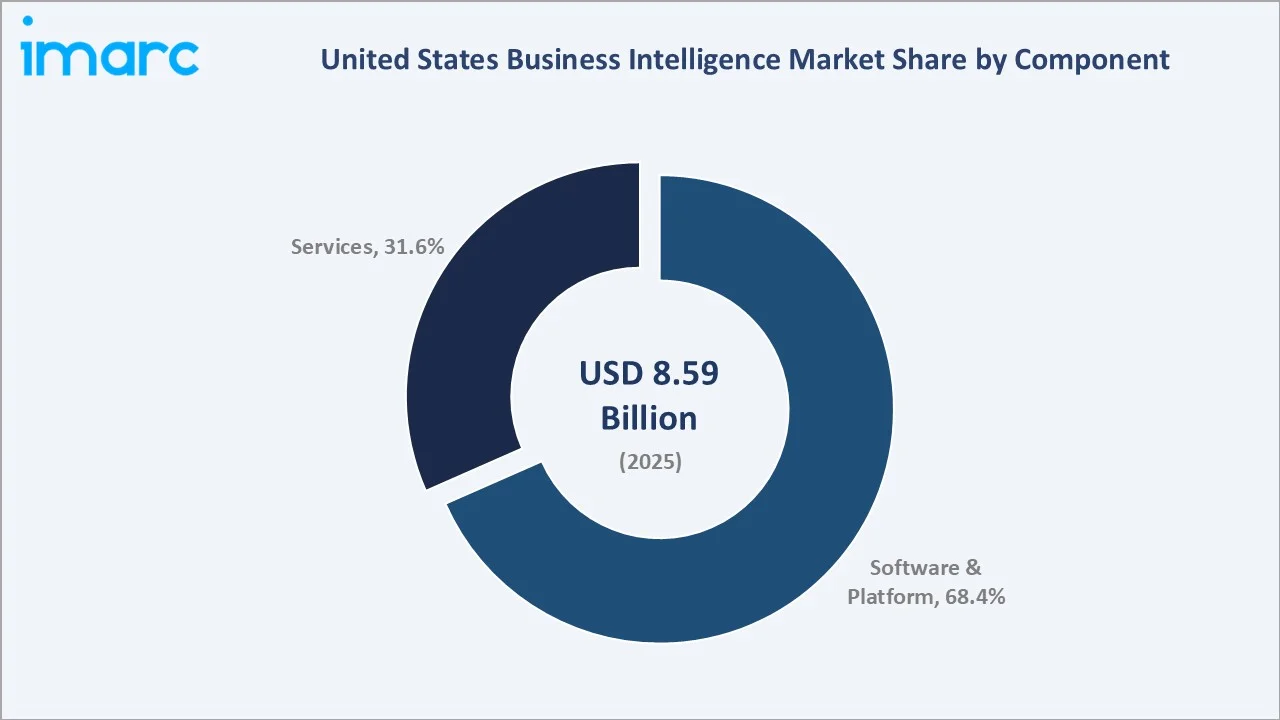
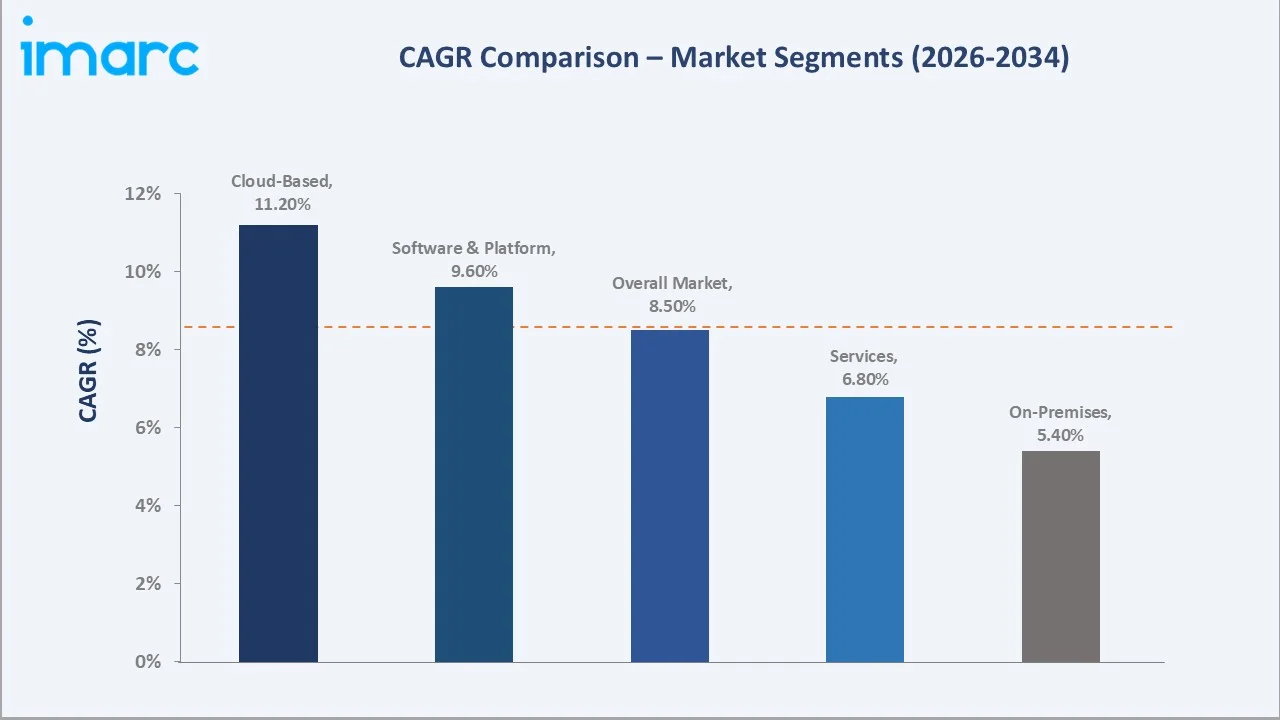
Services represent 31.6% share (2025) and are expected to grow at approximately 6.8% CAGR as enterprises increasingly engage BI consulting firms under multi-year managed analytics contracts rather than staffing expensive internal analytics teams in a tight data talent market.
Regional Market Insights
The South region's market leadership (33.2%, 2025) reflects the geographic diversification of US enterprise headquarters away from the traditional Northeast financial corridor toward Texas and Florida's business-friendly environments. The Dallas-Fort Worth metroplex hosts 50+ Fortune 500 company headquarters, creating a concentrated enterprise BI procurement market comparable in scale to Silicon Valley's technology sector spending.
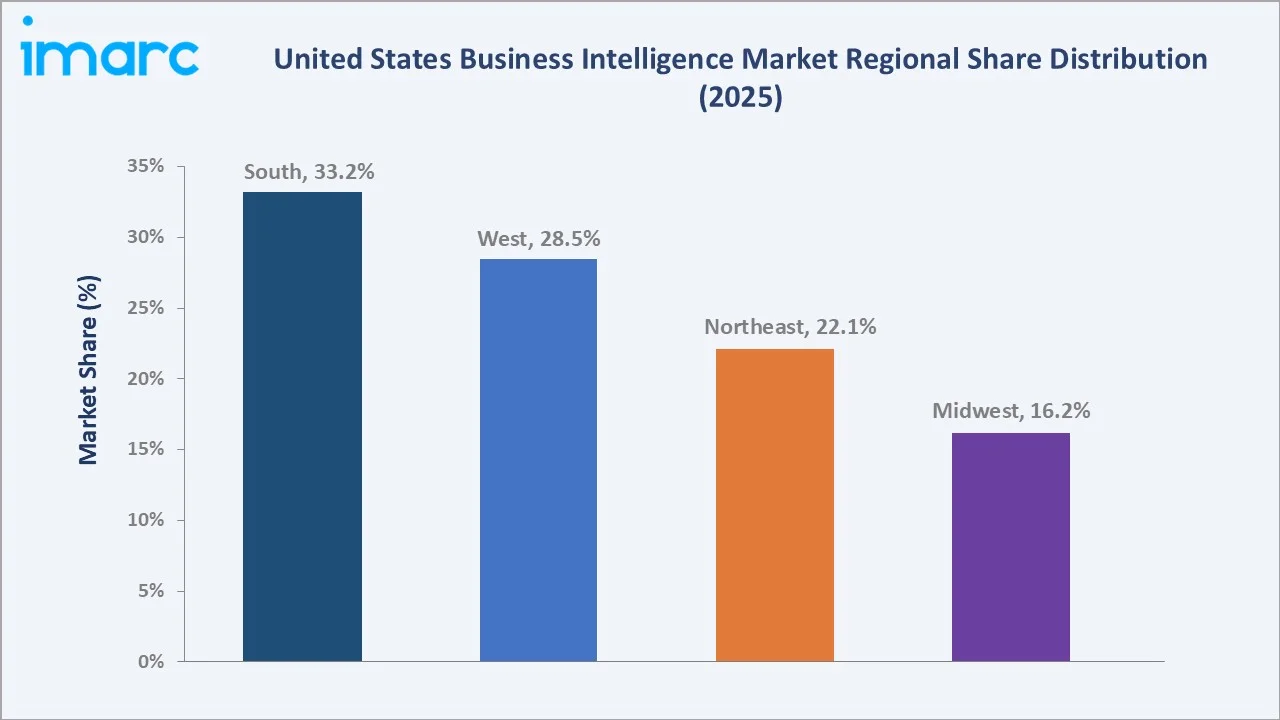
The West at 28.5% is distinguished by the highest per-enterprise BI sophistication level in the US, as Silicon Valley technology companies are early adopters of advanced analytics capabilities, including real-time streaming analytics, ML-augmented insights, and agentic analytics that subsequently propagate to mainstream enterprise adoption over 2–4 years.
|
Region |
Share (2025) |
Key Growth Drivers |
|
South |
33.2% |
Virginia federal government BI procurement; Texas financial services, energy, and telecom sector analytics investment; Florida healthcare and insurance industry data analytics programs |
|
West |
28.5% |
Silicon Valley technology company BI platform innovation and internal deployment; cloud infrastructure concentration; high-growth technology startup analytics adoption |
|
Northeast |
22.1% |
Financial services BI leadership from Wall Street and major US banks; healthcare analytics adoption; significant federal agency BI deployment; strong professional services firm analytics investment. |
|
Midwest |
16.2% |
Manufacturing and automotive sector operational analytics; major insurance and financial services company BI programs; growing healthcare analytics across major Midwest health systems; agricultural sector precision analytics adoption |
Competitive Landscape
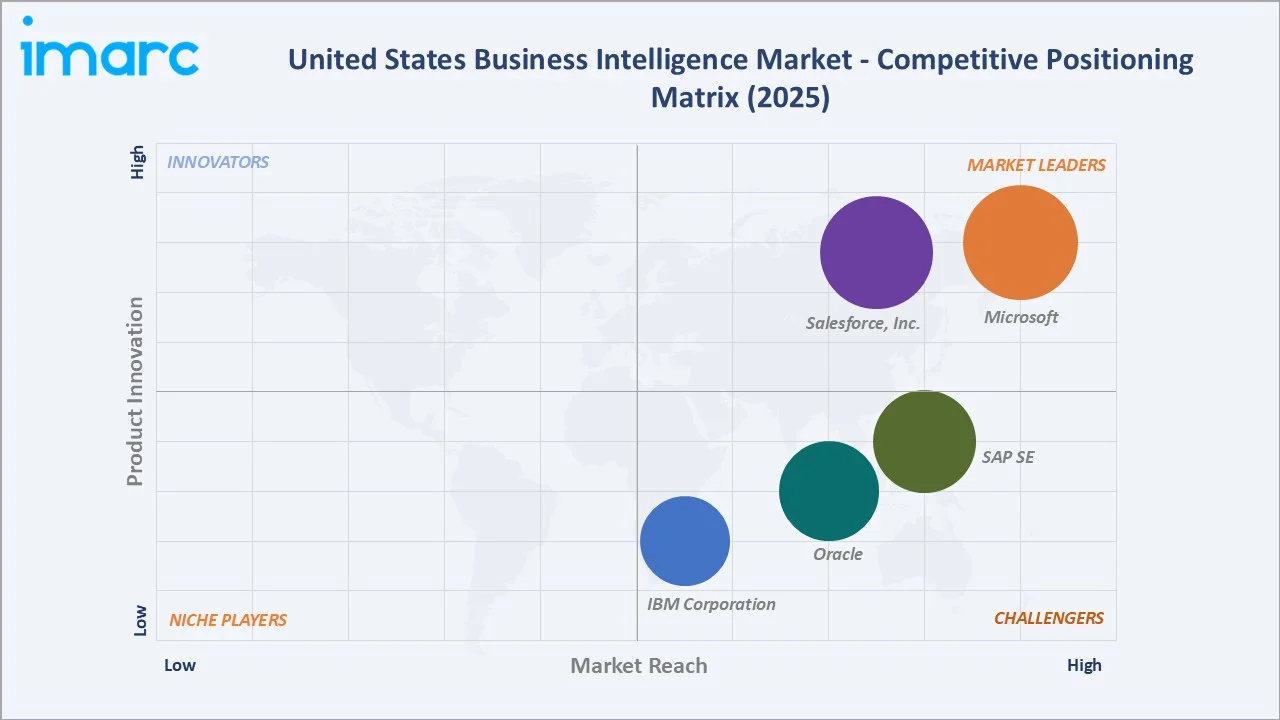
The US business intelligence market exhibits moderate concentration, with Microsoft leading by market share due to Power BI's Office 365 bundling advantage, followed by Salesforce, Inc., SAP SE, IBM Corporation, and Oracle completing the top five.
|
Company Name |
Product/Solutions |
Market Position |
Core Strength |
|
Microsoft |
Power BI, Power BI Embedded, Azure Analysis Services, Azure Synapse Analytics, Microsoft Fabric |
Market Leader |
Microsoft Fabric unified analytics ecosystem; Copilot AI integration; Office 365 user distribution advantage |
|
Salesforce, Inc. |
Tableau, Embedded Analytics, CRM Analytics, Marketing Intelligence, Sales Analytics |
Market Leader |
Tableau Einstein AI; development of new features annually; large user community and developer ecosystem |
|
SAP SE |
SAP BusinessObjects Business Intelligence suite |
Strong Challenger |
Deep ERP integration via BusinessObjects and SAP Analytics Cloud; enterprise finance and operations analytics leadership |
|
IBM Corporation |
IBM Cognos Analytics, IBM Business Analytics Enterprise |
Challenger |
Regulated industry and government BI expertise; IBM consulting delivery scale |
|
Oracle |
Oracle Business Intelligence Suite Enterprise Edition Plus Components, Oracle Analytics Cloud |
Strong Challenger |
Native Fusion ERP integration; Oracle Database competitive BI data source advantage |
The 2025 Gartner Magic Quadrant Leaders include Microsoft, Salesforce, Inc., Google, Qlik, Oracle, and ThoughtSpot, reflecting the competitive stability at the top while market share battles intensify in cloud migration and AI augmentation.
Key Company Profiles
Microsoft
Microsoft is one of the largest players in the US business intelligence market through the unparalleled distribution advantage of Power BI's integration into Microsoft 365 and the Microsoft Fabric unified analytics platform.
- Product Portfolio: Microsoft Power BI, Microsoft Fabric, Power BI Embedded, Azure Analysis Services, and Synapse Analytics.
- Strategic Focus: Microsoft Fabric ecosystem expansion; Copilot AI analytics democratization; Microsoft 365 Copilot to Power BI workflow integration.
Salesforce, Inc.
Salesforce, Inc., operates Tableau, which is one of the world's most widely used visual analytics platforms. Tableau's visual analytics methodology enables non-technical business users to create sophisticated data visualizations without SQL or programming knowledge.
- Product Portfolio: Tableau Desktop, Tableau Server, Tableau Cloud, Tableau Prep, Tableau Einstein AI, Tableau Pulse, Tableau Embedded Analytics, CRM Analytics, Marketing Intelligence, and Sales Analytics.
- Recent Developments: In May 2026, Salesforce, Inc. unveiled Tableau’s Agentic Analytics Platform, turning Tableau into a trusted enterprise knowledge and decision engine for AI-driven insights and actions. The platform combines a knowledge engine, conversational analytics, headless analytics, decision engine, agentic analytics command center, and governance tools to help AI agents deliver reliable, context-aware analytics across enterprise applications.
- Strategic Focus: Tableau Cloud SaaS migration; Einstein AI capability expansion; Salesforce CRM data integration for account analytics; Tableau Embedded analytics ISV channel development.
Market Concentration Analysis
The US business intelligence market is moderately concentrated, with Microsoft holding an estimated 25–30% revenue share through Power BI's Office 365 bundling advantage, followed by Salesforce, Inc. at 12–15%, SAP SE at 8–10%, IBM Corporation at 6–8%, and Oracle at 5–7%. The remaining 35–40% of market revenue is distributed across Qlik, Strategy, SAS Institute, Domo, ThoughtSpot, and 200+ specialized analytics vendors serving specific industries or use cases.
Microsoft's bundling strategy creates a structural competitive moat that is difficult for standalone BI vendors to overcome on pure economics, as enterprises already paying USD 35–55 per user monthly for Microsoft 365 receive Power BI Pro at no incremental cost. This bundling is the primary driver of Power BI's 50%+ penetration among US enterprises and is accelerating through Microsoft Fabric's expanded analytics capabilities that deliver advanced analytics previously requiring separate Tableau, Qlik, or SAP licenses.
Investment & Growth Opportunities
Fastest Growing Segments
Cloud-based BI (~11.2% CAGR), embedded analytics platforms (~20%+ CAGR), real-time operational analytics (~18% CAGR), and AI-native BI for natural language analytics (~25% CAGR) represent the highest-growth investment vectors through 2034. Together, these subcategories address a combined USD 8+ billion incremental addressable market opportunity within the US business intelligence ecosystem by 2030.
Emerging Market Expansion
United States business intelligence vendors are increasingly expanding into emerging markets by offering cloud-based, scalable, and cost-effective BI solutions for growing enterprises. Rising digital transformation, data-driven decision-making, and demand for real-time analytics across Asia Pacific, Latin America, and the Middle East are creating new growth opportunities for US BI providers.
Venture and Institutional Investment Trends
- Private equity consolidation of mid-market BI and analytics vendors is intensifying, with Thoma Bravo's ownership of Qlik and Symphony Technology Group's analytics portfolio collectively representing USD 20+ billion in private equity-backed BI platform investments.
- Corporate venture capital from Microsoft M12, Salesforce Ventures, GV, and Amazon's Alexa Fund is financing the next generation of AI-native analytics startups, creating an ecosystem of complementary tools that expand Microsoft and Salesforce, Inc.'s platform ecosystems while generating strategic intelligence about emerging analytics technology trajectories.
Future Market Outlook (2026-2034)
The United States business intelligence market is positioned for steady, sustained expansion through 2034. From a base of USD 8.59 Billion in 2025, the market is projected to reach USD 18.37 Billion by 2034, representing total incremental value creation of USD 9.78 billion at a CAGR of 8.50%.
This growth reflects the market's transition from expansion to deepening, where the primary growth driver shifts from new logo acquisition to user seat expansion, advanced analytics module upsell, and platform ecosystem extension.
By 2034, cloud-based BI will grow from 61.7% to approximately 75% of deployment share as on-premises BI reaches end-of-life for most non-regulated enterprise deployments. Natural language query will become the primary analytics interaction mode for business users, reducing the SQL and programming barriers that historically limited BI adoption to trained data professionals.
Research Methodology
Primary Research
Primary research comprised structured interviews with over 95 industry participants in 2024–2025, including BI platform executives, enterprise analytics directors, data engineering managers, BI consulting firm principals, and institutional investors across Texas, California, New York, and Virginia.
Secondary Research
Secondary research encompassed Gartner Magic Quadrant for Analytics and Business Intelligence Platforms (2024, 2025), Forrester Wave BI Platforms, vendor investor presentations, IDC US business intelligence market share data, and industry publications (Information Management, TDWI, DataIQ, BI-Survey).
Forecasting Models
Market size estimations incorporated US enterprise software spending surveys, BI platform license and subscription revenue data, cloud migration pace modeling, AI analytics adoption forecasts, and vendor revenue disclosures. A base-case CAGR of 8.50% reflects consensus estimates validated against Gartner and Forrester market sizing, vendor revenue growth trajectories, and enterprise IT budget allocation surveys from FY2020 to FY2025.
United States Business Intelligence Market Report Coverage:
| Report Features | Details |
|---|---|
| Base Year of the Analysis | 2025 |
| Historical Period | 2020-2025 |
| Forecast Period | 2026-2034 |
| Units | Billion USD |
| Scope of the Report |
Exploration of Historical Trends and Market Outlook, Industry Catalysts and Challenges, Segment-Wise Historical and Future Market Assessment:
|
| Components Covered | Software and Platform, Services |
| Deployments Covered | On-premises, Cloud-based |
| Organization Sizes Covered | Large Enterprises, Small and Medium-Sized Enterprises |
| End-Use Industries Covered | BFSI, IT and Telecommunication, Retail, Healthcare, Others |
| Regions Covered | Northeast, Midwest, South, West |
| Companies Covered | Microsoft, Salesforce Inc., SAP SE, IBM Corporation, Oracle, etc. |
| Customization Scope | 10% Free Customization |
| Post-Sale Analyst Support | 10-12 Weeks |
| Delivery Format | PDF and Excel through Email (We can also provide the editable version of the report in PPT/Word format on special request) |
Key Benefits for Stakeholders:
- IMARC’s industry report offers a comprehensive quantitative analysis of various market segments, historical and current market trends, market forecasts, and dynamics of the United States business intelligence market from 2020-2034.
- The research report provides the latest information on the market drivers, challenges, and opportunities in the United States business intelligence market.
- Porter's five forces analysis assist stakeholders in assessing the impact of new entrants, competitive rivalry, supplier power, buyer power, and the threat of substitution. It helps stakeholders to analyze the level of competition within the United States business intelligence industry and its attractiveness.
- Competitive landscape allows stakeholders to understand their competitive environment and provides an insight into the current positions of key players in the market.
Frequently Asked Questions About the United States Business Intelligence Market Report
The United States business intelligence market reached USD 8.59 Billion in 2025 and is projected to reach USD 18.37 Billion by 2034.
The market is expected to grow at a CAGR of 8.50% during 2026-2034, driven by cloud BI migration, AI augmented analytics integration, and expanding enterprise data-driven decision-making mandates.
The South region leads with a 33.2% share in 2025, anchored by Texas's Fortune 500 headquarters concentration, Virginia's federal government BI procurement, and Florida's financial services and healthcare analytics investment.
Cloud-based deployment dominates with a 61.7% share in 2025, reflecting enterprise migration from legacy on-premises BI to cloud-native SaaS platforms offering subscription pricing, automatic updates, and elastic scaling.
Software and platform hold the largest share at 68.4%, encompassing BI platform licenses, cloud subscriptions, embedded analytics SDKs, and data visualization tools that generate the majority of BI vendor recurring revenue.
Some of the key players include Microsoft, Salesforce, Inc., SAP SE, IBM Corporation, and Oracle.
Cloud-based BI is growing at ~11.2% CAGR as enterprises migrate legacy on-premises BI to Microsoft Fabric, Tableau Cloud, and Qlik Cloud SaaS platforms—reducing IT infrastructure costs, enabling automatic feature updates, and converting capital expenditure to predictable operational expenditure.
Key challenges include high implementation and integration costs for enterprise BI projects, data security and compliance concerns for cloud migration in regulated industries, a shortage of skilled data analysts, and legacy system integration complexity.
Embedded analytics platforms for SaaS ISVs, AI-native natural language BI tools, real-time operational analytics for manufacturing and logistics, federal government analytics modernization programs, and managed analytics outsourcing services represent the highest-growth investment opportunities through 2034.
Need more help?
- Speak to our experienced analysts for insights on the current market scenarios.
- Include additional segments and countries to customize the report as per your requirement.
- Gain an unparalleled competitive advantage in your domain by understanding how to utilize the report and positively impacting your operations and revenue.
- For further assistance, please connect with our analysts.
 Request Customization
 Speak to an Analyst
 Request Brochure
 Inquire Before Buying
Benefits of Customization
- Personalize this research
- Triangulate with your data
- Get data as per your format and definition
- Gain a deeper dive into a specific application, geography, customer, or competitor
- Any level of personalization
Get in Touch With Us
UNITED STATES
Phone: +1-201-971-6302
INDIA
Phone: +91-120-433-0800
UNITED KINGDOM
Phone: +44-753-714-6104
Email: [email protected]
Client Testimonials




.webp)




.webp)













Related Reports

Choose your plan
*Please note that the prices mentioned below are starting prices for each bundle type. Kindly contact our team for further details.*
Single User License
- 1 User License, Access on 2 Devices
- PDF Report + Excel Dataset (Password Protected)
- Lifetime Access
- No Printing Rights
- 10% Free Report Customization
- 10–12 Weeks of Analyst Support
Five User License
- Access for 5 Users, 2 Devices per User
- PDF Report + Excel Dataset (Password Protected)
- Lifetime Access
- Dedicated Account Manager
- 12–14 Weeks of Analyst Support
- No Printing Rights
- 15% Free Report Customization
- 25% Discount on Your Next Purchase
Corporate User License
- Unlimited User Access (Within Your Organization)
- PDF Report + Excel Dataset
- Lifetime Access
- Dedicated Account Manager
- 14–20 Weeks of Analyst Support
- No Printing Rights
- 20% Free Report Customization
- 30% Discount on Your Next Purchase
Essential Insights
What's included:
3 reports
- Lifetime Access
- PDF Reports
- Excel Datasets
- 2 Weeks of Free Analyst Support
- 2 User Licenses
- Access on 2 Devices
- Printing Rights
- Complimentary PowerPoint (PPT) Version
- Complimentary License Upgrade
Professional Access
What's included:
5 reports
- Lifetime Access
- PDF Reports
- Excel Datasets
- 8 Weeks of Free Analyst Support
- 2 User Licenses
- Access on 2 Devices
- Printing Rights
- Complimentary PowerPoint (PPT) Version
- Complimentary License Upgrade
Business Advantage
What's included:
8 reports
- Lifetime Access
- PDF Reports
- Excel Datasets
- 14 Weeks of Free Analyst Support
- 2 User Licenses
- Access on 2 Devices
- Printing Rights
- Complimentary PowerPoint (PPT) Version
- Complimentary License Upgrade
Enterprise Intelligence
What's included:
10 reports
- Lifetime Access
- PDF Reports
- Excel Datasets
- 20 Weeks of Free Analyst Support
- 2 User Licenses
- Access on 2 Devices
- Printing Rights
- Complimentary PowerPoint (PPT) Version
- Complimentary License Upgrade