
United States Business Travel Market Size, Share, Trends and Forecast by Type, Purpose Type, Expenditure, Age Group, Service Type, Travel Type, End User, and Region, 2026-2034
United States Business Travel Market Size, Share, Trends & Forecast (2026-2034)
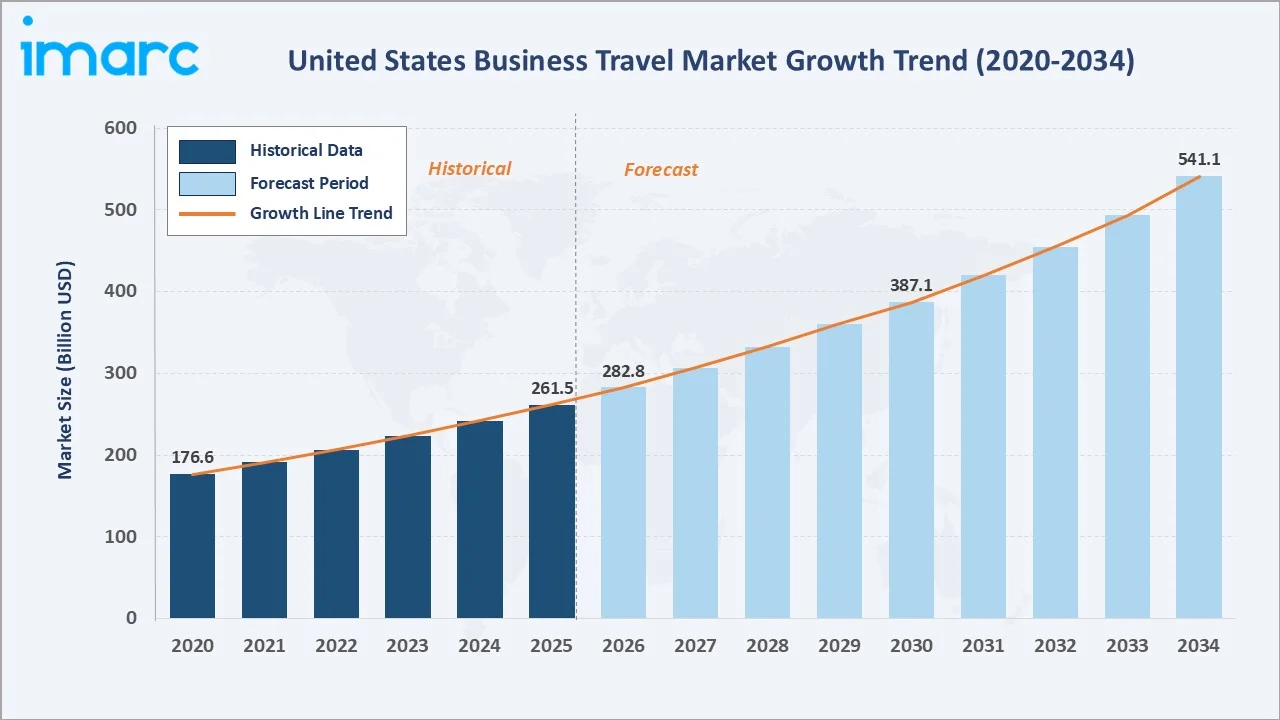
The United States business travel market grew from USD 261.5 Billion in 2025 to USD 282.8 Billion in 2026 and is projected to reach USD 541.1 Billion by 2034, growing at a CAGR of 8.16% during 2026-2034. The market is driven by robust post-COVID recovery in face-to-face meetings and events, corporate expansion and globalization, and the rising bleisure travel trend extending trip durations and spending. Business travel supports approximately 6.7 million jobs across the United States and contributes around 2.1% to the country’s GDP. This significant economic contribution is supporting the growth of the market, as corporate trips generate demand across airlines, hotels, ground transportation, restaurants, meeting venues, and other travel-related services. Unmanaged business travel leads at 57.5% by type, marketing dominates at 30.5% by purpose, and the South commands the largest regional share at 35.5%.
Market Snapshot
|
Metric |
Value |
|
Base Year Market Size (2025) |
USD 261.5 Billion |
|
Market Size (2026) |
USD 282.8 Billion |
|
Forecast Market Size (2034) |
USD 541.1 Billion |
|
CAGR (2026-2034) |
8.16% |
|
Base Year |
2025 |
|
Historical Period |
2020-2025 |
|
Forecast Period |
2026-2034 |
|
Dominant Type |
Unmanaged Business Travel (57.5%, 2025) |
|
Dominant Purpose Type |
Marketing (30.5%, 2025) |
|
Leading Region |
South (35.5%, 2025) |
The US business travel market experienced dramatic disruption through COVID-19 in 2020, with the market declining sharply from pre-pandemic levels before beginning a sustained recovery. From the low point, the market has grown from USD 176.6 Billion in 2020 to USD 261.5 Billion by 2025 and is estimated to reach USD 282.8 Billion in 2026. The market is projected to reach USD 387.1 Billion by 2030 and USD 541.1 Billion by 2034.
To get more information on this market, Request Sample
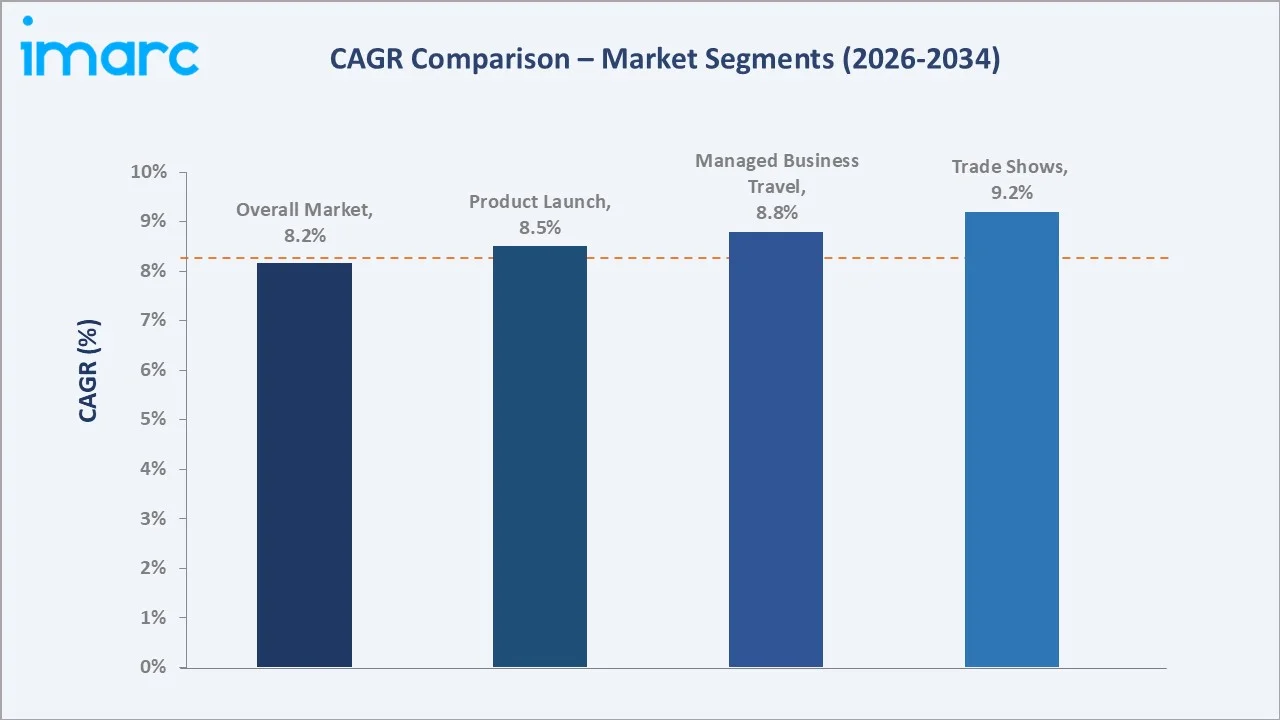
Trade shows grow at ~9.2% CAGR through in-person event resurgence and exhibition market expansion. Managed business travel grows at ~8.8% CAGR through corporate program adoption and TMC technology investment. Product launch travel grows at ~8.5% CAGR through brand activation and experiential marketing events.
Executive Summary
The United States business travel market is experiencing a compelling and sustained recovery narrative that has progressively surpassed pre-pandemic levels and established a new growth trajectory underpinned by structural changes in how American businesses use travel as a strategic commercial tool. The COVID-19 pandemic forced a historic experiment in virtual work and digital business interaction, and while video conferencing proved capable of maintaining routine communication, it simultaneously confirmed the irreplaceable commercial value of in-person meetings for relationship building, complex deal negotiations, creative collaboration, and high-stakes client engagement. Unmanaged business travel leads at 57.5% through the vast number of small and mid-sized businesses operating without formal TMC programs. Marketing at 30.5% leads by purpose through brand investment in in-person customer engagement. South leads regionally at 35.5%.
Key Market Insights
|
Insight |
Data |
|
Dominant Type |
Unmanaged Business Travel - 57.5% share (2025) |
|
Dominant Purpose Type |
Marketing - 30.5% share (2025) |
|
Leading Region |
South - 35.5% (2025) |
|
Key Growth Driver |
Post-COVID face-to-face business engagement rebound and bleisure trend |
Key Analytical Observations Supporting the Above Data:
- Unmanaged Business Travel at 57.5%: Unmanaged business travel dominates because the vast majority of US business travel is generated by small and medium-sized enterprises (SMEs) that operate without formal corporate travel management programs or TMC contracts. Individual business travelers in these organizations book directly through consumer-facing airline, hotel, and car rental platforms without centralized policy enforcement, preferred vendor negotiation, or duty-of-care monitoring.
- Marketing at 30.5%: Marketing leads through the US corporate sector's large investment in sales and marketing activities requiring in-person customer engagement, client visits, prospect meetings, account management, sales conference attendance, and trade show participation where personal relationship development and product demonstration drive commercial outcomes that digital channels cannot replicate at equivalent effectiveness.
- South leads at 35.5%: The South's regional leadership reflects the rapid corporate relocation to Texas, Florida, North Carolina, Georgia, and Tennessee over the past decade, with companies establishing major Southern headquarters and operations.
United States Business Travel Market Overview
The United States business travel market encompasses all travel expenditure incurred for business purposes by US-based travelers, including transportation (air, rail, ground), lodging, food and dining, car rental, conference and event registration, entertainment, and incidental expenses. The market serves corporate (private sector) and government (public sector) end users across managed business travel programs administered by travel management companies (TMCs) and unmanaged self-booking by individual employees. Business travel purpose categories include marketing and sales activities, internal meetings and team collaboration, trade show participation and exhibitions, product launch and brand activation events, training and education, and other business purposes.
Market Dynamics
To evaluate market opportunities, Request Sample
Market Drivers
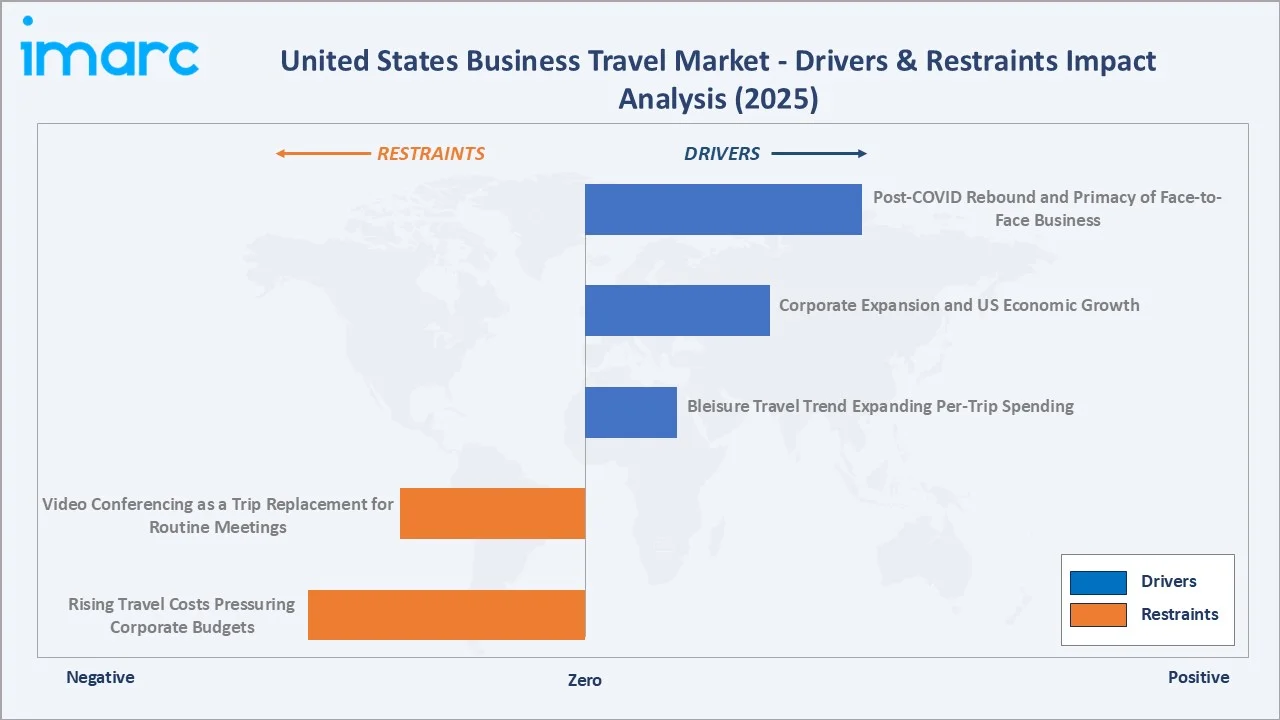
- Post-COVID Rebound and Primacy of Face-to-Face Business: The COVID-19 pandemic demonstrated both the capabilities and limitations of virtual business communication. While video conferencing proved viable for routine meetings, American corporations have affirmed that in-person meetings deliver superior outcomes for relationship development, complex negotiations, creative brainstorming, and high-stakes sales engagement. The return to business travel has been accompanied by elevated quality-of-purpose standards, resulting in higher average spend per trip as travelers prioritize quality experiences for genuinely important business occasions.
- Corporate Expansion and US Economic Growth: According to the Global Business Travel Association (GBTA), business travel generated an estimated USD 623.8 billion in total GDP impact, supported by approximately USD 538.5 billion in associated travel spending. US GDP growth, historically correlated with business travel spending, sustains the underlying demand fundamentals. The robust performance of technology, financial services, healthcare, and professional services sectors provides structural market support through economic cycles.
- Bleisure Travel Trend Expanding Per-Trip Spending: The bleisure travel phenomenon, where business travelers extend trips for personal leisure at the destination, is significantly expanding average per-trip total spending beyond the pure business purpose components. Airlines, hotels, and destination businesses are actively targeting bleisure extension spending with specific loyalty rewards, flexible rate programs, and experience marketing that expands the commercial opportunity of each business travel occasion.
Market Restraints
- Video Conferencing as a Trip Replacement for Routine Meetings: Mature video conferencing platforms have permanently absorbed a portion of business meetings that previously required travel, particularly short-haul internal team meetings, routine client check-ins, and informational presentations where physical presence provides marginal additional value relative to the travel cost and time investment. Corporate travel policies increasingly mandate virtual meetings by default for shorter-distance and lower-stakes meeting types, maintaining a structural suppression of some trip categories relative to pre-pandemic levels.
- Rising Travel Costs Pressuring Corporate Budgets: US airfare, hotel rates, and ground transportation costs have increased substantially post-pandemic, driven by airline capacity management strategies, hotel pricing power in supply-constrained markets, and general inflation. These rising costs are creating budget pressure on corporate travel programs - particularly for mid-market companies with limited negotiating leverage with suppliers, resulting in stricter pre-trip approval processes, downgraded class of service policies, and more frequent trip consolidation mandates that can suppress volume growth.
Market Opportunities
- AI-Powered Travel Management and Expense Automation: AI travel management platforms are enabling corporations to dramatically improve travel program efficiency through automated policy compliance checking, real-time budget forecasting, predictive supplier pricing recommendations, and integrated expense report automation. These technology investments improve travel program ROI measurement, reduce administrative burden, and create data visibility that enables more strategic travel investment decisions, driving adoption among mid-market companies previously unable to afford full-service TMC programs.
- Sustainable Business Travel and Corporate Carbon Management: Travel management companies and technology platforms that develop credible sustainable travel programs gain competitive differentiation in corporate procurement decisions where sustainability credentials are increasingly weighted. In June 2026, Sustainable Travel International introduced Humí, an AI-powered tool that rapidly converts tour itineraries into carbon emissions reports, eliminating time-consuming manual data collection and spreadsheet-based calculations.
Market Challenges
- Duty of Care and Traveler Safety Program Complexity: Corporate employers' legal and ethical obligation to maintain duty of care for employees traveling on company business is growing in complexity as geopolitical instability, natural disasters, health emergencies, and travel disruptions create unpredictable risk environments. Building comprehensive traveler tracking, risk alert communication, and emergency response capabilities that satisfy duty of care standards requires ongoing technology and operational investment from both corporate travel programs and their TMC partners.
- Reconciling Travel Policy with Traveler Autonomy Expectations: Post-pandemic business travelers have developed strong preferences for consumer-grade digital booking experiences, loyalty program optimization, and personal preference accommodation that can conflict with corporate travel policy compliance requirements. Balancing employee satisfaction and productivity with cost control and policy adherence creates ongoing tension in corporate travel program management that TMCs and technology platforms must continually address.
Emerging Market Trends
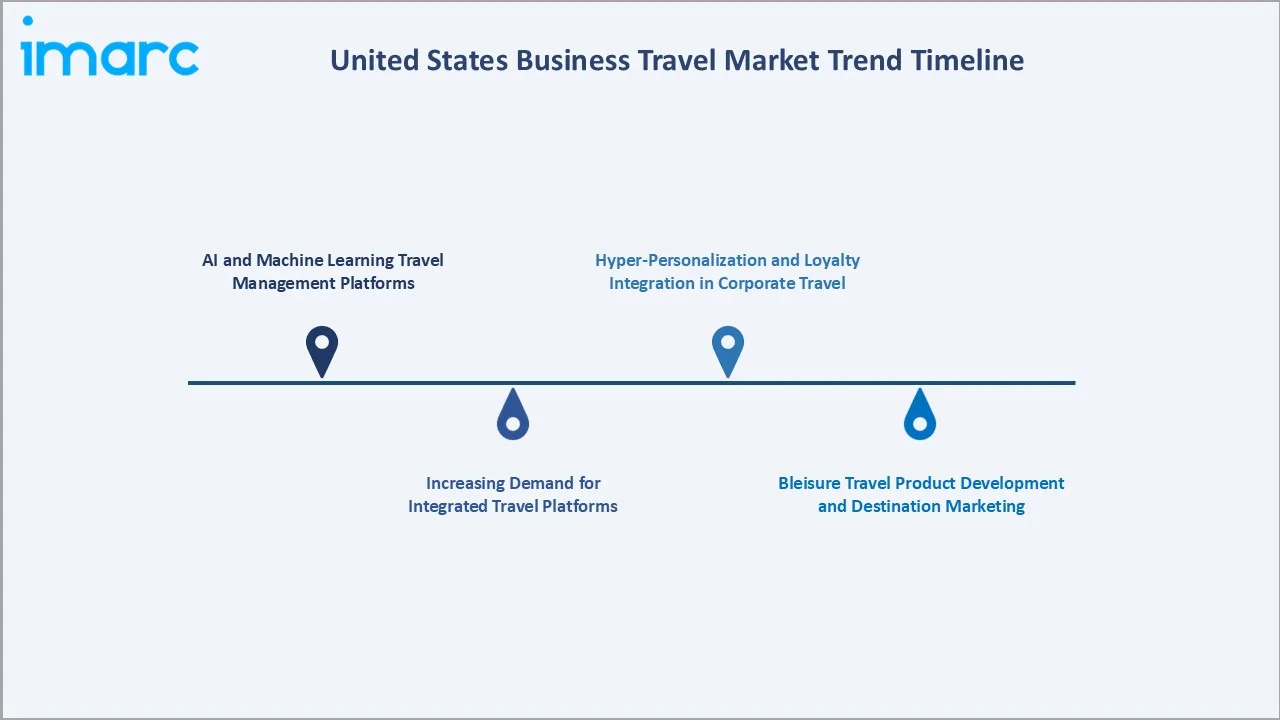
1. AI and Machine Learning Travel Management Platforms
The US corporate travel management market is being transformed by AI-native platforms that apply machine learning to optimize booking decisions, predict supplier pricing, enforce policy compliance in real time, and automate expense reporting. Unlike traditional TMC models built on phone and email service, these AI platforms provide self-service booking experiences comparable to consumer travel apps while maintaining corporate policy guardrails. Predictive analytics identify cost-saving opportunities through advance booking recommendations, preferred vendor routing, and trip consolidation suggestions.
2. Increasing Demand for Integrated Travel Platforms
Corporations are seeking centralized platforms that combine booking, expense management, reporting, traveler support, and supplier data. In August 2026, Brand USA, the official destination marketing organisation for the United States, launched a redesigned corporate website to provide easier access to its programmes, research, economic impact data, and industry resources. The revamped TheBrandUSA.com platform allows travel partners, media representatives, and government stakeholders to access relevant information and resources without requiring a login. The trend is being driven by persistent challenges associated with fragmented travel data and inconsistent booking experiences.
3. Hyper-Personalization and Loyalty Integration in Corporate Travel
Business travelers' sophisticated loyalty program management, accumulated airline miles, hotel points, and rental car status across multiple programs, is creating growing demand for corporate travel platforms that accommodate personal loyalty optimization within policy boundaries. Airlines and hotels are developing business traveler-specific products (premium economy class expansion, enhanced business amenity programs) that address the unique needs of the frequent US business traveler who values time efficiency, comfort, and productivity enablement.
4. Bleisure Travel Product Development and Destination Marketing
US airlines, hotels, and destination marketing organizations are developing explicit bleisure travel products and marketing programs that target business travelers seeking to extend trips for personal leisure. Major hotel brands offer weekend leisure rate extensions from business rate bases, and residential-style hotel room designs with in-room kitchen facilities and wellness amenities that accommodate longer bleisure stays. Destination convention and visitors’ bureaus increasingly market bleisure extensions to conference and trade show attendees.
Industry Value Chain Analysis
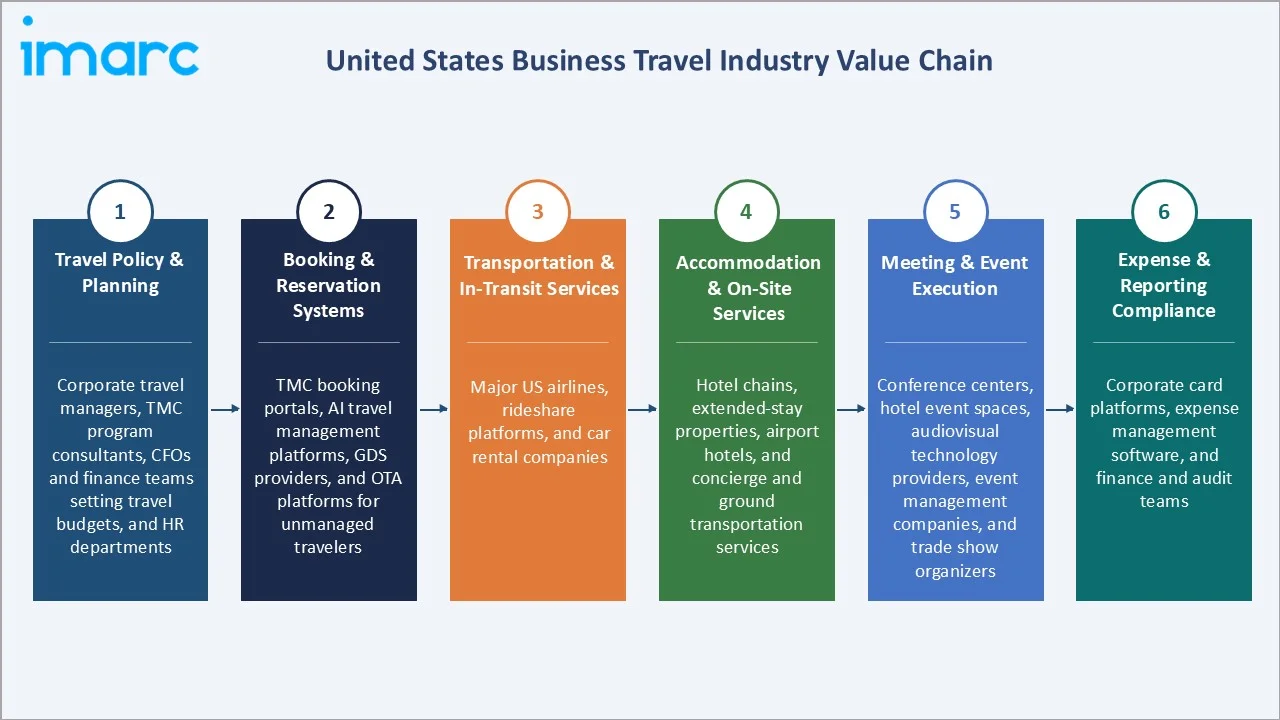
The United States business travel value chain integrates corporate travel policy and planning, booking and reservation systems, transportation and in-transit services, accommodation and on-site services, meeting and event execution, and expense reporting and compliance across managed and unmanaged business travel program categories.
|
Stage |
Key Participants |
|
Travel Policy & Planning |
Corporate travel managers, TMC program consultants, CFOs and finance teams setting travel budgets, and HR departments. |
|
Booking & Reservation Systems |
TMC booking portals, AI travel management platforms, GDS providers, and OTA platforms for unmanaged travelers. |
|
Transportation & In-Transit Services |
Major US airlines, rideshare platforms, and car rental companies. |
|
Accommodation & On-Site Services |
Hotel chains, extended-stay properties, airport hotels, and concierge and ground transportation services. |
|
Meeting & Event Execution |
Conference centers, hotel event spaces, audiovisual technology providers, event management companies, and trade show organizers. |
|
Expense & Reporting Compliance |
Corporate card platforms, expense management software, and finance and audit teams. |
Booking and reservation systems represent the most strategically contested stage in the US business travel value chain, as the capture of booking data enables downstream value creation through expense integration, duty of care tracking, supplier contract compliance measurement, and carbon reporting. TMCs and travel technology platforms compete intensely for corporate booking channel control as the entity that captures the booking transaction controls the data flow, supplier rebate entitlement, and service fee revenue that fund TMC business models.
Technology Landscape in the United States Business Travel Industry
AI-Powered Corporate Travel Management Platforms
The US corporate travel management technology sector is undergoing generational disruption as AI-native platforms challenge the traditional TMC model. In August 2026, FCM Travel introduced an AI-powered conversational booking feature that provides personalized travel options based on traveler policies, profiles, past trips, loyalty preferences, and preferred routes, helping reduce booking time and improve the overall booking experience.
Sustainability and Carbon Management Technology
Sustainability and carbon management technologies are gaining traction in the United States business travel market as companies seek to measure and reduce travel-related emissions. Advanced platforms enable businesses to calculate carbon footprints across flights, hotels, and ground transportation and incorporate emissions data into booking decisions. AI-powered carbon tracking and reporting tools are further helping companies align corporate travel programs with broader sustainability and emissions-reduction goals.
Payments and Expense Management Innovation
The US corporate payments and expense management market is being rapidly innovated by fintech companies, including integrated expense products that combine corporate cards with AI-powered expense categorization, policy enforcement, and real-time budget visibility. These integrated travel and expense (T&E) platforms eliminate the traditional disconnect between booking systems and expense reporting, reducing expense report cycle time from weeks to hours and dramatically improving finance team visibility into travel spend. Virtual card technology enables single-use payment numbers for each business travel booking, simplifying reconciliation and reducing fraud exposure from travel card data breaches.
Market Segmentation Analysis
The report covers the following segments:
|
Segment Category |
Leading Segment |
Market Share |
Year |
|
Type |
Unmanaged Business Travel |
57.5% |
2025 |
|
Purpose Type |
Marketing |
30.5% |
2025 |
|
Expenditure |
Lodging |
🔒 |
2025 |
|
Age Group |
Travelers Below 40 Years |
🔒 |
2025 |
|
Service Type |
Food and Lodging |
🔒 |
2025 |
|
Travel Type |
Group Travel |
🔒 |
2025 |
|
End User |
Corporate |
🔒 |
2025 |
|
Region |
Midwest |
27.5% |
2025 |

By Type
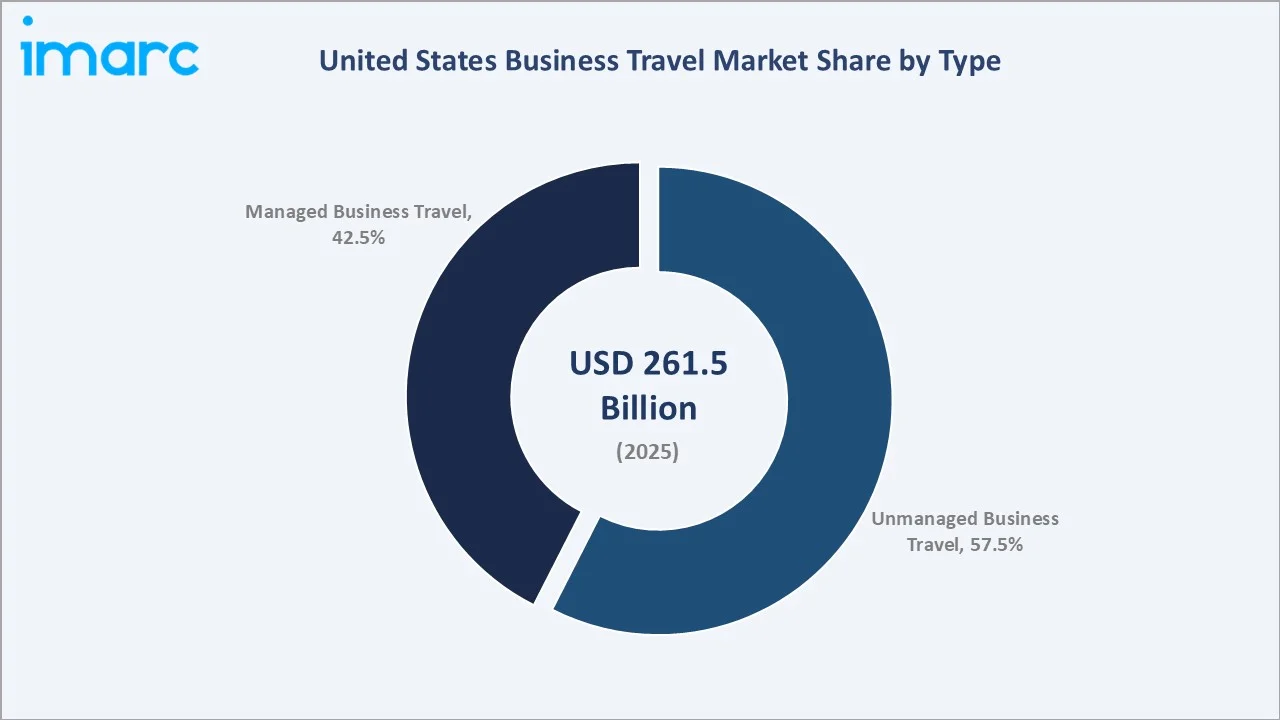
Unmanaged business travel leads at 57.5% (2025), through the dominance of US small and medium-sized businesses that operate without formal corporate travel management programs, booking directly through consumer platforms without centralized policy enforcement or preferred vendor contracts.
To access detailed market analysis, Request Sample
Managed business travel at 42.5% represents the enterprise segment where large corporations implement formal travel management programs through TMC partnerships with negotiated airline, hotel, and car rental rates, centralized booking compliance, duty of care tracking, and consolidated reporting. The managed segment is growing at ~8.8% CAGR as mid-market companies adopt AI travel management platforms that deliver enterprise-grade program management without full TMC contract complexity.
By Purpose Type
Marketing leads at 30.5% (2025), as US corporations' large sales and marketing organizations drive the highest volume of business travel through client visits, prospect meetings, sales conference attendance, and trade show participation where in-person engagement remains the highest-converting commercial activity.
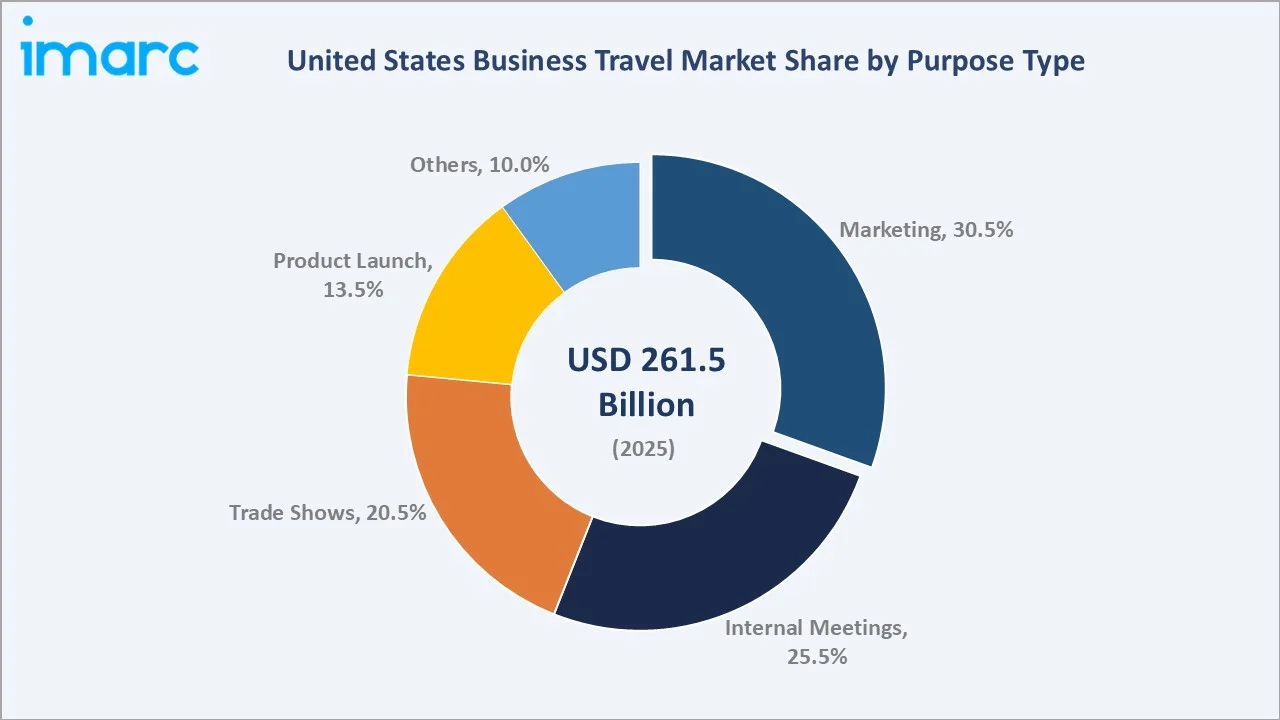
Internal meetings at 25.5% serve intra-company collaboration, leadership team gatherings, annual sales kickoffs, and cross-departmental project teams where physical co-location delivers creative and strategic collaboration outcomes superior to virtual alternatives. Trade shows at 20.5% generate substantial travel demand through the thousands of annual US industry events that attract hundreds of thousands of participant trips. Product launch at 13.5% reflect brand activation and experiential marketing event travel. Others at 10.0% include training, site visits, and recruiting.
Regional Market Insights
|
Region |
Share (2025) |
Key United States Business Travel Market Drivers & Characteristics |
|
South |
35.5% |
Reflecting rapid corporate relocation and expansion and emerging major business travel hubs alongside strong energy, finance, and technology sector corporate bases. |
|
Midwest |
27.5% |
Reflecting Chicago's status as a major corporate headquarters city and the largest US convention market, and financial and healthcare sector business travel demand. |
|
West |
21.5% |
Reflecting the San Francisco Bay Area's technology industry generating massive corporate travel volumes and the broader Pacific Coast technology and trade corridor. |
|
Northeast |
15.5% |
Reflecting New York City's extraordinary concentration of financial services, media, professional services, and pharmaceutical headquarters generating premium business travel. |
The South's 35.5% leadership reflects the decade-long corporate migration to Sun Belt states that have repositioned as major US business centers. The Midwest's 27.5% is anchored by Chicago and the concentrated headquarters base of Illinois, Ohio, Michigan, and Minnesota.
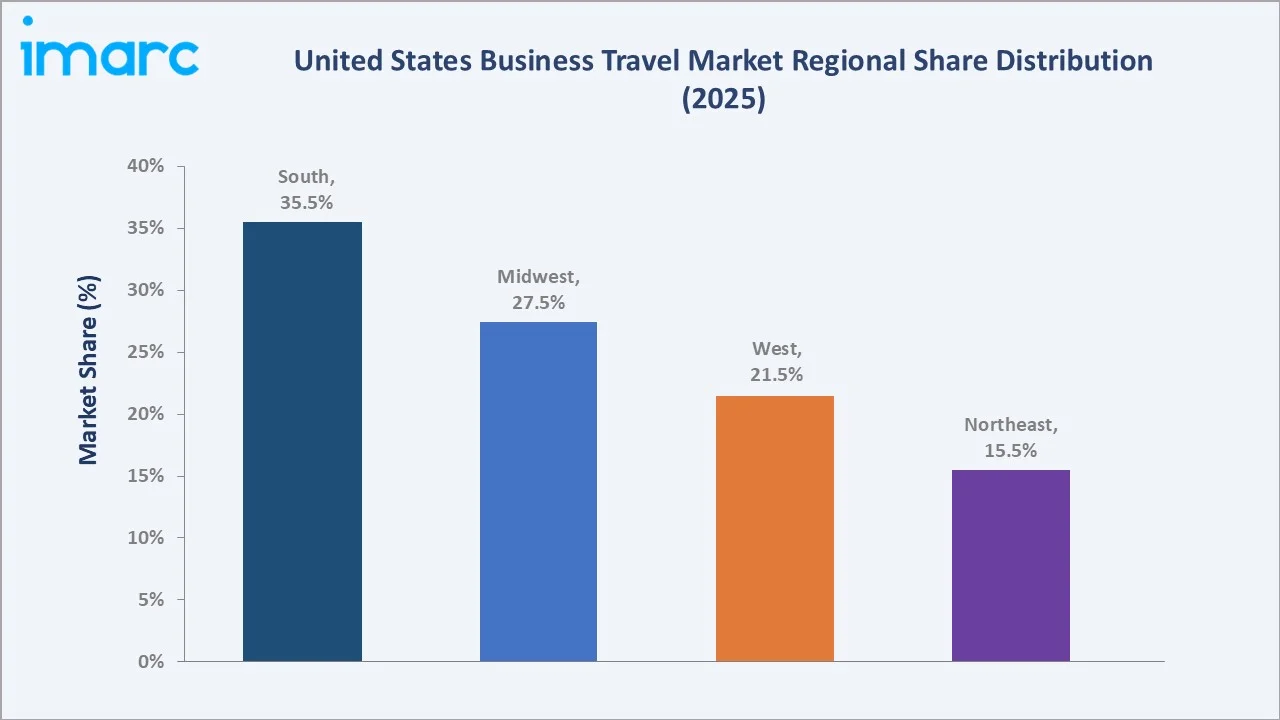
The West's 21.5% is dominated by the San Francisco Bay Area's technology industry, which collectively generates the US's highest per-employee business travel spending, as technology companies maintain global operations requiring frequent cross-border travel. The Northeast's 15.5% reflects the highest average revenue-per-trip in the US market, driven by financial services executives, New York-based corporate headquarters, and premium business travel rates at New York, Boston, and Washington DC gateway airports and hotels.
Competitive Landscape
The US business travel market features a competitive ecosystem spanning global travel management companies (TMCs), technology-first AI travel platforms, major airlines with corporate programs, hotel chains with business loyalty products, and car rental companies. The TMC segment is consolidating around global scale leaders while technology disruptors challenge traditional service models with AI-native platforms. Competition is driven by corporate client relationships, technology capability, supplier negotiating scale, global reach, and duty of care capabilities.
|
Company |
Key Offerings |
Market Position |
Core Strength |
|
BCD Group |
Booking & trip management, Program & payment insights, Meetings & events, Consulting |
Market Leader |
BCD Group operates as a major corporate travel management company (TMC) that helps US and multinational businesses manage travel spending, ensure employee safety, and streamline logistics. |
|
Flight Centre Travel Group Limited |
FCM Platform, Travel Management, Meetings & Events, Consulting |
Established Player |
Flight Centre Travel Group Limited (FCTG) manages corporate travel in the US through specialized business divisions that cater to companies of all sizes. |
|
SAP SE |
SAP Concur |
Market Leader |
SAP SE shapes US business travel primarily through SAP Concur, its flagship platform for integrated trip booking, policy compliance, and automated expense management. |
|
Navan |
Business Travel & Expense Management |
Established Player |
Navan acts as a unified, AI-powered platform that combines corporate travel booking, real-time expense tracking, and corporate card management to streamline business travel for US companies. |
|
Marriott International, Inc. |
Marriott Bonvoy |
Innovator |
Marriott International, Inc. plays a major role in US business travel by providing nationwide corporate lodging, workspace-optimized hotel brands, and integrated travel management tools like Business Access by Marriott Bonvoy. |
Companies across the competitive landscape are investing in AI travel management technology, sustainability program capabilities, mobile-first traveler experience platforms, and integrated payments and expense automation. The market is expected to see continued consolidation among traditional TMCs alongside rapid growth from AI-native travel management platforms targeting the underserved US mid-market corporate segment.
Key Company Profiles
BCD Group
BCD Group operates in the market through its BCD Travel. The company provides business travel management solutions covering travel planning, booking, expense optimization, traveler support, and meetings and events. Its technology-enabled approach helps corporate clients improve travel program efficiency, manage costs, and enhance traveler experiences.
- Key Offerings: Booking & trip management, Program & payment insights, Meetings & events, Consulting.
- Strategic Focus: Centers on expanding technology-enabled travel management, improving traveler experience, and helping corporate clients optimize costs and compliance. The company also emphasizes digital innovation, data-driven decision-making, and sustainable travel solutions.
Navan
Navan, the corporate travel and expense management company, represents the most consequential technology disruption in the US business travel management market in decades. Navan's AI continuously personalizes travel options to individual traveler preferences within corporate policy guardrails, dramatically improving both traveler satisfaction and policy compliance rates simultaneously - historically perceived as competing objectives in corporate travel management. The company's approach of replacing traditional travel-then-expense workflows with a single integrated transaction platform has been recognized as the structural future of corporate T&E management.
- Key Offerings: Business Travel & Expense Management.
- Strategic Focus: Expanding Navan's US market penetration beyond its initial technology company customer base into traditional enterprise sectors including financial services, healthcare, and manufacturing where legacy TMC contracts represent conversion opportunities, developing Navan's international expansion capabilities to serve US multinational clients' global travel programs, and advancing AI trip prediction and proactive booking recommendation capabilities that anticipate travel needs before employees request trips.
Market Concentration Analysis
The US business travel market is moderately concentrated at the managed travel segment level. The technology platform segment is more competitive, with SAP Concur's incumbent enterprise position challenged by Navan and multiple AI-native platforms. The unmanaged segment, which represents 57.5% of total market value, is highly fragmented across direct airline, hotel, and car rental bookings without meaningful aggregation. Market concentration in managed travel is expected to moderate through 2034 as AI platforms enable mid-market companies to implement structured travel programs without traditional TMC contracts.
Investment & Growth Opportunities
Highest Growth Segments
Trade shows and exhibitions (~9.2% CAGR), managed business travel AI platform adoption (~8.8% CAGR), product launch and experiential marketing travel (~8.5% CAGR), sustainable travel management technology, bleisure travel ancillary service development, and government travel modernization represent the highest-growth investment vectors in the US business travel market through 2034.
Investment Themes
- AI travel management platform for US SME market: The 57.5% unmanaged travel segment represents a vast opportunity for AI travel management platforms that can deliver structured travel program benefits to the millions of US SMEs currently booking without policy management, preferred vendor leverage, or data visibility. Platforms that achieve a consumer-grade booking experience with enterprise policy automation at SME-accessible pricing can capture a structurally underserved market that represents hundreds of billions in annual spend without systematic management.
- Sustainable travel technology and carbon management: Corporate sustainability mandates are creating immediate demand for sustainable business travel measurement, management, and reduction technology. Building accurate carbon calculation, sustainable aviation fuel purchasing programs, and reporting capabilities positions technology platforms for the regulatory compliance requirement that is progressively embedding in corporate travel program specifications as large mid-market companies formalize their net-zero commitments.
Future Market Outlook (2026-2034)
The United States business travel market is projected to grow from USD 261.5 Billion in 2025 to USD 282.8 Billion in 2026, reaching USD 541.1 Billion by 2034, exhibiting a CAGR of 8.16% during 2026-2034. The market is projected to reach an anchor value of USD 387.1 Billion by 2030, representing the mid-period milestone at which post-pandemic recovery achieves structural maturity and the bleisure, sustainable travel, and AI management platform trends become mainstream corporate program components.
Three structural forces will define the US business travel market through 2034. First, the irreplaceable commercial value of in-person business engagement will sustain travel demand as the foundation of B2B commerce in the United States. Second, the structural shift from COVID-era virtual business interaction back toward in-person preference has established a new equilibrium that sustains elevated business travel spending. Third, technology innovation will progressively expand the US business travel market's addressable scope by enabling millions of SMEs currently managing travel without systematic programs to access structured travel management through AI platforms.
Research Methodology
Primary Research
Primary research comprised in-depth interviews with corporate travel managers, TMC business development executives, travel technology company product leaders, airline and hotel corporate sales directors, and business travel industry analysts. These discussions validated market size estimates, assessed travel type and purpose demand dynamics, evaluated competitive positioning, and provided insights into technology innovation and future market evolution.
Secondary Research
Secondary research encompassed annual business travel survey data, air travel statistics, Hotel Association of America corporate segment data, company annual reports and press releases, business travel deduction statistics, and industry publications covering US business travel market developments.
Forecasting Models
Forecasting models incorporated historical business travel spending trends, US GDP and corporate revenue growth correlations, technology adoption curves for managed travel platforms, bleisure travel extension behavior analysis, sustainable travel regulation implementation timelines, and macroeconomic outlook indicators. Both demand-side corporate spending models and supply-side airline, hotel, and car rental capacity projections were cross-validated for forecast consistency.
United States Business Travel Market Report Scope:
| Report Features | Details |
|---|---|
| Base Year of the Analysis | 2025 |
| Historical Period | 2020-2025 |
| Forecast Period | 2026-2034 |
| Units | Billion USD |
|
Scope of the Report
|
Exploration of Historical and Forecast Trends, Industry Catalysts and Challenges, Segment-Wise Historical and Future Market Assessment:
|
| Types Covered | Managed Business Travel, Unmanaged Business Travel |
| Purpose Types Covered | Marketing, Internal Meetings, Trade Shows, Product Launch, Others |
| Expenditures Covered | Travel Fare, Lodging, Dining, Others |
| Age Groups Covered | Travelers Below 40 Years, Travelers Above 40 Years |
| Service Types Covered | Transportation, Food and Lodging, Recreational Activities, Others |
| Travel Types Covered | Group Travel, Solo Travel |
| End Users Covered | Government, Corporate, Others |
| Regions Covered | Northeast, Midwest, South, West |
| Companies Covered | BCD Group, Flight Centre Travel Group Limited, SAP SE, Navan, Marriott International, Inc., etc. |
| Customization Scope | 10% Free Customization |
| Post-Sale Analyst Support | 10-12 Weeks |
| Delivery Format | PDF and Excel through Email (We can also provide the editable version of the report in PPT/Word format on special request) |
Key Benefits for Stakeholders:
- IMARC’s report offers a comprehensive quantitative analysis of various market segments, historical and current market trends, market forecasts, and dynamics of the United States business travel market from 2020-2034.
- The research study provides the latest information on the market drivers, challenges, and opportunities in the global United States business travel market.
- Porter's Five Forces analysis assists stakeholders in assessing the impact of new entrants, competitive rivalry, supplier power, buyer power, and the threat of substitution. It helps stakeholders to analyze the level of competition within the United States business travel industry and its attractiveness.
- Competitive landscape allows stakeholders to understand their competitive environment and provides an insight into the current positions of key players in the market.
Frequently Asked Questions About the US Business Travel Market Report
The United States business travel market reached USD 282.8 Billion in 2026, driven by post-COVID face-to-face business engagement recovery, corporate expansion and economic growth, the bleisure travel trend extending trip spending, and AI travel management technology improving program efficiency and spend visibility.
The United States business travel market is projected to grow at a CAGR of 8.16% during 2026-2034, sustained by the irreplaceable commercial value of in-person business engagement, expanding corporate event programming, AI platform-enabled SME travel program adoption, bleisure travel expansion, and sustainable travel program development.
The market is projected to reach approximately USD 387.1 Billion by 2030, representing the mid-period milestone at which post-pandemic structural recovery achieves maturity, AI travel management platforms achieve mid-market mainstream adoption, and bleisure and sustainable travel become standard corporate program components.
Unmanaged business travel leads with a 57.5% share in 2025, through the dominance of US small and medium-sized businesses operating without formal corporate travel management programs, booking directly through consumer platforms without centralized policy enforcement or preferred vendor contracts.
Marketing leads with a 30.5% share in 2025, through US corporations' large sales and marketing organizations driving the highest volume of business travel through client visits, prospect meetings, sales conference attendance, and trade show participation, where in-person engagement remains the highest-converting commercial activity.
The South leads with a 35.5% share in 2025, reflecting rapid corporate relocation and expansion and emerging as major business travel hubs alongside strong energy, finance, and technology sector corporate bases.
Key players include BCD Group, Flight Centre Travel Group Limited, SAP SE, Navan, and Marriott International, Inc., among others.
The United States business travel market is projected to reach USD 541.1 Billion by 2034, driven by sustained corporate economic expansion, AI platform expansion of managed travel into the SME segment, continued trade show and industry growth, and the established bleisure travel behavioral pattern adding permanent spending to business trips.
Need more help?
- Speak to our experienced analysts for insights on the current market scenarios.
- Include additional segments and countries to customize the report as per your requirement.
- Gain an unparalleled competitive advantage in your domain by understanding how to utilize the report and positively impacting your operations and revenue.
- For further assistance, please connect with our analysts.
 Request Customization
 Speak to an Analyst
 Request Brochure
 Inquire Before Buying
Benefits of Customization
- Personalize this research
- Triangulate with your data
- Get data as per your format and definition
- Gain a deeper dive into a specific application, geography, customer, or competitor
- Any level of personalization
Get in Touch With Us
UNITED STATES
Phone: +1-201-971-6302
INDIA
Phone: +91-120-433-0800
UNITED KINGDOM
Phone: +44-753-714-6104
Email: [email protected]
Client Testimonials




.webp)




.webp)













Related Reports

Choose your plan
*Please note that the prices mentioned below are starting prices for each bundle type. Kindly contact our team for further details.*
Single User License
- 1 User License, Access on 2 Devices
- PDF Report + Excel Dataset (Password Protected)
- Lifetime Access
- No Printing Rights
- 10% Free Report Customization
- 10–12 Weeks of Analyst Support
Five User License
- Access for 5 Users, 2 Devices per User
- PDF Report + Excel Dataset (Password Protected)
- Lifetime Access
- Dedicated Account Manager
- 12–14 Weeks of Analyst Support
- No Printing Rights
- 15% Free Report Customization
- 25% Discount on Your Next Purchase
Corporate User License
- Unlimited User Access (Within Your Organization)
- PDF Report + Excel Dataset
- Lifetime Access
- Dedicated Account Manager
- 14–20 Weeks of Analyst Support
- No Printing Rights
- 20% Free Report Customization
- 30% Discount on Your Next Purchase
Essential Insights
What's included:
3 reports
- Lifetime Access
- PDF Reports
- Excel Datasets
- 2 Weeks of Free Analyst Support
- 2 User Licenses
- Access on 2 Devices
- Printing Rights
- Complimentary PowerPoint (PPT) Version
- Complimentary License Upgrade
Professional Access
What's included:
5 reports
- Lifetime Access
- PDF Reports
- Excel Datasets
- 8 Weeks of Free Analyst Support
- 2 User Licenses
- Access on 2 Devices
- Printing Rights
- Complimentary PowerPoint (PPT) Version
- Complimentary License Upgrade
Business Advantage
What's included:
8 reports
- Lifetime Access
- PDF Reports
- Excel Datasets
- 14 Weeks of Free Analyst Support
- 2 User Licenses
- Access on 2 Devices
- Printing Rights
- Complimentary PowerPoint (PPT) Version
- Complimentary License Upgrade
Enterprise Intelligence
What's included:
10 reports
- Lifetime Access
- PDF Reports
- Excel Datasets
- 20 Weeks of Free Analyst Support
- 2 User Licenses
- Access on 2 Devices
- Printing Rights
- Complimentary PowerPoint (PPT) Version
- Complimentary License Upgrade