
United States Copper Pipes and Tubes Market Report by Finish Type (LWC Grooved, Straight Length, Pan Cake, LWC Plain), Outer Diameter (3/8, 1/2, 5/8 Inch, 3/4, 7/8, 1 Inch, Above 1 Inch), End User (HVAC, Industrial Heat Exchanger, Plumbing, Electrical, and Others), and Region 2026-2034
Market Overview:
The United States copper pipes and tubes market size reached 8,32,600 Tons in 2025. Looking forward, IMARC Group expects the market to reach 10,24,600 Tons by 2034, exhibiting a growth rate (CAGR) of 2.22% during 2026-2034. The market is fueled by infrastructure developments, growth in HVAC installation, and growing use in renewable energy systems. Technological advancements, sustainability needs, and government-supported development initiatives are boosting demand in residential, commercial, and industrial applications. Irrespective of material price volatility and supply chain issues, the market is holding firm with copper's efficiency and reliability. These conditions are all jointly helping towards a consistent rise in the United States copper pipes and tubes market share.
|
Report Attribute
|
Key Statistics
|
|---|---|
|
Base Year
|
2025
|
|
Forecast Years
|
2026-2034
|
|
Historical Years
|
2020-2025
|
|
Market Size in 2025
|
8,32,600 Tons |
|
Market Forecast in 2034
|
10,24,600 Tons |
| Market Growth Rate 2026-2034 | 2.22% |
Access the full market insights report Request Sample
United States Copper Pipes and Tubes Market Insights:
- Major Market Drivers: Growth in construction work, upgrades of HVAC systems, and public infrastructure investments are the main drivers. The dependability, heat conductivity, and antimicrobial qualities of copper render it necessary for heating, plumbing, and cooling systems for residential, commercial, and industrial use.
- Key Market Trends: Green building projects and energy-efficient technology are dictating the marketplace. Increasing usage of copper pipes in solar thermal applications and high-efficiency HVAC equipment is an indication of broader trends toward sustainable building and material longevity.
- Competitive Landscape: Manufacturers are emphasizing local manufacturing, high-tech copper alloy compositions, and enhanced distribution channels. Competitive approaches involve product differentiation, recycling integration, and collaborations with construction companies to address changing regulatory requirements and enhance market visibility in various application segments.
- Challenges and Opportunities: Price volatility of copper and competition from plastic-based substitutes such as PEX are continuing challenges. But opportunities lie ahead with renewable energy, electric vehicles, and retrofitting existing infrastructure with copper solutions that meet today's safety, sustainability, and performance standards.
Copper pipes and tubes are cost-effective, non-corrosive and non-reactive. They are employed for transporting gases since they are non-permeable to air. As copper pipes and tubes reduce the chances of leakage and contamination caused by oxygen, ultraviolet (UV) rays and high temperature, their sales are increasing across the United States.
The market is primarily driven by the increasing utilization of copper pipes and tubes in the healthcare sector for supplying oxygen, medical gases and other gases across the United States. Additionally, rapid urbanization, rising population, increasing renovation activities and the escalating demand for heating, ventilation and air conditioning (HVAC) in the residential and commercial sectors are positively influencing the sales of copper pipes and tubes in the country. Furthermore, as they have a high yield, tensile and fatigue strength, they play a crucial role in the water distribution systems. Besides this, the increasing utilization of these pipes and tubes in the healthcare sector due to the rising cases of coronavirus disease (COVID-19) is anticipated to strengthen the market growth.
United States Copper Pipes and Tubes Market Trends:
Increasing Adoption in HVAC Applications
The heating, ventilation, and air conditioning (HVAC) market is a major and increasing end-use application of copper pipes and tubes within the United States. With rising temperature and increasing urban development, the need for effective air conditioners is growing in residential and commercial structures. Copper's superior thermal conductivity, pressure resistance, and corrosion endurance have led it to be the material of preference for refrigeration lines and heat exchangers. Energy efficiency mandates from the government, like seasonal energy efficiency ratio (SEER) regulations, also encourage the application of high-performance materials such as copper. Moreover, as old HVAC systems are retrofitted and replaced, the market is supported by new installations and upgrade activities. The rise in the popularity of mini-split and variable refrigerant flow (VRF) systems, which call for custom copper tubing, further contributes to this trend. All these trends play an important role in the United States copper pipes and tubes market growth, particularly as building codes for sustainability and long-term performance drive climate control systems.
Infrastructure and Urban Renewal Projects
Modernization of the infrastructure is one of the key determinants of the direction of the United States copper piping industry. Multi-year budget programs for the federal government are developing water management, housing, and municipal development initiatives, all of which are dependent on sound piping systems. Copper continues to be a sought-after commodity here because it is recyclable, is strong, and is resistant to microorganisms. As urban areas invest in the replacement of old plumbing and public infrastructure, copper's place is at the center of safe and sustainable water supply. The commercial building market involving airports, hospitals, and schools remains key to the continued consumption of copper tubing. Additionally, LEED certifications and green building are key priorities, which increase copper's market importance. These continual advancements are defining the United States copper pipes and tubes market trends, especially as green infrastructure becomes a nationwide priority in public and private construction projects. As per the sources, in March 2023, Wieland officially introduced Cuprolife, the globe's first TÜV SÜD-approved copper tube consisting of 100% recycled copper, as a sustainable building technology circular solution
Increase in Renewable Energy and Green Technologies
Copper pipes and tubes are finding themselves more and more central to the development of renewable energy systems throughout the United States Solar thermal technologies, employing copper for thermal transfer in water heating systems, are increasingly on the rise because of their efficiency and reliability. Copper's high thermal properties and long lifespan render it a perfect fit for energy applications that require good performance over long durations. The electric vehicle market and heat pump technology also need widespread use of copper tubing for cooling batteries and thermal control. As the adoption of green energy gains momentum, producers are seeking novel copper alloys and eco-friendly processing techniques. This movement not only expands copper's application but also closely resonates with climate goals and technological advancements. As government subsidies and green policies increasingly support these developments, they are poised to influence the United States copper pipes and tubes market outlook, particularly in alternative energy and smart infrastructure areas. According to the reports, in October 2024, the Biden-Harris Administration released a final rule that mandates U.S. water systems to replace every lead pipe in 10 years, along with $2.6 billion in federal funds for clean water.
Key Market Segmentation:
IMARC Group provides an analysis of the key trends in each sub-segment of the United States copper pipes and tubes market report, along with forecasts at the country and regional level from 2026-2034. Our report has categorized the market based on finish type, outer diameter and end user.
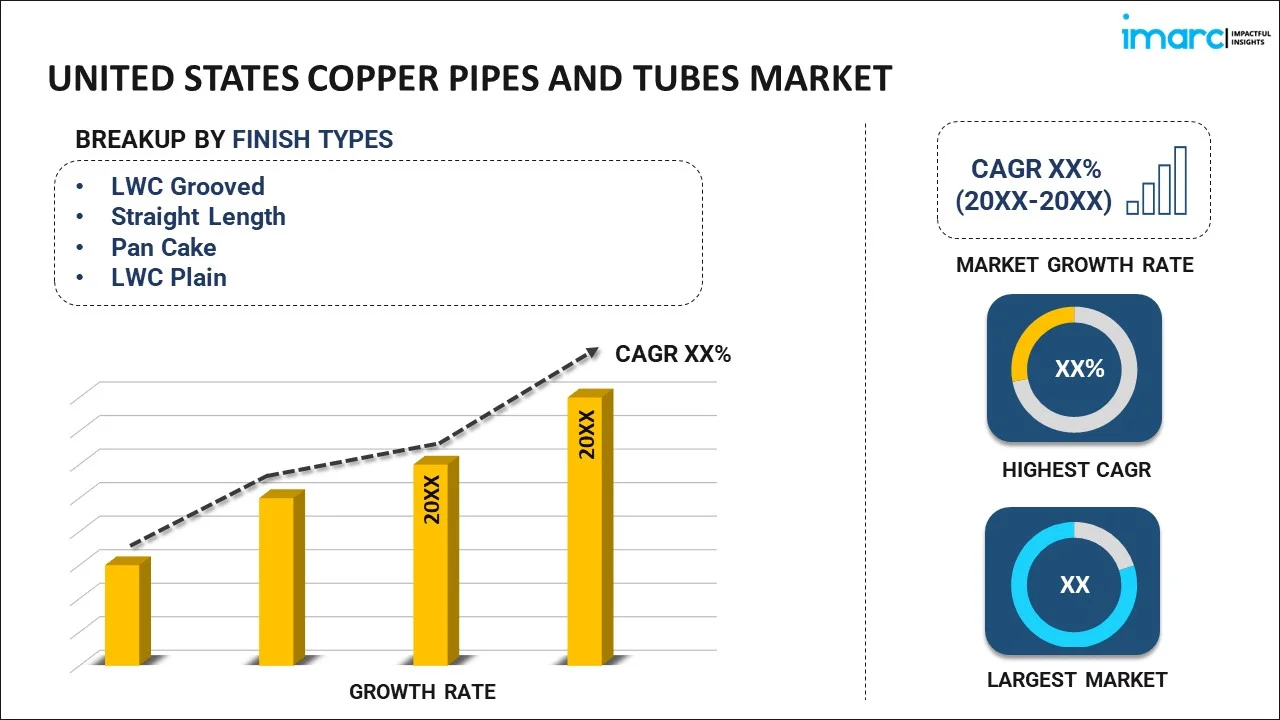
Breakup by Finish Type:
To get detailed segment analysis of this market Request Sample
- LWC Grooved
- Straight Length
- Pan Cake
- LWC Plain
Breakup by Outer Diameter:
- 3/8, 1/2, 5/8 Inch
- 3/4, 7/8, 1 Inch
- Above 1 Inch
Breakup by End User:
- HVAC
- Industrial Heat Exchanger
- Plumbing
- Electrical
- Others
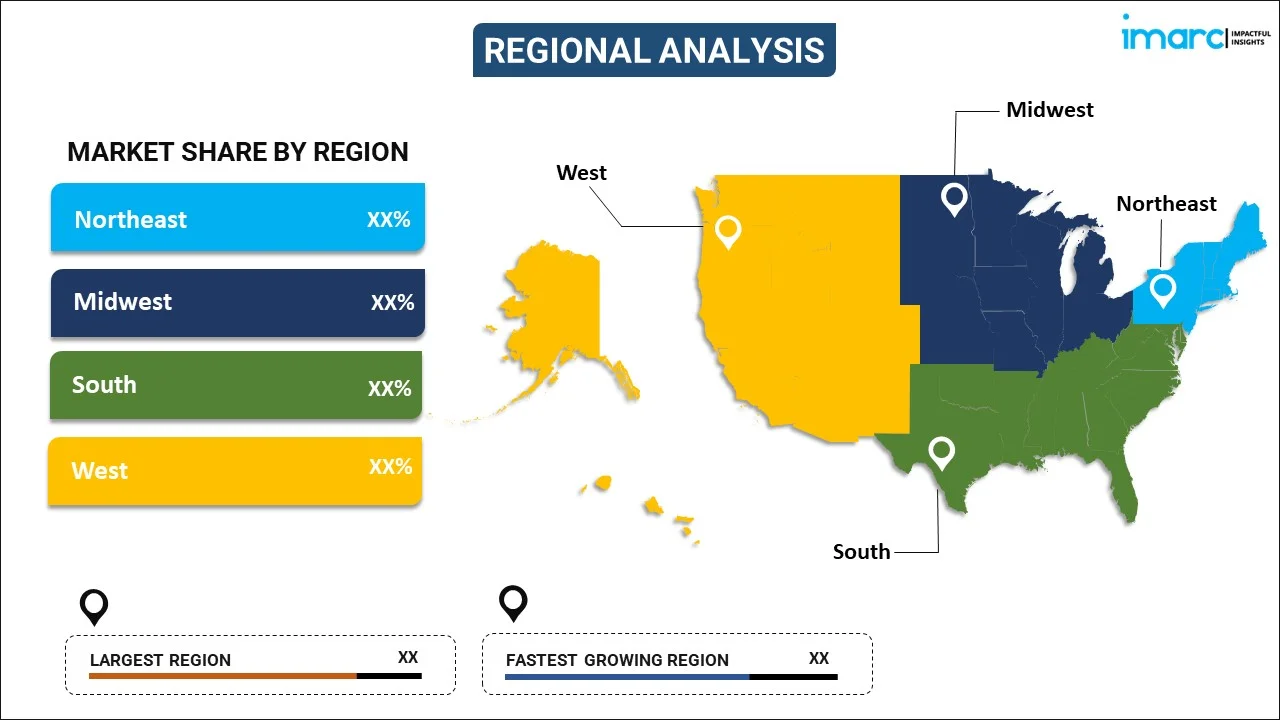
Breakup by Region:
To get detailed regional analysis of this market Request Sample
- Northeast
- Midwest
- South
- West
Competitive Landscape:
The competitive landscape of the industry has also been examined along with the profiles of the key players.
Latest News and Developments:
- In March 2025, Cerro Flow Products LLC introduced CerroSet.com, a new web-based platform providing more than 1,000 pre-configured lineset combinations for air conditioners, heat pumps, and industrial processes. The site streamlines selection and installation of copper tube solutions for air conditioners, heat pumps, and industry, increasing the Cerro product portfolio and customer convenience to high-quality flow control products.
- In October 2024, the EPA issued final the Lead and Copper Rule Improvements (LCRI), requiring replacement of all lead service lines nationwide in the next 10 years. The regulation reduces the lead action level to 10 ppb and establishes more rigorous testing, enhanced communication, and comprehensive pipe inventories by utilities.
Report Coverage:
| Report Features | Details |
|---|---|
| Base Year of the Analysis | 2025 |
| Historical Period | 2020-2025 |
| Forecast Period | 2026-2034 |
| Units | Million Metric Tons |
| Segment Coverage | Finish Type, Outer Diameter, End User, Region |
| Region Covered | Northeast, Midwest, South, West |
| Customization Scope | 10% Free Customization |
| Post-Sale Analyst Support | 10-12 Weeks |
| Delivery Format | PDF and Excel through Email (We can also provide the editable version of the report in PPT/Word format on special request) |
Frequently Asked Questions About the United States Copper Pipes and Tubes Market Report
The copper pipes and tubes market in the United States reached at 8,32,600 Tons in 2025.
The United States copper pipes and tubes market is projected to exhibit a CAGR of 2.22% during 2026-2034, reaching a volume of 10,24,600 Tons by 2034.
The market is mainly encouraged by infrastructure growth, heightened demand for HVAC and refrigeration systems, as well as heightened use of green building materials. Copper's high thermal conductivity, corrosion resistance, and recyclable nature make it best suited for residential and commercial plumbing. Moreover, rising utilization of copper in renewable energy and electric vehicle systems further propels market growth.
Need more help?
- Speak to our experienced analysts for insights on the current market scenarios.
- Include additional segments and countries to customize the report as per your requirement.
- Gain an unparalleled competitive advantage in your domain by understanding how to utilize the report and positively impacting your operations and revenue.
- For further assistance, please connect with our analysts.
 Request Customization
 Speak to an Analyst
 Request Brochure
 Inquire Before Buying
Benefits of Customization
- Personalize this research
- Triangulate with your data
- Get data as per your format and definition
- Gain a deeper dive into a specific application, geography, customer, or competitor
- Any level of personalization
Get in Touch With Us
UNITED STATES
Phone: +1-201-971-6302
INDIA
Phone: +91-120-433-0800
UNITED KINGDOM
Phone: +44-753-714-6104
Email: [email protected]
Client Testimonials


.webp)


