
United States Crane Market Size, Share, Trends and Forecast by Product Type, Application, and Region, 2026-2034
United States Crane Market Size, Share, Trends & Forecast (2026-2034)
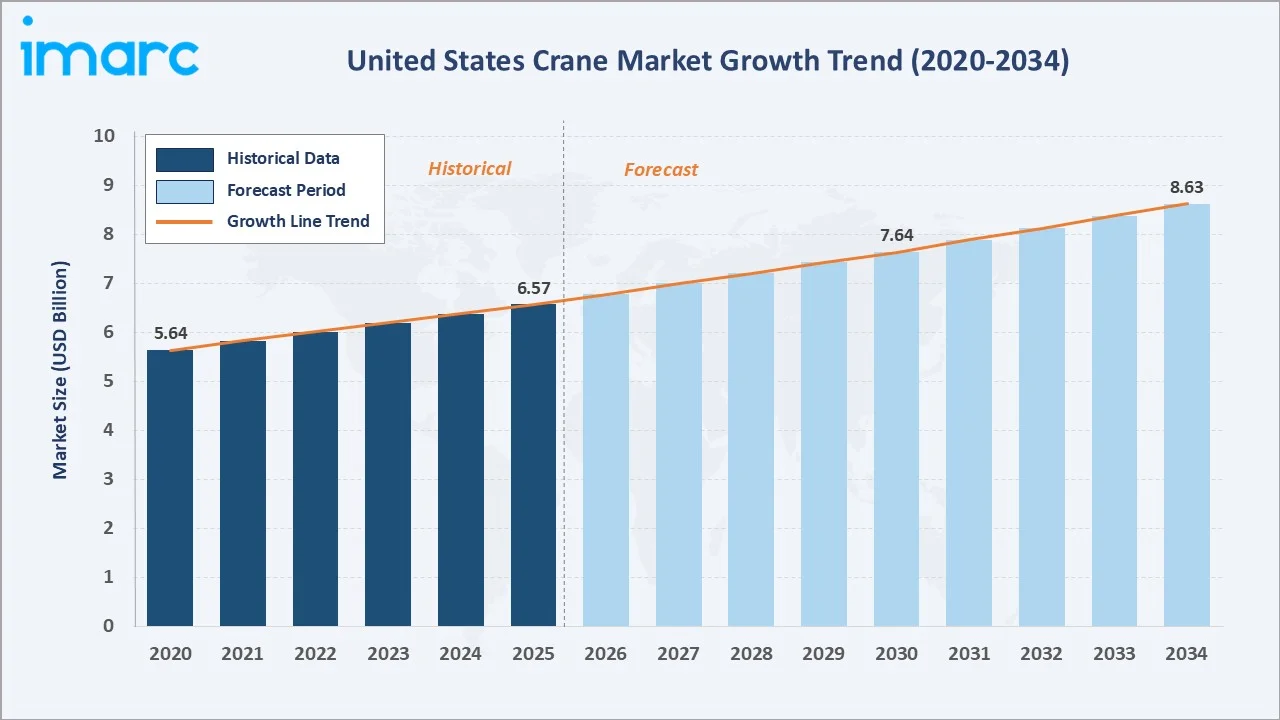
The United States crane market was valued at USD 6.57 Billion in 2025 and is projected to reach USD 8.63 Billion by 2034, exhibiting a CAGR of 3.08% during 2026-2034. Sustained federal infrastructure spending of a total of USD 4.5 Trillion from 2012 to 2024, along with rising demand for port modernization, and steady commercial construction, are the primary drivers shaping the market growth.
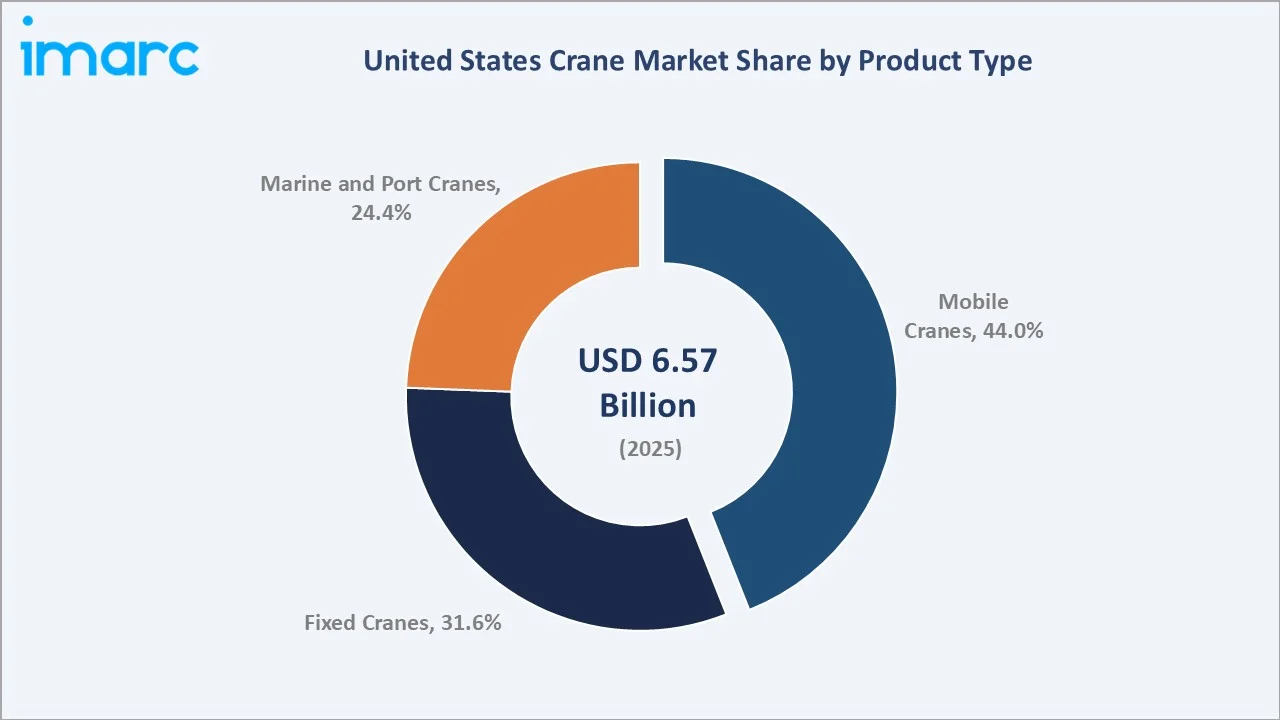
Mobile cranes lead the product type segment at 44.0%, construction and infrastructure dominate the application segment at 50.0%, and South commands 32.2% regional share.
Market Snapshot
|
Metric |
Value |
|
Market Size (2025) |
USD 6.57 Billion |
|
Forecast Market Size (2034) |
USD 8.63 Billion |
|
CAGR (2026-2034) |
3.08% |
|
Base Year |
2025 |
|
Historical Period |
2020-2025 |
|
Forecast Period |
2026-2034 |
|
Largest Region |
South (32.2%, 2025) |
|
Fastest Growing Region |
West (26.8%, 2025) |
|
Leading Product Type |
Mobile Cranes (44.0%, 2025) |
|
Leading Application |
Construction and Infrastructure (50.0%, 2025) |
The United States crane market expanded from USD 5.64 Billion in 2020 to USD 6.57 Billion in 2025, supported by a steady recovery in non-residential construction and accelerating federal infrastructure outlays. Anchored at USD 7.64 Billion in 2030, the forecast to USD 8.63 Billion by 2034 is shaped by long-cycle bridge, highway, and energy projects.
To get more information on this market, Request Sample
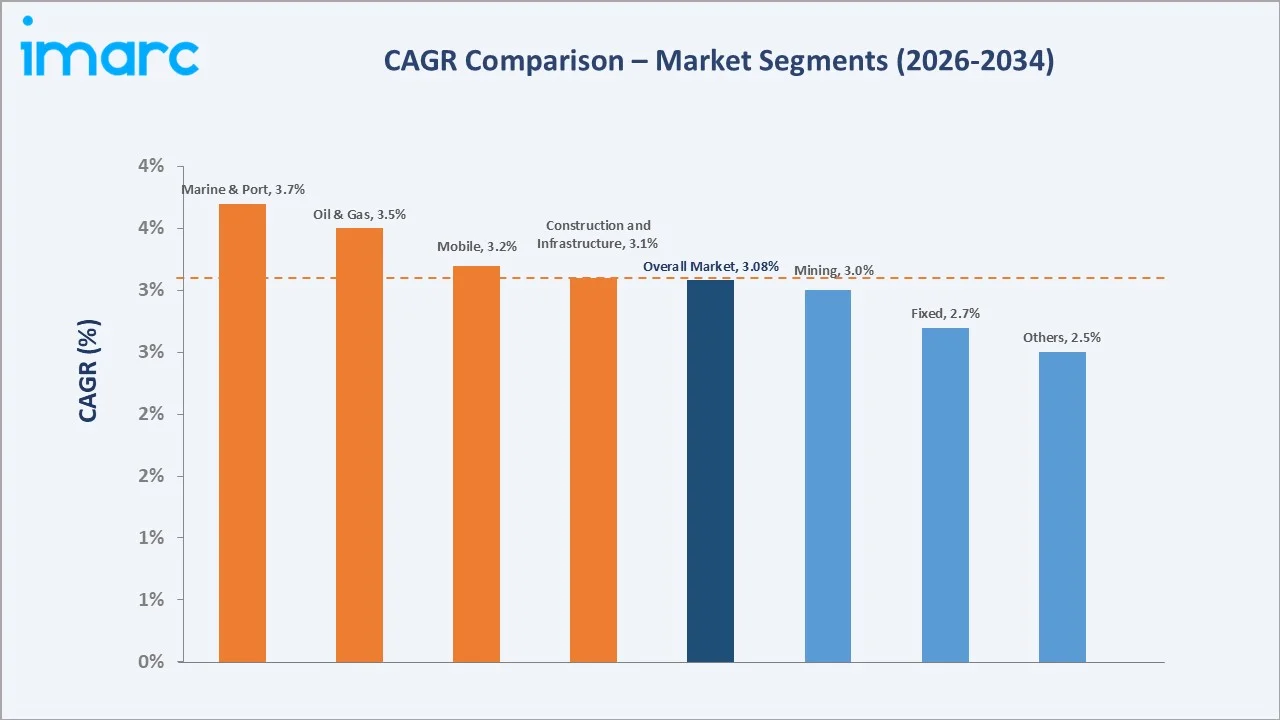
CAGR trajectories across product type and application sub-segments show marine and port cranes and oil and gas applications expanding faster than the overall 3.08% market CAGR, supported by port automation programs and offshore activity.
Executive Summary
The United States crane market is on a steady growth path from USD 5.64 Billion in 2020 to USD 8.63 Billion by 2034. Cranes have evolved from purely lifting equipment into connected, telematics-enabled assets central to large-scale construction, energy, and logistics projects. Aging public infrastructure, port modernization mandates, and renewable energy build-out are anchoring demand across multiple end-use industries.
Mobile cranes dominate the product type segment at 44.0% in 2025, supported by their flexibility across road construction, utility, and short-cycle commercial sites. Construction and infrastructure lead the application segment at 50.0%, fueled by sustained non-residential build activity. According to the United States Census Bureau, total construction spending reached an annual rate of approximately USD 2.15 Trillion in 2024, providing a strong demand foundation for crane services across public and private projects. South commands 32.2% in 2025, led by Texas and Florida, driven by population-led housing growth, refining and petrochemical investment along the Gulf Coast, and major port expansion programs. The West follows as the fastest-growing region, supported by warehouse build-out, port automation, and renewable project pipelines.
Key Market Insights
|
Insight |
Data |
|
Leading Product Type |
Mobile Cranes - 44.0% share (2025) |
|
Second Product Type |
Fixed Cranes - 31.6% share (2025) |
|
Leading Application |
Construction and Infrastructure - 50.0% share (2025) |
|
Second Application |
Oil and Gas - 19.8% share (2025) |
|
Leading Region |
South - 32.2% share (2025) |
|
Fastest Growing Region |
West - 26.8% share (2025) |
|
Top Companies |
The Manitowoc Company, Inc., Tadano Ltd., SANY America, Konecranes, Hiab Corporation |
Key Analytical Observations Expanding on the Data Above:
- Mobile cranes dominance at 44.0% is driven by their unmatched site-to-site mobility, quick set-up, and broad utility across highway, utility, and short-duration commercial projects. Rental fleet operators favor mobile cranes for high asset utilization.
- Fixed cranes at 31.6% remain essential for tall-building construction, industrial plants, and shipyards, where stability and continuous lifting cycles outweigh mobility. Their high load-bearing capacity and precision lifting capabilities make them indispensable for heavy-duty, long-duration operations.
- Marine and port cranes at 24.4% support container handling, bulk cargo, and shipbuilding operations across major coastal hubs. Investments in automated ship-to-shore systems are reinforcing share at gateway ports.
- Construction and infrastructure leadership at 50.0% reflects sustained federal funding for highways, bridges, transit, and water systems. By February 28, 2026, states had allocated USD 261 Billion in formula funds for highways and bridges to back more than 116,500 new initiatives. Public works pipelines provide multi-year visibility for crane rental and purchase decisions.
- Oil and gas at 19.8% benefits from refinery turnarounds, LNG export terminal build-out along the Gulf Coast, and steady upstream activity in the Permian Basin. Heavy lift cranes are critical for modular plant assembly.
- South at 32.2% leads the regional split owing to Texas-led infrastructure spending, Gulf-area energy projects, and population-driven residential and commercial construction in Florida and the Carolinas.
United States Crane Market Overview
Cranes are heavy lifting machines used to hoist, lower, and move loads horizontally and vertically across construction, manufacturing, energy, and logistics environments. They span mobile, fixed, and marine configurations engineered for varied load capacities and reach requirements.
The ecosystem connects steel and component suppliers, original equipment manufacturers (OEMs), dealers, rental fleet operators, project contractors, and end users across construction, mining, oil and gas, and ports. Federal funding cycles, energy prices, interest rates, and skilled-operator availability shape demand patterns nationwide.
Market Dynamics
To evaluate market opportunities, Request Sample
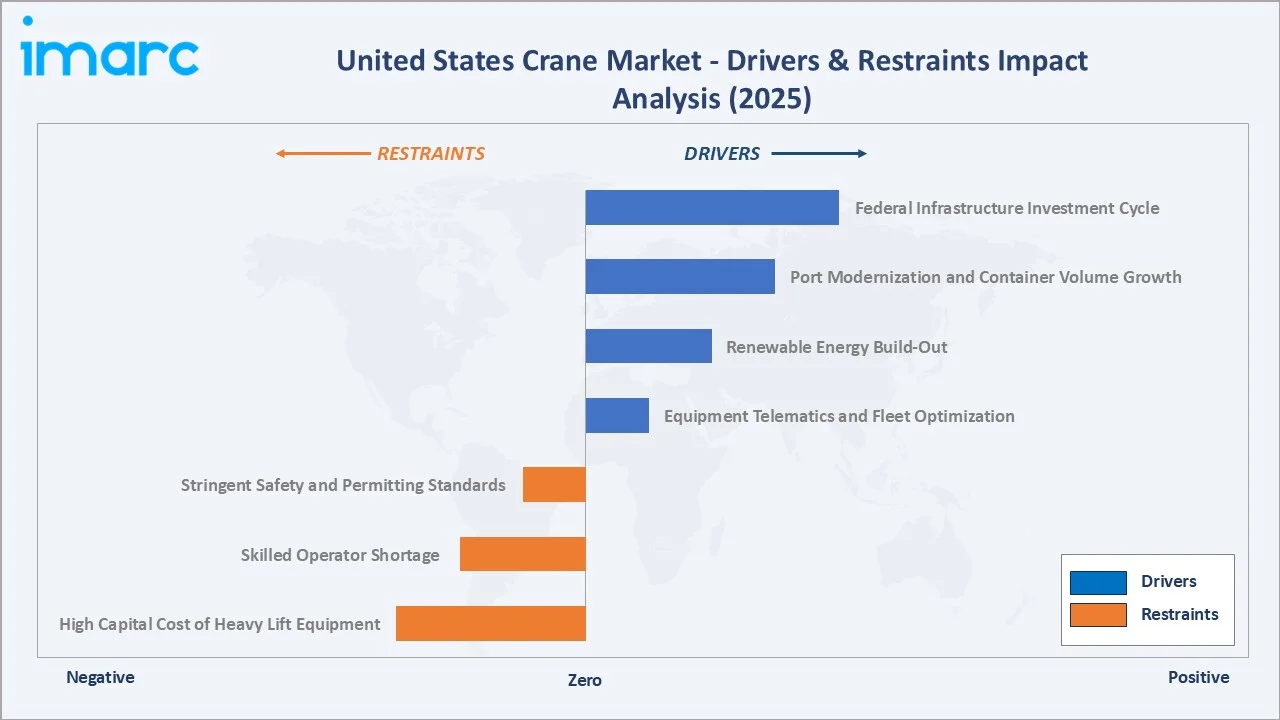
Market Drivers
- Federal Infrastructure Investment Cycle: Significant federal investments in infrastructure, spanning roads, bridges, transit, ports, and broadband, are creating a sustained multi-year tailwind for crane demand across public works projects nationwide.
- Port Modernization and Container Volume Growth: Major coastal and inland ports are upgrading ship-to-shore gantry cranes, rubber-tired gantries, and yard handling equipment to address container throughput growth and ease congestion. In April 2026, the US government unveiled a USD 500 Million initiative focused on updating ports and strengthening supply chain resilience nationwide.
- Renewable Energy Build-Out: Wind farm assembly, solar plant construction, and battery storage installation are creating sustained demand for high-capacity crawler and all-terrain cranes, especially for hub-height nacelle lifts.
- Equipment Telematics and Fleet Optimization: Rental companies and contractors are adopting telematics-enabled cranes to track utilization, schedule maintenance, and optimize fleet deployment, lifting demand for newer machines with connected systems.
Market Restraints
- High Capital Cost of Heavy Lift Equipment: Crawler and all-terrain cranes can cost several million dollars per unit, limiting outright ownership to large contractors and rental houses. Smaller firms increasingly rely on rental, which compresses unit sales growth.
- Skilled Operator Shortage: The construction industry continues to face a workforce shortage, with the Associated General Contractors of America reporting in 2025 that 83% of firms with openings for craft workers, including crane operators, found these roles as difficult or more difficult to fill than in 2024, resulting in delays in project execution and reduced crane utilization.
- Stringent Safety and Permitting Standards: OSHA requirements, state lifting permits, and certified operator mandates extend project timelines and raise compliance costs for fleet operators and contractors handling complex urban lifts.
Market Opportunities
- Electrification of Cranes: Battery-electric mobile cranes and hybrid drivelines are gaining traction as contractors target lower jobsite emissions and meet tightening urban air quality rules in cities like Los Angeles and New York.
- Crane-as-a-Service and Rental Penetration: Rising rental penetration is creating opportunities for fleet operators to offer bundled services covering operator supply, telematics, and maintenance, deepening customer relationships beyond pure equipment hire.
- Modular and Industrial Construction Lifts: Growth in prefabricated modular construction and industrial plant assembly, including data centers and semiconductor fabs, supports demand for high-capacity heavy lift cranes.
Market Challenges
- Steel and Component Cost Volatility: Fluctuations in structural steel, hydraulic components, and engine pricing create margin pressure for OEMs and complicate long-term project bidding for end users.
- Interest Rate Sensitivity: Crane purchases and rental fleet refresh cycles are sensitive to financing conditions; elevated rates extend ownership cycles and slow new equipment investment among small and mid-size contractors.
- Aging Fleet and Replacement Lag: A significant share of the installed crane base is aging, and slower replacement cycles increase maintenance costs and limit access to modern safety and emissions features.
Emerging Market Trends
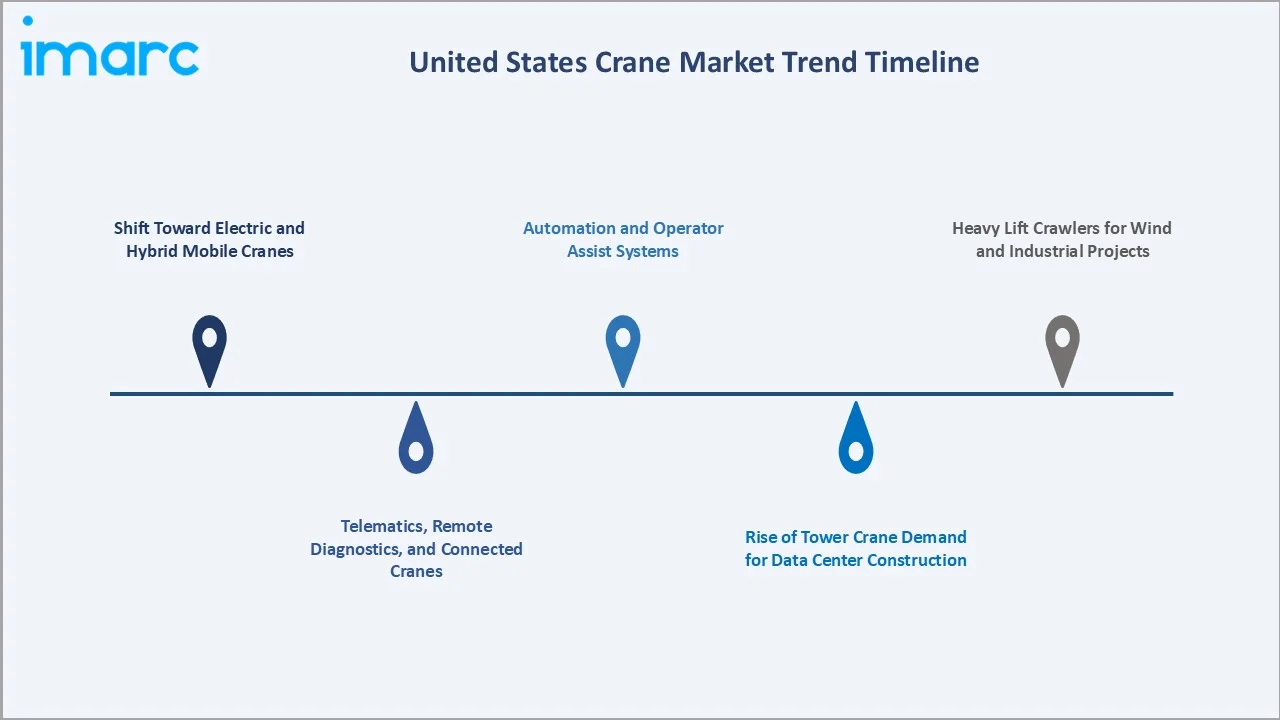
1. Shift Toward Electric and Hybrid Mobile Cranes
Manufacturers are introducing battery-electric and hybrid mobile cranes designed for urban and indoor jobsites where emissions and noise are restricted. These models are seeing early adoption among rental fleets seeking compliance with state and city low-emission zone rules.
2. Telematics, Remote Diagnostics, and Connected Cranes
Connected cranes equipped with sensors, global positioning system (GPS), and remote diagnostics are now standard on new mobile cranes. In 2025, the United States had around 624,000 bridges, many requiring inspection and rehabilitation work that benefits from telematics-enabled lifting equipment to monitor load cycles and structural stress.
3. Rise of Tower Crane Demand for Data Center Construction
Hyperscale data center construction across Virginia, Texas, and Arizona is driving sustained tower crane utilization. Long project timelines and tall structural builds favor luffing and flat-top tower cranes over short-duration mobile lifts.
4. Automation and Operator Assist Systems
Anti-collision systems, load moment indicators, and semi-autonomous lift planning tools are being integrated into new cranes. These features improve jobsite safety, reduce operator fatigue, and address the skilled labor shortage by simplifying complex lifts.
5. Heavy Lift Crawlers for Wind and Industrial Projects
Demand for high-capacity crawler cranes is expanding as onshore wind turbine hub heights climb and industrial mega-projects, such as semiconductor and battery plants, require modular component lifts.
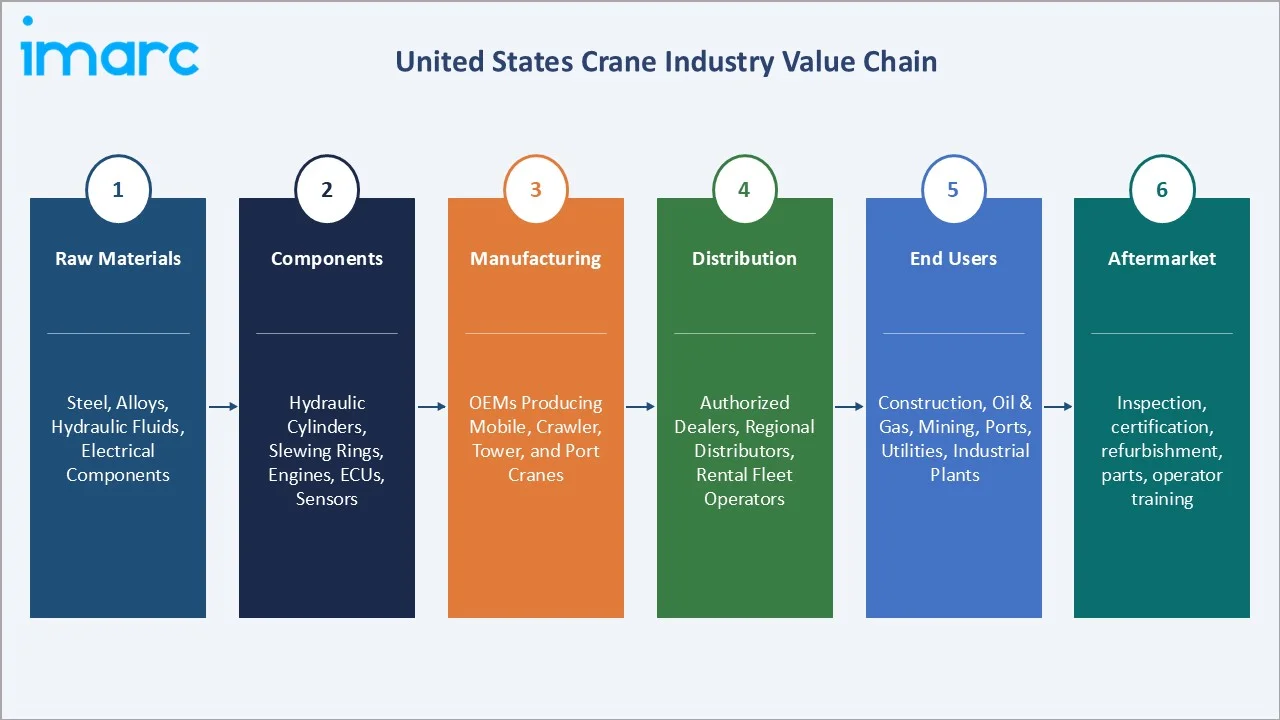
Industry Value Chain Analysis
The United States crane value chain spans six stages from raw material supply through end-of-life servicing. Original equipment manufacturing and rental fleet operations capture the highest value-add, while dealer-installer relationships and aftermarket service drive recurring revenue.
|
Stage |
Key Players / Examples |
|
Raw Materials |
Suppliers of structural steel, high-strength alloys, hydraulic fluids, electrical components, and specialty castings used in crane fabrication |
|
Components |
Manufacturers of hydraulic cylinders, slewing rings, winches, engines, electronic control units, telematics modules, and safety sensors |
|
Manufacturing |
OEMs producing mobile, crawler, tower, and port crane platforms across multiple capacity classes |
|
Distribution |
Authorized dealers, regional distributors, and rental fleet operators handling sales, leasing, parts, and field service |
|
End Users |
Construction contractors, oil and gas operators, mining firms, port and terminal operators, utilities, and industrial plants |
|
Aftermarket |
Service providers offering inspection, certification, refurbishment, parts replacement, and operator training programs |
Vertically integrated OEMs that own component production and dealer networks achieve stronger cost control and aftermarket revenue capture compared with assemblers reliant on third-party sourcing.
Technology Landscape in the United States Crane Industry
Battery and Electric Drive Technology
Battery-electric and plug-in hybrid mobile cranes are entering the market, offering zero-emission operation for urban and enclosed sites. Lithium-ion battery integration is enabling full-shift performance on small and mid-size mobile units.
Materials and Structural Innovation
High-strength steels and lightweight composite booms are improving load capacity-to-weight ratios. These advances allow longer reach and higher lifting capacity within road-legal axle weight limits for mobile cranes.
Smart Connectivity and Telematics
Connected cranes with cloud-based dashboards provide real-time tracking of load cycles, fuel use, location, and component health. Fleet managers use these insights to optimize utilization, schedule preventive maintenance, and reduce unplanned downtime.
Automation and Safety Systems
Anti-two-block alarms, load moment indicators, wind speed sensors, and 360-degree cameras are becoming standard. Semi-autonomous lift planning software is also shortening setup times and enabling safer operation in congested urban environments.
Market Segmentation Analysis
By Product Type
Mobile cranes command a 44.0% majority share in 2025, supported by their road mobility, fast setup, and broad applicability across highway, utility, and short-cycle commercial projects. Rental fleets favor mobile cranes for high asset turnover and flexible deployment across multiple jobsites.
To access detailed market analysis, Request Sample
Fixed cranes at 31.6% in 2025 include tower cranes used on tall buildings, overhead bridge cranes deployed in industrial plants, and pedestal cranes on offshore platforms. Long-duration construction cycles, particularly in commercial high-rise and industrial settings, sustain demand for these units.
By Application
Construction and infrastructure dominate with 50.0% share in 2025, reflecting sustained federal and state spending on highways, bridges, transit corridors, water systems, and public buildings. Private non-residential build activity, including data centers and warehouses, further reinforces demand for mobile and fixed cranes.
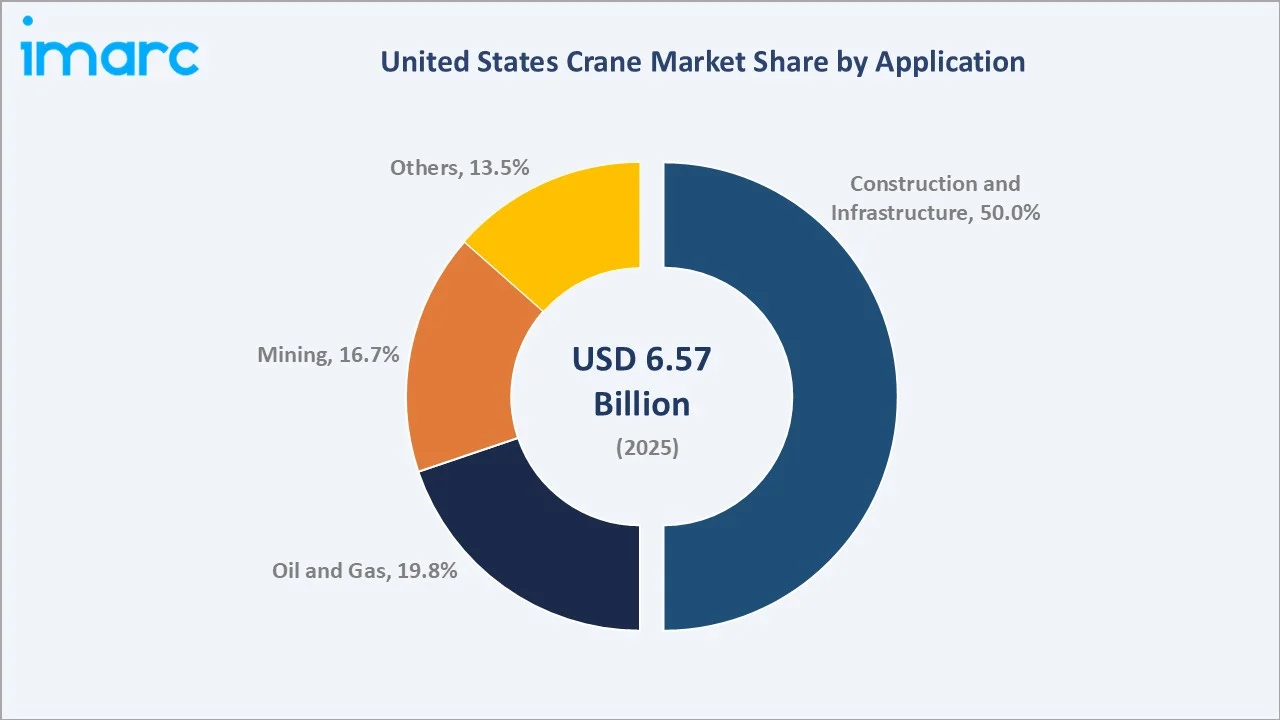
Oil and gas at 19.8% benefits from refinery turnarounds, LNG export terminal build-out along the Gulf Coast, midstream pipeline projects, and steady upstream activity. Heavy crawler cranes are essential for modular plant assembly and offshore platform support.
Regional Market Insights
|
Region |
Share (2025) |
Key Growth Drivers |
|
South |
32.2% |
Strong infrastructure investment, robust energy sector activity, and population-driven residential and commercial construction |
|
West |
26.8% |
Expanding warehouse and logistics build-out, port modernization programs, and rising renewable energy project pipelines |
|
Midwest |
21.4% |
Steady industrial and manufacturing investment, agricultural infrastructure upgrades, and bridge and highway rehabilitation |
|
Northeast |
19.6% |
Mature urban construction activity, transit and rail modernization, and ongoing high-rise and mixed-use development |
South at 32.2% in 2025 leads the United States market, supported by Texas-led infrastructure spending, Gulf Coast energy investment, and population-driven build activity in Florida, Georgia, and the Carolinas. Strong rental fleet density and lower operating costs reinforce sustained crane utilization across the region.
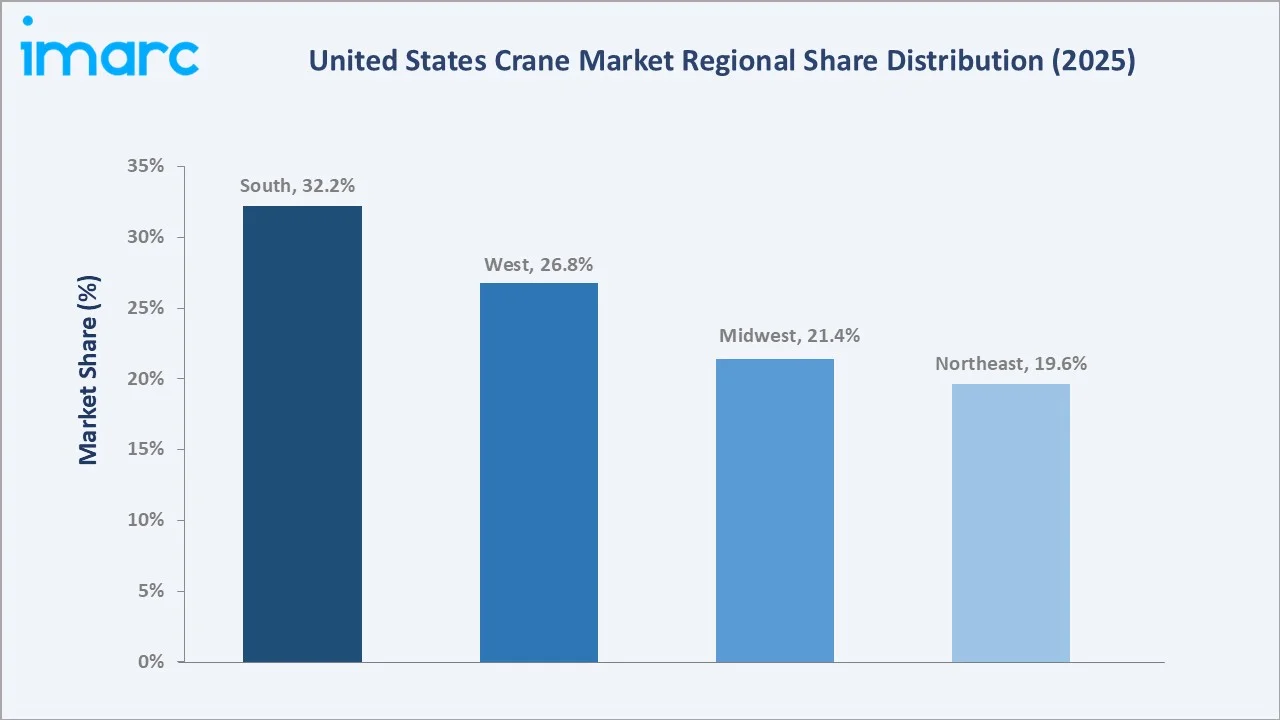
West at 26.8% is the fastest-growing region through 2034. California port automation, Arizona and Nevada warehouse build-out, and accelerating wind and solar deployment are driving demand for mobile and fixed cranes. Large-scale infrastructure upgrades and logistics network expansion are further sustaining equipment demand.
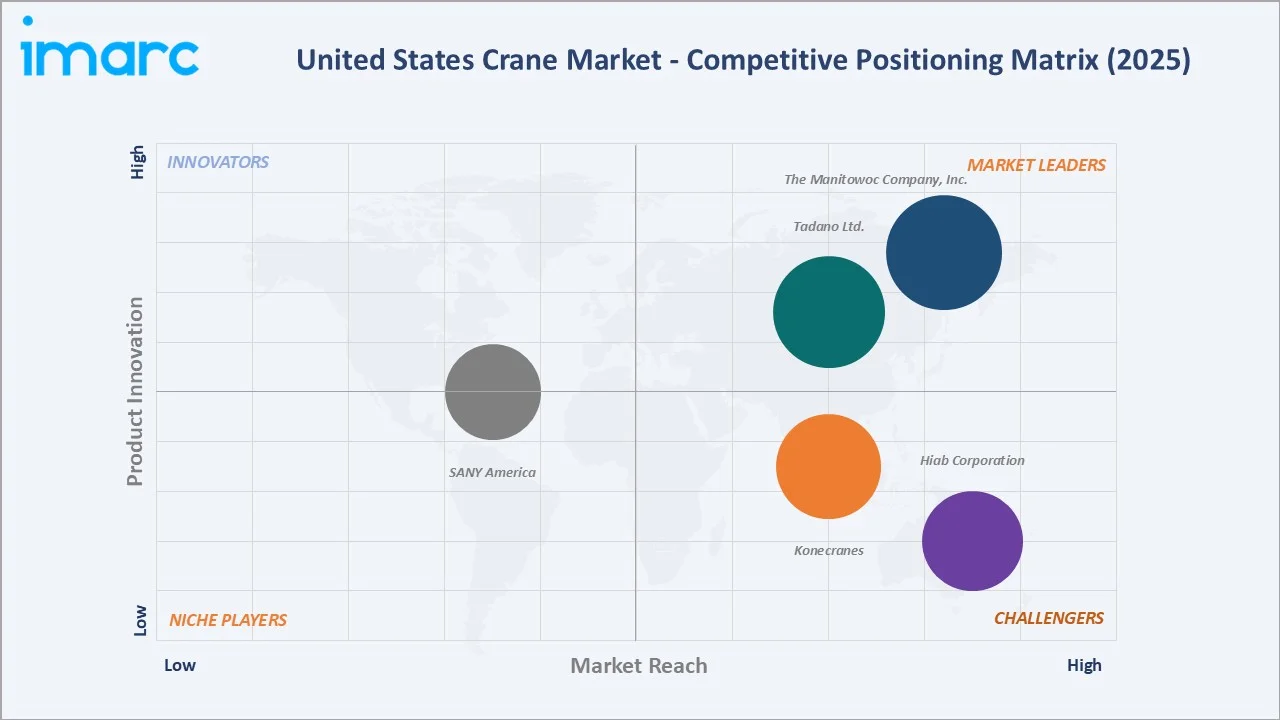
Competitive Landscape
The United States crane market is moderately fragmented, with established global OEMs leading mobile cranes segment while specialized players hold strong positions in marine and port cranes. Dealer networks, aftermarket service depth, and rental partnerships form the key competitive moats.
|
Company Name |
Brand / Key Product |
Position |
Strategic Focus |
|
The Manitowoc Company, Inc. |
Grove, Manitowoc, National Crane, Potain, Shuttlelift |
Leader |
Broad mobile crane portfolio, strong United States manufacturing footprint, dealer-led distribution |
|
Tadano Ltd. |
Manitex, PM, Valla |
Leader |
Expanding portfolio of all-terrain, rough terrain, telescopic and lattice boom crawler cranes |
|
SANY America |
SCA3300A crawler crane, SCA1100TB Telescopic Crawler Crane |
Emerging |
Rough terrain, all-terrain, and crawler cranes; nationwide dealer network with United States operations in Peachtree City, Georgia |
|
Konecranes |
R&M, SWF Krantechnik |
Challenger |
Industrial overhead, port, and process cranes; service-led aftermarket model |
|
Hiab Corporation |
Hiab, Effer, Argos |
Challenger |
Loader cranes and on-road load handling solutions |
Key players include The Manitowoc Company, Inc., Tadano Ltd., SANY America, Konecranes, and Hiab Corporation, among others.
Key Company Profiles
The Manitowoc Company, Inc.
The Manitowoc Company, Inc., headquartered in Milwaukee, Wisconsin, is a leading United States manufacturer of mobile and fixed cranes serving construction, energy, and infrastructure customers through a network of authorized dealers and rental partners.
- Product Portfolio: Grove all-terrain and rough terrain cranes, Manitowoc lattice boom crawler cranes, National Crane boom trucks, Potain self-erecting and top-slewing tower cranes, and Shuttlelift carrydeck industrial cranes.
- Recent Developments: In 2024, Manitowoc introduced new Grove all-terrain models, the GRT765 and GRT780, with enhanced telematics and operator assist features and expanded dealer support across North American markets to strengthen aftermarket services.
- Strategic Focus: Expanding aftermarket parts and service revenue, strengthening dealer network coverage, and integrating telematics across the product line.
Tadano Ltd.
Tadano Ltd. is a Japanese manufacturer with significant United States operations, offering a broad portfolio of all-terrain, rough terrain, telescopic boom crawler, and lattice boom crawler cranes. The company continues to strengthen its presence through product innovation and an expanding service and distribution network.
- Product Portfolio: Tadano all-terrain cranes, rough terrain cranes, telescopic boom crawler cranes, lattice boom crawler cranes, and Manitex boom trucks.
- Recent Developments: In January 2025, Tadano completed the acquisition of Manitex International, adding boom truck capabilities to its portfolio. Tadano has also continued rolling out electric crane models, including the EVOLT eGR-250N rough terrain crane.
- Strategic Focus: Unified Tadano global brand strategy, expanding heavy lift crawler crane share, integrating sustainability features such as electric drive systems, and strengthening United States dealer and rental partnerships.
SANY America
SANY America, headquartered in Peachtree City, Georgia, offers cranes, excavators, and material handling equipment. The company focuses on competitive pricing, localized manufacturing, dealer network expansion, and strengthening aftersales service capabilities across the United States.
- Product Portfolio: SCA3300A crawler crane, SCA1100TB telescopic crawler crane, all-terrain cranes, rough terrain cranes, truck cranes, and port machinery.
- Recent Developments: SANY America has expanded its dealer network across all major United States regions, broadened its crane lineup with new lattice and telescopic boom crawler models, and reinforced its 'Made for America' positioning with cranes built to United States quality and safety standards.
- Strategic Focus: Aggressive United States dealer network expansion, competitive value-driven positioning, and rapidly broadening crane product range targeting construction, infrastructure, and energy applications.
Market Concentration Analysis
The United States crane market is moderately concentrated, with the top five companies, including The Manitowoc Company, Inc., Tadano Ltd., SANY America, Konecranes, and Hiab Corporation, estimated to hold approximately 55-65% combined revenue share in 2025.
Barriers to entry include heavy capital requirements for crane manufacturing, the need for nationwide dealer and service networks, OSHA and ANSI compliance, and long-standing relationships with major rental houses. High aftersales support expectations and parts availability further raise entry hurdles for new entrants.
Consolidation trends include rental fleet roll-ups, OEM aftermarket service expansion, and acquisitions targeting telematics and crane management software capabilities. Mid-size regional dealers are increasingly merging to gain scale and broader geographic reach.
Investment & Growth Opportunities
Fastest-Growing Segments
Marine and port cranes and oil and gas applications are expected to outpace the overall 3.08% market CAGR through 2034, driven by port automation programs and Gulf Coast LNG terminal build-out. Heavy crawler cranes serving wind and industrial mega-projects also represent a high-growth niche.
Emerging Markets
West at 26.8% is a key growth region in the United States crane market, driven by port modernization and data center construction, supporting sustained demand across infrastructure and industrial projects. Ongoing logistics expansion further reinforces equipment utilization.
Venture and Investment Trends
Investment is concentrated in crane telematics platforms, electric and hybrid drive systems, semi-autonomous lift planning software, and rental fleet expansion. Private equity activity remains active in regional rental consolidation and aftermarket service rollups.
Future Market Outlook (2026-2034)
The United States crane market is forecast to expand from USD 6.57 Billion in 2025 to USD 8.63 Billion by 2034 at a CAGR of 3.08%, adding more than USD 2.0 Billion in incremental annual market value over the forecast period.
Four forces will shape the market through 2034: federal infrastructure spending follow-through; electrification of mobile crane platforms; widespread telematics and operator assist adoption; and the build-out of data centers, semiconductor fabs, and battery plants that demand heavy lift capacity.
By 2034, electric and hybrid mobile cranes are expected to represent a meaningful share of new mobile crane sales in urban markets, while connected fleet management will be standard across rental and contractor fleets.
Research Methodology
Primary Research
Primary research included interviews with OEM product managers, rental fleet executives, construction contractors, port operators, and industry consultants, validating market sizing, regional demand, product mix, and application trends across the United States.
Secondary Research
Secondary sources included the United States Census Bureau construction spending data, Bureau of Labor Statistics employment statistics, Federal Highway Administration bridge inventory, Department of Transportation grant announcements, OSHA regulatory updates, and annual reports and investor presentations from listed manufacturers.
Forecasting Models
Market forecasts used top-down and bottom-up models combining construction spending trajectories, project pipeline visibility, rental utilization rates, and replacement cycles. Scenario analysis addressed interest rate paths and infrastructure funding execution.
United States Crane Market Report Coverage:
| Report Features | Details |
|---|---|
| Base Year of the Analysis | 2025 |
| Historical Period | 2020-2025 |
| Forecast Period | 2026-2034 |
| Units | Billion USD |
| Scope of the Report | Exploration of Historical Trends and Market Outlook, Industry Catalysts and Challenges, Segment-Wise Historical and Future Market Assessment:
|
| Product Types Covered | Mobile Cranes, Marine and Port Cranes, Fixed Cranes |
| Applications Covered | Construction and Infrastructure, Mining, Oil and Gas, Others |
| Regions Covered | Northeast, Midwest, South, West |
| Companies Covered | The Manitowoc Company, Inc., Tadano Ltd., SANY America, Konecranes, Hiab Corporation, etc. |
| Customization Scope | 10% Free Customization |
| Post-Sale Analyst Support | 10-12 Weeks |
| Delivery Format | PDF and Excel through Email (We can also provide the editable version of the report in PPT/Word format on special request) |
Frequently Asked Questions About the United States Crane Market Report
The United States crane market was valued at USD 6.57 Billion in 2025, supported by federal infrastructure spending, port modernization, and steady commercial construction activity.
The market is projected to grow at a 3.08% CAGR from 2026 to 2034, reaching USD 8.63 Billion, supported by infrastructure investment and energy sector demand.
Mobile cranes lead at 44.0% in 2025, driven by site mobility and rental flexibility. Fixed cranes follow at 31.6% and marine and port cranes at 24.4%.
Construction and infrastructure dominate at 50.0% in 2025, supported by sustained federal funding for highways, bridges, transit, water systems, and public buildings.
The South commands 32.2% in 2025, led by Texas and Florida. The West at 26.8% is the fastest-growing region through 2034.
Leading players include The Manitowoc Company, Inc., Tadano Ltd., SANY America, Konecranes, and Hiab Corporation.
Adoption is driven by tightening urban emissions rules, lower jobsite noise requirements, falling battery costs, and contractor sustainability commitments on public projects.
Telematics enable real-time tracking of utilization, location, and health, improving fleet efficiency, reducing downtime, and helping rental operators optimize asset deployment.
Need more help?
- Speak to our experienced analysts for insights on the current market scenarios.
- Include additional segments and countries to customize the report as per your requirement.
- Gain an unparalleled competitive advantage in your domain by understanding how to utilize the report and positively impacting your operations and revenue.
- For further assistance, please connect with our analysts.
 Request Customization
 Speak to an Analyst
 Request Brochure
 Inquire Before Buying
Benefits of Customization
- Personalize this research
- Triangulate with your data
- Get data as per your format and definition
- Gain a deeper dive into a specific application, geography, customer, or competitor
- Any level of personalization
Get in Touch With Us
UNITED STATES
Phone: +1-201-971-6302
INDIA
Phone: +91-120-433-0800
UNITED KINGDOM
Phone: +44-753-714-6104
Email: sales@imarcgroup.com
Client Testimonials


.webp)


