
United States DNA Sequencing Products Market Report by Product Type (Consumables and Reagents, Equipments), Application (Biomarkers, Diagnostics, Reproductive Health, Forensics, Personalized Medicine, and Others), End User (Academic and Government Research Institutes, Pharmaceutical and Biotechnology Companies, Hospitals and Clinics, and Others), and Region 2026-2034
Market Overview:
The United States DNA sequencing products market size reached USD 3.9 Billion in 2025. Looking forward, IMARC Group expects the market to reach USD 11.2 Billion by 2034, exhibiting a growth rate (CAGR) of 12.00% during 2026-2034.
|
Report Attribute
|
Key Statistics
|
|---|---|
|
Base Year
|
2025
|
|
Forecast Years
|
2026-2034
|
|
Historical Years
|
2020-2025
|
| Market Size in 2025 | USD 3.9 Billion |
| Market Forecast in 2034 | USD 11.2 Billion |
| Market Growth Rate (2026-2034) | 12.00% |
Access the full market insights report Request Sample
United States DNA Sequencing Products Market Analysis:
- Major Market Drivers: United States DNA sequencing products market growth is primarily driven by increasing government funding for genomics research initiatives, rising prevalence of genetic disorders requiring precision medicine approaches, expanding applications in personalized healthcare, and growing adoption of sequencing technologies in pharmaceutical drug discovery processes across various therapeutic areas.
- Key Market Trends: The market demonstrates accelerating adoption of next-generation sequencing platforms, integration of artificial intelligence for enhanced data analysis, miniaturization of sequencing devices for point-of-care applications, and growing demand for direct-to-consumer genetic testing services driving significant United States DNA sequencing products market size expansion.
- Competitive Landscape: The competitive environment features established biotechnology companies investing heavily in research and development, strategic partnerships between technology providers and healthcare institutions, mergers and acquisitions consolidating market positions, and emerging players introducing innovative sequencing solutions targeting specialized applications and diverse user segments.
- Challenges and Opportunities: Market faces challenges including high equipment costs, complex data management requirements, and regulatory compliance issues. However, opportunities exist in expanding clinical applications, developing portable sequencing platforms, enhancing data interpretation capabilities, and addressing underserved genomic research areas across diverse population groups.
DNA sequencing refers to a laboratory method that is utilized to ascertain the nucleotide sequence of the deoxyribonucleic acid (DNA). These nucleotides are the building blocks of nucleic acid, which include adenine (A), guanine (G), cytosine (C) and thymine (T). This method assists research professionals to gain insights into the genetic function or progression of living organisms to further determine the DNA linked disorders. DNA sequencing products are scientific instruments that are generally used to automate the sequencing process and enhance the metagenomic identification of closely related species to distinguish plasmid from the genome.
The market in the United States is primarily driven by significant growth in the field of bioinformatics. Along with this, numerous key players in the market are launching advanced data toolkits, a new suite of workflow functionality and data analysis tools, which will help researchers to detect and identify the SARS-CoV-2 viral sequence. Moreover, rapid advancements in sequencing products, such as the advent of sequencing by synthesis (SBS) and second-generation sequencing technologies, are creating a positive outlook for the market. Furthermore, rising investments by public and private firms to conduct extensive research and development (R&D) activities for introducing innovative DNA sequencing products with improved functions are contributing to the market growth across the country.
United States DNA Sequencing Products Market Trends:
Emergence of Next-Generation Sequencing Technologies
United States DNA sequencing products market is growing due to the extensive utilization of next-generation sequencing (NGS) technologies. NGS is providing higher speed, better accuracy, and lower cost compared to previous technologies, facilitating large-scale genomic studies in clinical, research, and pharmaceutical environments. It has applications in oncology, rare disease diagnosis, and personalized medicine, boosting demand for sequencing instruments, reagents, and consumables. Academic and research private institutions are investing heavily in NGS platforms in order to speed up genetic discoveries and biomarker identification. As per the sources, in November 2024, PacBio unveiled its Vega™ benchtop long-read sequencer. Vega offers HiFi accuracy, fast turnaround, and broad applications, with shipments planned for the first quarter of 2025 to U.S. research laboratories. Additionally, automation and high-throughput sequencing systems have enhanced the efficiency of workflows and accuracy of data, making turnaround faster and cutting down on operational expenses. As new sequencing technologies emerge, the market can anticipate broader adoption in hospitals, diagnostic labs, and biotech firms, solidifying the United States position at the forefront of genomics research and personalized healthcare solutions.
Increased Clinical Applications and Personalized Medicine
Clinical use in oncology, prenatal screening, and rare genetic disorder diagnosis is increasingly pushing the United States DNA sequencing product market share. Personalized medicine programs are based on genomic profiling that determines therapies based on individual patients, which requires sophisticated sequencing products for accurate diagnostics. Hospitals, specialty clinics, and laboratory diagnosticians are implementing DNA sequencing platforms to inform treatment choices and follow-up disease progression. Moreover, reimbursement schemes and regulatory clearances are increasingly supportive, stimulating clinicians to make sequencing a part of mainstream care. The emergence of liquid biopsy and non-invasive prenatal testing also widens the need for sequencing reagents and equipment. This clinical interest is also speedily developing novel products, including portable sequencers and combined bioinformatics solutions, to boost accessibility and scalability.
Integration of Advanced Bioinformatics and Data Analytics
The market size is increasingly influenced by the incorporation of high-end bioinformatics and data analytics solutions. Sequencing results in enormous amounts of genetic information requiring high-level computational platforms for analysis, storage, and interpretation. According to the sources, in May 2025, the 7th Edition of the Sequencing Buyer’s Guide was released, reflecting recent advancements in short-read and long-read sequencing, multi-omics, proteomics, and solid-state nanopore technologies. Moreover, vendors are providing packaged solutions integrating sequencing hardware with proprietary software, allowing researchers and clinicians to gain meaningful insights effectively. Cloud-based platforms, machine learning algorithms, and artificial intelligence are enabling the discovery of genetic variants, biomarkers, and disease correlations. In addition, these analytics solutions provide improved reproducibility and reliability of sequencing data, enabling large-scale population studies and clinical trials. With the incorporation of advanced bioinformatics, the market is transforming from basic sequencing solutions to end-to-end genomics platforms, making the United States a pioneer in precision medicine and genomic research innovation.
Key Market Segmentation:
IMARC Group provides an analysis of the key trends in each sub-segment of the United States DNA sequencing products market report, along with forecasts at the country and regional level from 2026-2034. Our report has categorized the market based on product type, application and end user.
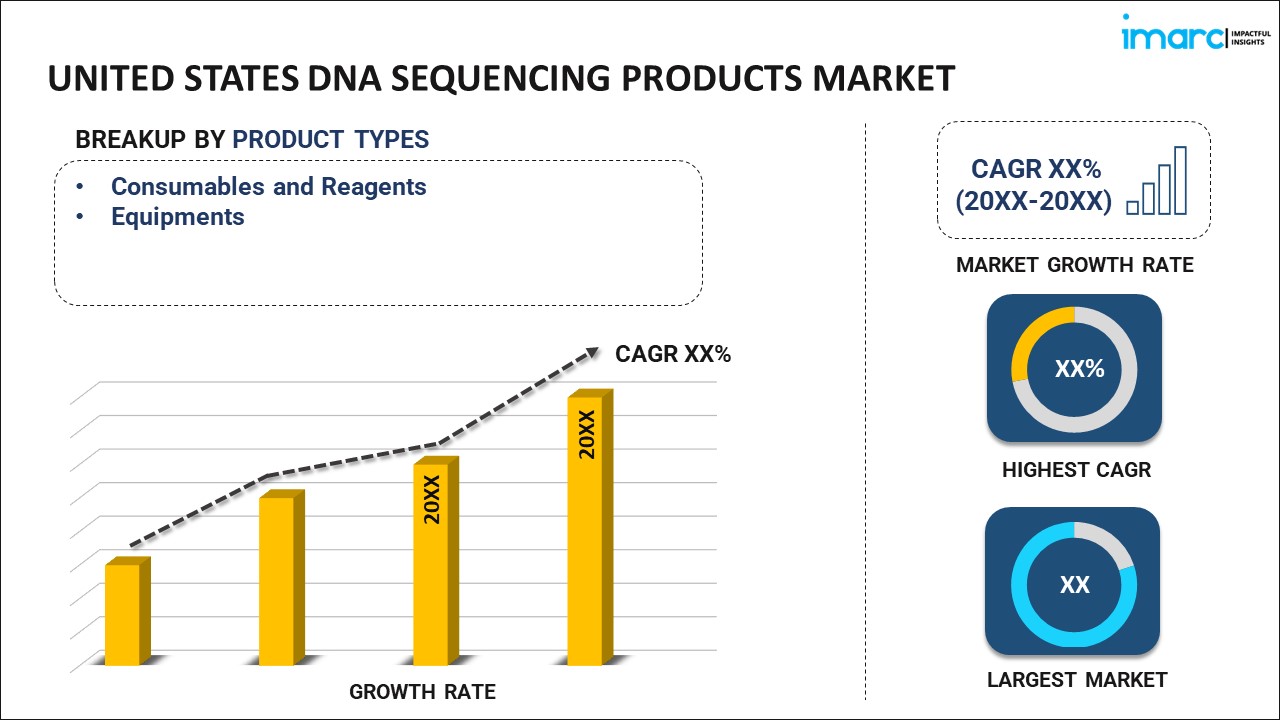
Breakup by Product Type:
To get detailed segment analysis of this market Request Sample
- Consumables and Reagents
- Equipments
Breakup by Application:
- Biomarkers
- Diagnostics
- Reproductive Health
- Forensics
- Personalized Medicine
- Others
Breakup by End User:
- Academic and Government Research Institutes
- Pharmaceutical and Biotechnology Companies
- Hospitals and Clinics
- Others
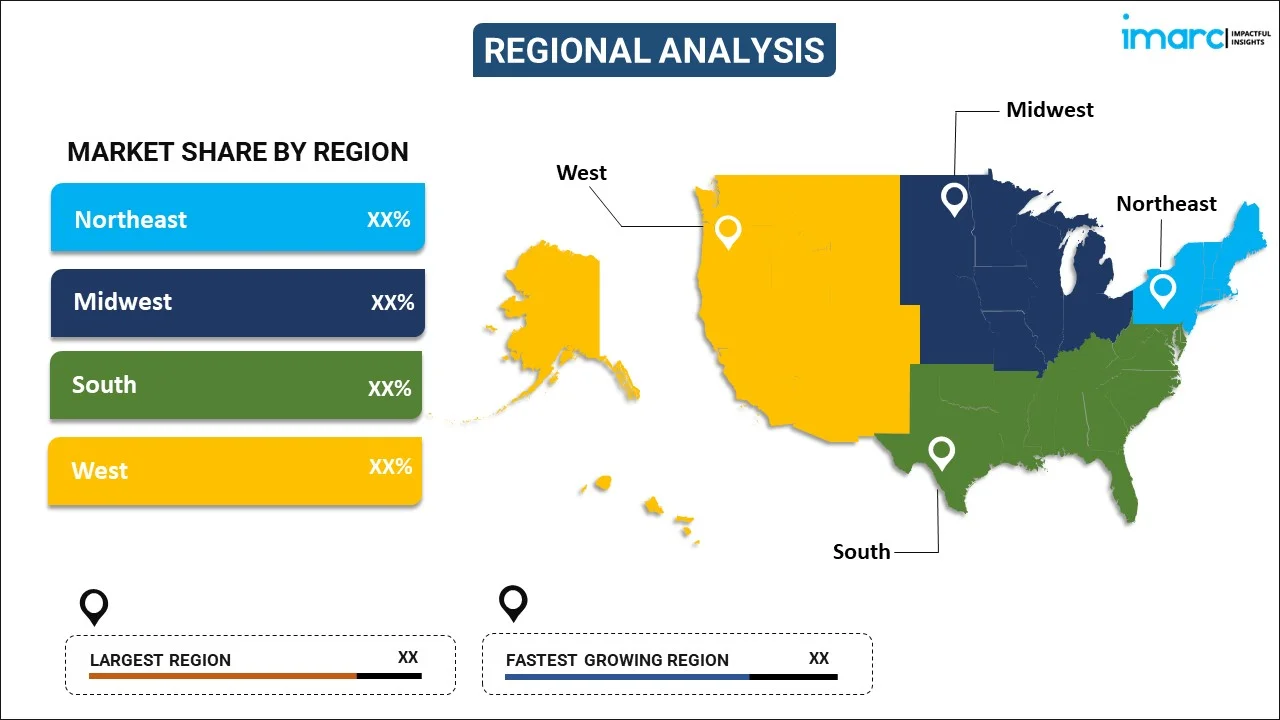
Breakup by Region:
To get detailed regional analysis of this market Request Sample
- Northeast
- Midwest
- South
- West
Competitive Landscape:
The competitive landscape of the industry has also been examined along with the profiles of the key players.
United States DNA Sequencing Products Market News:
- September 2025: Illumina launched its Protein Prep assay in the United States, enabling researchers to measure 9,500 human protein targets. The NGS-based proteomics platform supports multiomics studies, accelerates drug discovery, and provides insights into rare diseases, oncology, and cardiometabolic conditions, enhancing large-scale genomic and clinical research.
- March 2024: Nucleus Genomics launched its clinical-grade whole-genome sequencing service in the United States. The platform integrates DNA, lifestyle, and health data to provide personalized insights on disease risks, traits, and polygenic scores, making advanced genomic analysis broadly accessible for public use.
- June 2024: Thermo Fisher Scientific unveiled its new Stellar mass spectrometer at the ASMS conference in Anaheim, California. Designed for high throughput, sensitivity, and ease of use, the platform supports translational omics research, advanced drug development, and integrated workflows across pharma, biopharma, and analytical laboratories.
Report Coverage:
| Report Features | Details |
|---|---|
| Base Year of the Analysis | 2025 |
| Historical Period | 2020-2025 |
| Forecast Period | 2026-2034 |
| Units | Billion USD |
| Segment Coverage | Product Type, Application, End User, Region |
| Region Covered | Northeast, Midwest, South, West |
| Customization Scope | 10% Free Customization |
| Post-Sale Analyst Support | 10-12 Weeks |
| Delivery Format | PDF and Excel through Email (We can also provide the editable version of the report in PPT/Word format on special request) |
Frequently Asked Questions About the United States DNA Sequencing Products Market Report
The United States DNA sequencing products market was valued at USD 3.9 Billion in 2025.
The DNA sequencing products market in United States is projected to exhibit a CAGR of 12.00% during 2026-2034, reaching a value of USD 11.2 Billion by 2034.
The market is primarily driven by significant growth in bioinformatics, advanced data toolkit launches for viral sequence detection, rapid advancements in sequencing technologies including synthesis and second-generation sequencing and increasing public-private investments in research and development activities for innovative DNA sequencing products.
Need more help?
- Speak to our experienced analysts for insights on the current market scenarios.
- Include additional segments and countries to customize the report as per your requirement.
- Gain an unparalleled competitive advantage in your domain by understanding how to utilize the report and positively impacting your operations and revenue.
- For further assistance, please connect with our analysts.
 Request Customization
 Speak to an Analyst
 Request Brochure
 Inquire Before Buying
Benefits of Customization
- Personalize this research
- Triangulate with your data
- Get data as per your format and definition
- Gain a deeper dive into a specific application, geography, customer, or competitor
- Any level of personalization
Get in Touch With Us
UNITED STATES
Phone: +1-201-971-6302
INDIA
Phone: +91-120-433-0800
UNITED KINGDOM
Phone: +44-753-714-6104
Email: [email protected]
Client Testimonials


.webp)


