
United States Fumaric Acid Market Size, Share, Trends and Forecast by Application, End Use Industry, and Region, 2026-2034
United States Fumaric Acid Market Size, Share, Trends & Forecast (2026-2034)
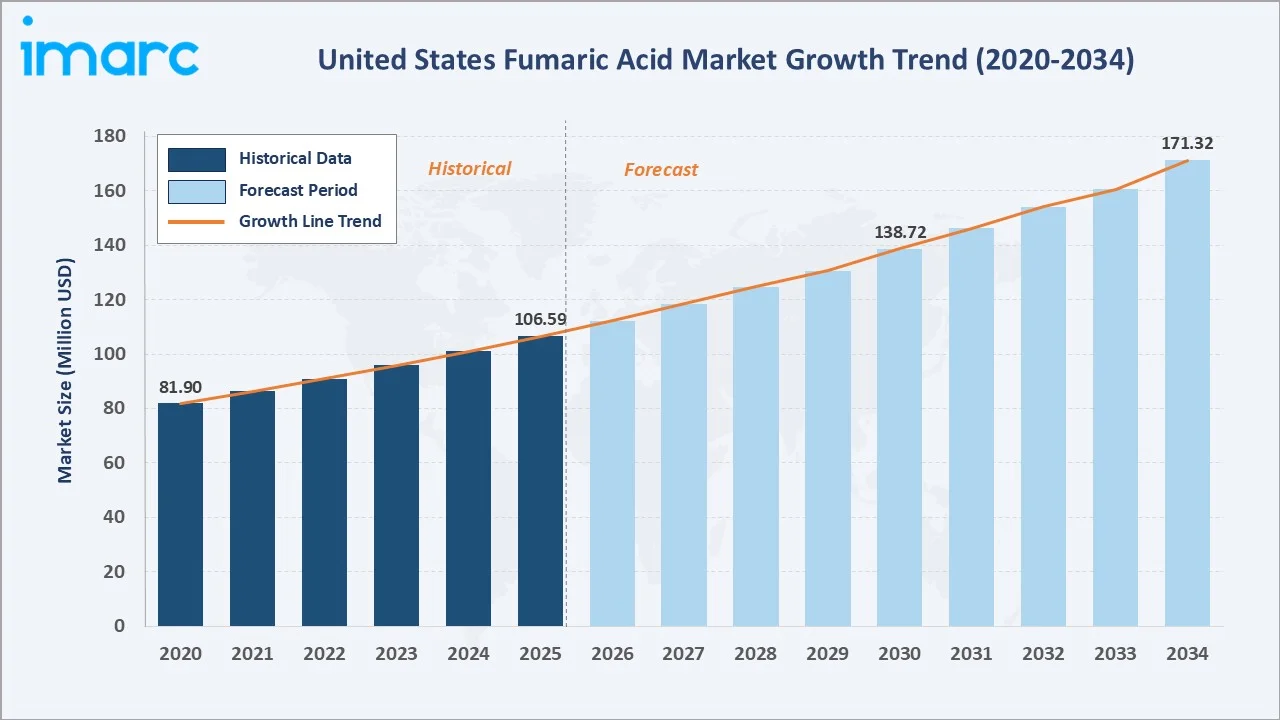
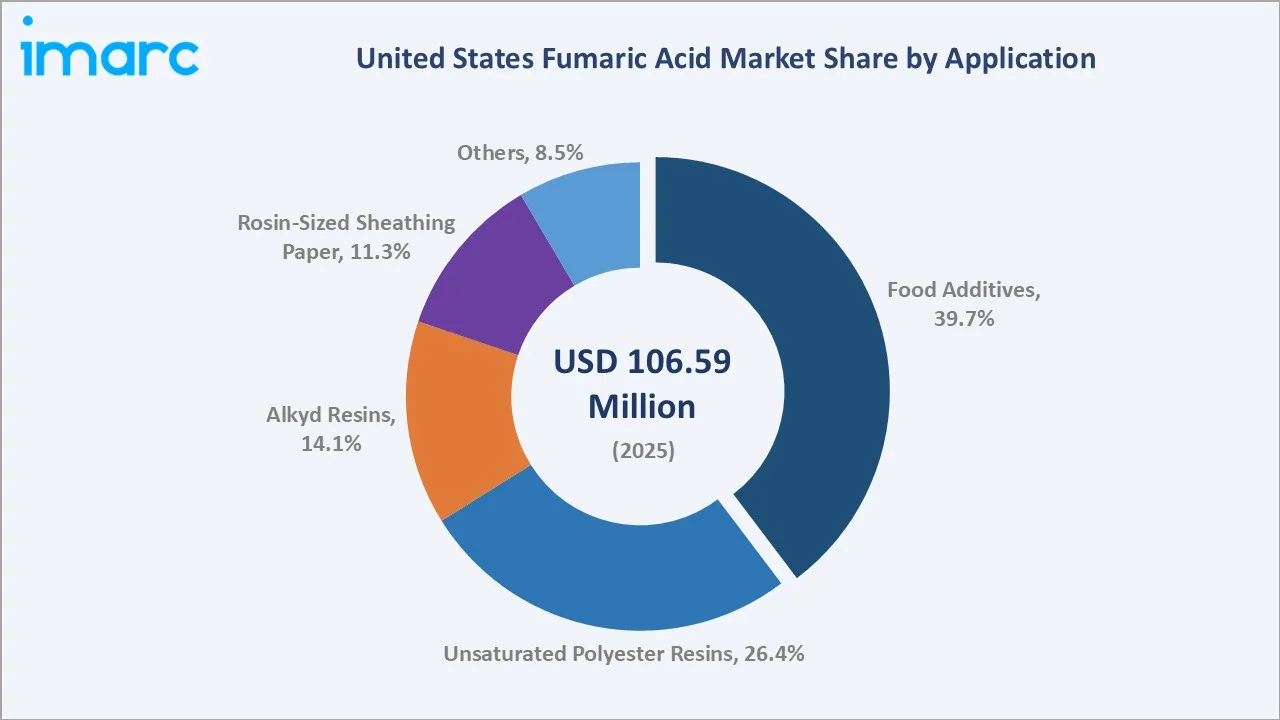
The United States fumaric acid market size reached USD 106.59 Million in 2025 and is projected to reach USD 171.32 Million by 2034, growing at a CAGR of 5.41% during 2026-2034. The market is driven by rising demand from food processing, unsaturated polyester resin manufacturing, pharmaceutical formulations, and personal care applications. Its GRAS status and multifunctional chemical properties continue to expand its industrial, nutritional, and healthcare applications.
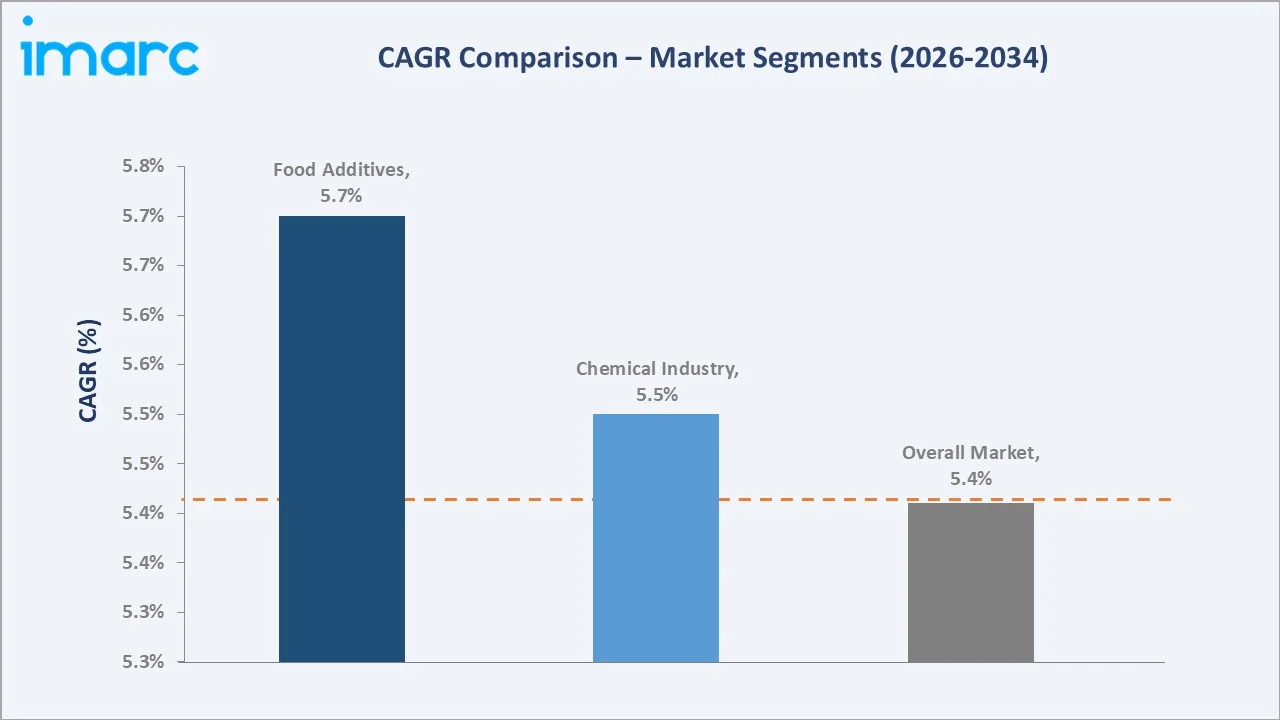
Food Additives lead application share at 39.7% in 2025. The Food and Beverages Industry commands 42.8% end-use share. The Midwest leads regionally at 31.9%, anchored by concentrated food processing and chemical manufacturing infrastructure.
Market Snapshot
|
Metric |
Value |
|
Market Size (2025) |
USD 106.59 Million |
|
Forecast Market Size (2034) |
USD 171.32 Million |
|
CAGR (2026-2034) |
5.41% |
|
Base Year |
2025 |
|
Historical Period |
2020-2025 |
|
Forecast Period |
2026-2034 |
|
Dominant Application |
Food Additives (39.7%, 2025) |
|
Dominant End Use Industry |
Food and Beverages Industry (42.8%, 2025) |
|
Leading Region |
Midwest (31.9%, 2025) |
The market expanded from USD 81.90 Million in 2020 to USD 106.59 Million in 2025, anchored at USD 138.72 Million in 2030, and forecast to reach USD 171.32 Million by 2034. Demand from food processing and industrial polymer applications sustained consistent growth through the historical period.
To get more information on this market, Request Sample
Food Additives application grows steadily as demand for shelf-stable, GRAS-compliant acidulants in the US food processing industry continues. Unsaturated Polyester Resins grow at a higher trajectory, driven by infrastructure investment and lightweight composite demand in the automotive and construction sectors through the forecast period.
Executive Summary
The United States fumaric acid market reached USD 106.59 Million in 2025, representing a mature yet steadily expanding specialty chemical category driven by the compound's multifunctional applications across food, industrial, and healthcare sectors. The market is projected to reach USD 171.32 Million by 2034.
The Food Additives application segment at 39.7% dominates by capturing broad-based demand from food manufacturers. The Food and Beverages Industry at 42.8% leads end-use through large-scale acidulant procurement. The Midwest at 31.9% leads regionally through its concentration of food processing and chemical manufacturing infrastructure.
Key Market Insights
|
Insight |
Data |
|
Dominant Application |
Food Additives – 39.7% share (2025) |
|
Dominant End Use Industry |
Food and Beverages Industry – 42.8% market share (2025) |
|
Leading Region |
Midwest – 31.9% market share (2025) |
|
Market Opportunity |
Bio-based fumaric acid; green UPR for construction; pharma excipients; personal care growth |
Key Analytical Observations Supporting The Above Data:
- Food Additives at 39.7%: Fumaric acid's superior acidity, shelf stability, and GRAS designation make it the preferred acidulant in baked goods, beverages, and processed foods, sustaining high-volume industrial procurement from US food manufacturers.
- Food and Beverages Industry at 42.8%: Large-scale adoption as a preservative, pH regulator, and flavor modifier across US processed food manufacturing generates the highest end-use volumes, reinforcing the sector's dominant market position.
- Midwest at 31.9%: The Midwest's concentration of food processing plants, resin manufacturers, and chemical distribution infrastructure positions it as the primary US regional fumaric acid consumption hub with the broadest industrial base.
United States Fumaric Acid Market Overview
The United States fumaric acid market encompasses the supply of fumaric acid for food additive, industrial polymer, pharmaceutical, and personal care applications. The ecosystem integrates maleic anhydride raw material suppliers, chemical manufacturers, specialty ingredient distributors, and diverse end-user industries across food, pharma, coatings, and polymer sectors.
Macroeconomic factors include demand for processed and convenience food products, construction sector activity linked to UPR demand, pharmaceutical R&D investment, and evolving regulatory standards governing food additives and specialty chemicals. Market growth is characterized as steady and application-driven rather than cyclical or highly volatile.
Market Dynamics
To evaluate market opportunities, Request Sample
Market Drivers
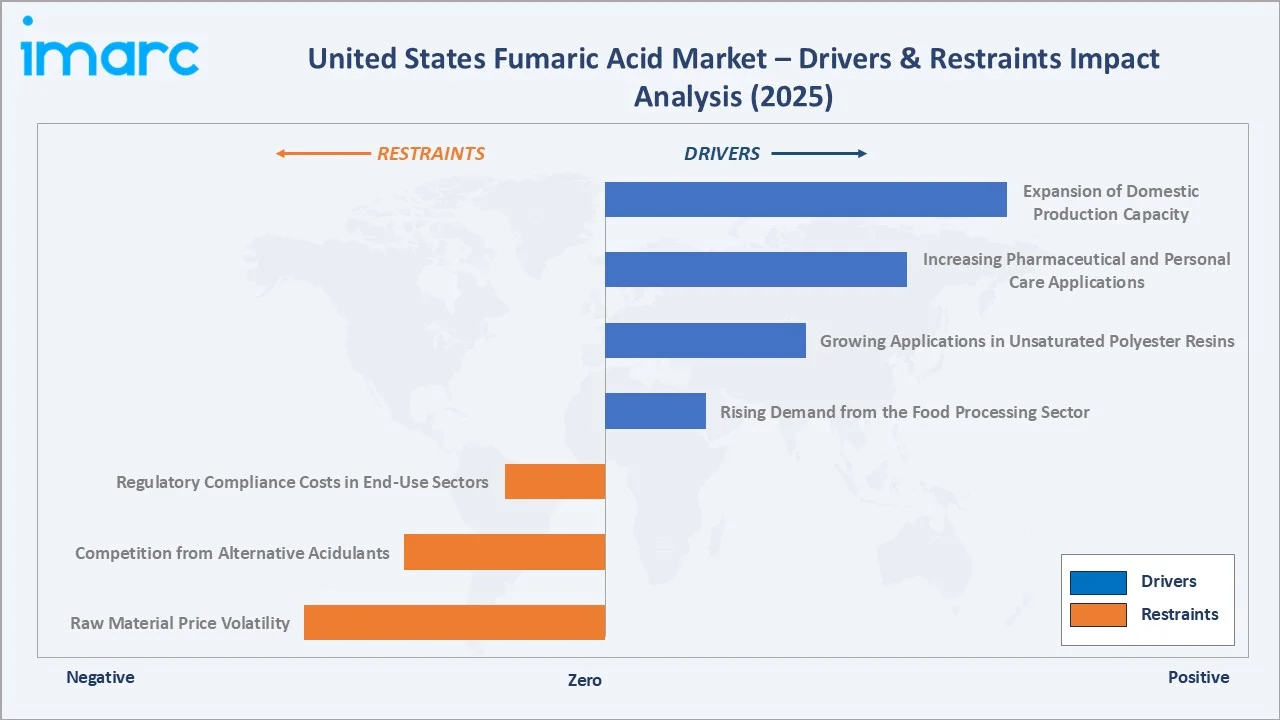
- Rising Demand from the Food Processing Sector: Fumaric acid's GRAS status, superior acidity, and long shelf life make it a cost-effective acidulant for bakery, beverage, and processed food manufacturers. Expanding US demand for shelf-stable and convenience food products is a primary structural driver of fumaric acid market volume growth.
- Growing Applications in Unsaturated Polyester Resins: Fumaric acid serves as a key chemical intermediate in UPR manufacturing for construction, automotive, and marine composite applications. Rising US infrastructure investment and demand for lightweight, corrosion-resistant materials are driving incremental industrial fumaric acid consumption.
- Increasing Pharmaceutical and Personal Care Applications: Fumaric acid's role as an excipient in controlled-release drug delivery and its use in dermatological treatments for psoriasis are expanding healthcare demand. Growing interest in multifunctional, regulatory-compliant additives supports pharmaceutical-grade fumaric acid procurement.
- Expansion of Domestic Production Capacity: New greenfield investments are enhancing domestic supply security and reducing US import dependence, supporting steady market growth.
Market Restraints
- Raw Material Price Volatility: Fumaric acid is primarily manufactured from maleic anhydride, which is derived from petroleum feedstocks. Fluctuations in crude oil prices and maleic anhydride supply availability create input cost uncertainty for producers, potentially constraining margins and dampening capacity expansion.
- Competition from Alternative Acidulants: Citric acid, malic acid, and tartaric acid compete with fumaric acid across food and beverage applications. Price competitiveness and evolving consumer preferences for alternative organic acids create substitution risk, particularly as the clean-label food processing trend continues.
- Regulatory Compliance Costs in End-Use Sectors: Applications in food, pharmaceuticals, and personal care are subject to FDA and EPA regulatory frameworks. Compliance costs, labeling requirements, and evolving food additive regulations increase operational burden and can slow adoption of fumaric acid in new application areas.
Market Opportunities
- Bio-Based Fumaric Acid Production: Emerging bio-based production processes using fermentation of renewable carbon sources offer lower carbon footprint and sustainable sourcing credentials. Growing demand for bio-based specialty chemicals from clean-label food manufacturers and green polymer producers creates growth opportunities.
- Green Unsaturated Polyester Resins for Construction: Rising US investment in sustainable construction materials is increasing demand for bio-compatible and low-emission resins. Fumaric acid-based UPRs offer improved sustainability profiles, positioning suppliers to capture premiums from green building and infrastructure projects.
Market Challenges
- Import Dependence on Upstream Maleic Anhydride: According to the US International Trade Commission, US imports of maleic anhydride totaled approximately 96,000 metric tons, highlighting supply chain vulnerability. Dependence on imported upstream feedstocks exposes domestic fumaric acid producers to geopolitical and logistics supply disruptions.
- Competing Clean-Label Formulation Trends: Consumer and manufacturer preference for reduced additive lists can lead food processors to reformulate away from synthetic or chemically derived acidulants. This creates an ongoing reformulation headwind that fumaric acid suppliers must address through clean-label and bio-based product positioning.
Emerging Market Trends
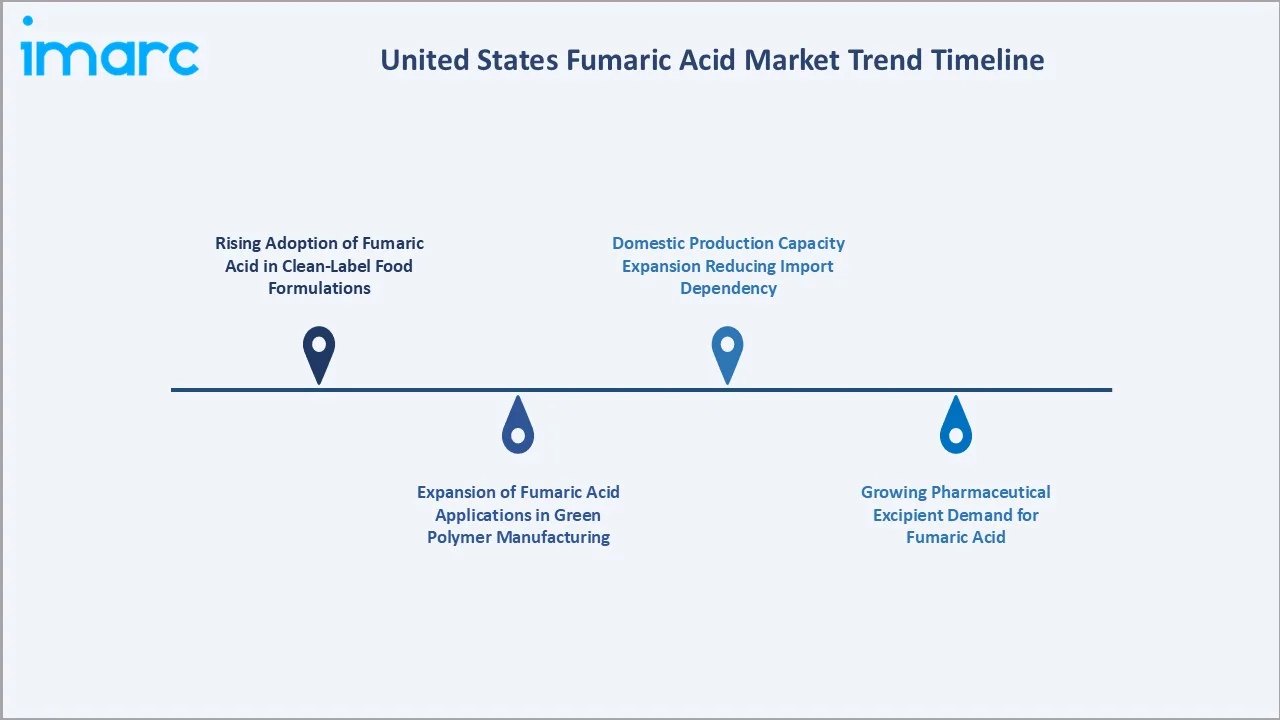
1. Rising Adoption of Fumaric Acid in Clean-Label Food Formulations
Consumer demand for shorter, cleaner ingredient lists is driving food manufacturers to evaluate fumaric acid as a multifunctional, naturally derived acidulant. Its GRAS regulatory status, higher acidity per unit, and superior stability compared to many alternatives position it favorably in clean-label bakery, beverage, and dairy formulations. Adoption is expanding across US specialty food manufacturers.
2. Expansion of Fumaric Acid Applications in Green Polymer Manufacturing
Growing US infrastructure investment and automotive lightweighting trends are driving demand for unsaturated polyester resins incorporating fumaric acid. New bio-based UPR formulations, including glass fiber-reinforced composites for wind turbine blades and construction panels, are increasing the technical and commercial role of fumaric acid as a bio-compatible polymer intermediate.
3. Growing Pharmaceutical Excipient Demand for Fumaric Acid
Fumaric acid is increasingly adopted as a pharmaceutical excipient for controlled-release drug delivery systems and dermatological treatments. Rising US healthcare spending, growing psoriasis treatment markets, and increased pharmaceutical R&D investment in innovative drug delivery are expanding demand for high-purity pharmaceutical-grade fumaric acid from specialty chemical suppliers.
4. Domestic Production Capacity Expansion Reducing Import Dependency
Major investments in new North American fumaric acid production plants are reshaping the US supply landscape. Increased domestic production capacity, combined with sustainability improvements, is positioning the US market for greater supply self-sufficiency and competitive pricing stability.
Industry Value Chain Analysis
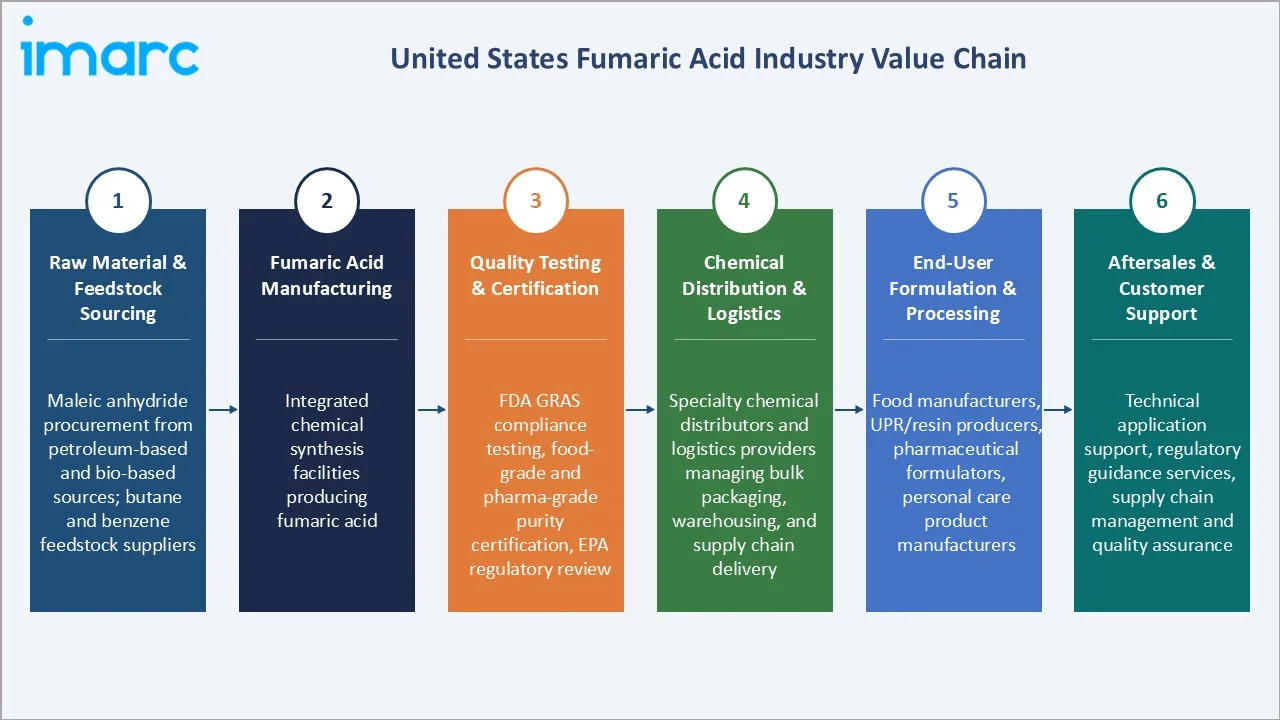
The fumaric acid value chain integrates petroleum and bio-based feedstock sourcing, maleic anhydride and fumaric acid production, quality testing and regulatory certification, chemical distribution and logistics, end-user formulation and processing, and aftersales technical support. The commercial architecture is evolving toward greater domestic integration as new US production facilities come online.
|
Stage |
Key Participants |
|
Raw Material & Feedstock Sourcing |
Maleic anhydride procurement from petroleum-based and bio-based sources; butane and benzene feedstock suppliers |
|
Fumaric Acid Manufacturing |
Integrated chemical synthesis facilities producing fumaric acid |
|
Quality Testing & Certification |
FDA GRAS compliance testing, food-grade and pharma-grade purity certification, EPA regulatory review |
|
Chemical Distribution & Logistics |
Specialty chemical distributors and logistics providers managing bulk packaging, warehousing, and supply chain delivery |
|
End-User Formulation & Processing |
Food manufacturers, UPR/resin producers, pharmaceutical formulators, personal care product manufacturers |
|
Aftersales & Customer Support |
Technical application support, regulatory guidance services, supply chain management and quality assurance |
The raw material and maleic anhydride sourcing tier is the value chain's most commercially sensitive stage, with US import dependency creating procurement risk. The distribution and logistics tier is experiencing consolidation as large specialty chemical distributors expand their reach across food, industrial, and pharmaceutical customer segments.
Technology Landscape in the United States Fumaric Acid Industry
Petrochemical Maleic Anhydride Oxidation Technology
Conventional fumaric acid production via catalytic isomerization of maleic acid derived from maleic anhydride oxidation of butane or benzene remains the industry's dominant production technology. This process offers mature scalability, consistent product purity, and established cost economics for food-grade and industrial-grade fumaric acid production.
Bio-Based Fermentation Production Technology
Emerging bio-based fumaric acid production via fungal fermentation of renewable carbon sources, including glucose and xylose from agricultural residues, offers a lower carbon footprint and bio-derived origin credentials.
Advanced Purification and Pharmaceutical-Grade Processing
High-purity fumaric acid production for pharmaceutical excipient and dermatological treatment applications requires advanced crystallization, filtration, and purity validation technologies. Growing demand for pharmaceutical-grade fumaric acid is driving investment in refined purification processes that meet stringent US Pharmacopeia and FDA excipient quality standards.
Market Segmentation Analysis
The report covers the following segments:
|
Segment Category |
Leading Segment |
Market Share |
Year |
|
Application |
Food Additives |
39.7% |
2025 |
|
End Use Industry |
Food and Beverages Industry |
42.8% |
2025 |
|
Region |
Midwest |
31.9% |
2025 |

By Application
Food Additives leads at 39.7% in 2025, capturing the highest-volume end-use of fumaric acid as an acidulant, preservative, and pH modifier in US food processing. The segment benefits from GRAS regulatory status and broad acceptance across bakery, beverage, dairy, and instant food categories in the US processed food industry.
To access detailed market analysis, Request Sample
Unsaturated Polyester Resins at 26.4% is the second-largest segment, driven by construction, automotive, and marine composite demand. Alkyd Resins at 14.1% serve the coatings and paints sector. Rosin-Sized Sheathing Paper at 11.3% supports specialty paper applications. Others at 8.5% covers pharmaceutical, personal care, and niche industrial uses.
By End Use Industry
The Food and Beverages Industry lead at 42.8% through high-volume acidulant and preservative procurement by US food manufacturers. Its dominant position reflects fumaric acid's indispensable role as a cost-effective, shelf-stable food-grade organic acid across major processed food and beverage categories in the US market.

The Chemical Industry at 24.6% covers resin, coating, and polymer manufacturers. The Pharmaceutical Industry at 16.7% procures fumaric acid for drug formulation and dermatological applications. The Cosmetics Industry at 9.4% uses it as a pH adjuster in skincare. Others at 6.5% includes agricultural and specialty industrial uses.
Regional Market Insights
|
Region |
Share (2025) |
Key Fumaric Acid Market Drivers & Characteristics |
|
Midwest |
31.9% |
Concentrated food processing, grain processing, and chemical manufacturing bases drive the highest US regional demand for fumaric acid |
|
South |
30.4% |
Large-scale food and beverage production, automotive composites, and the growing industrial chemicals sector support strong fumaric acid consumption |
|
Northeast |
20.7% |
Pharmaceutical formulation, specialty chemicals, and personal care applications generate premium demand for high-purity fumaric acid |
|
West |
17.0% |
Clean-label food trends, bio-based ingredient demand, and the growing natural personal care sector drive Western US fumaric acid consumption |
The Midwest at 31.9% leads through its concentration of food processing plants and chemical manufacturing infrastructure, making it the single largest US consumption region. The South, at 30.4%, is closely behind due to its large food and beverage production base and growing composites manufacturing sector.
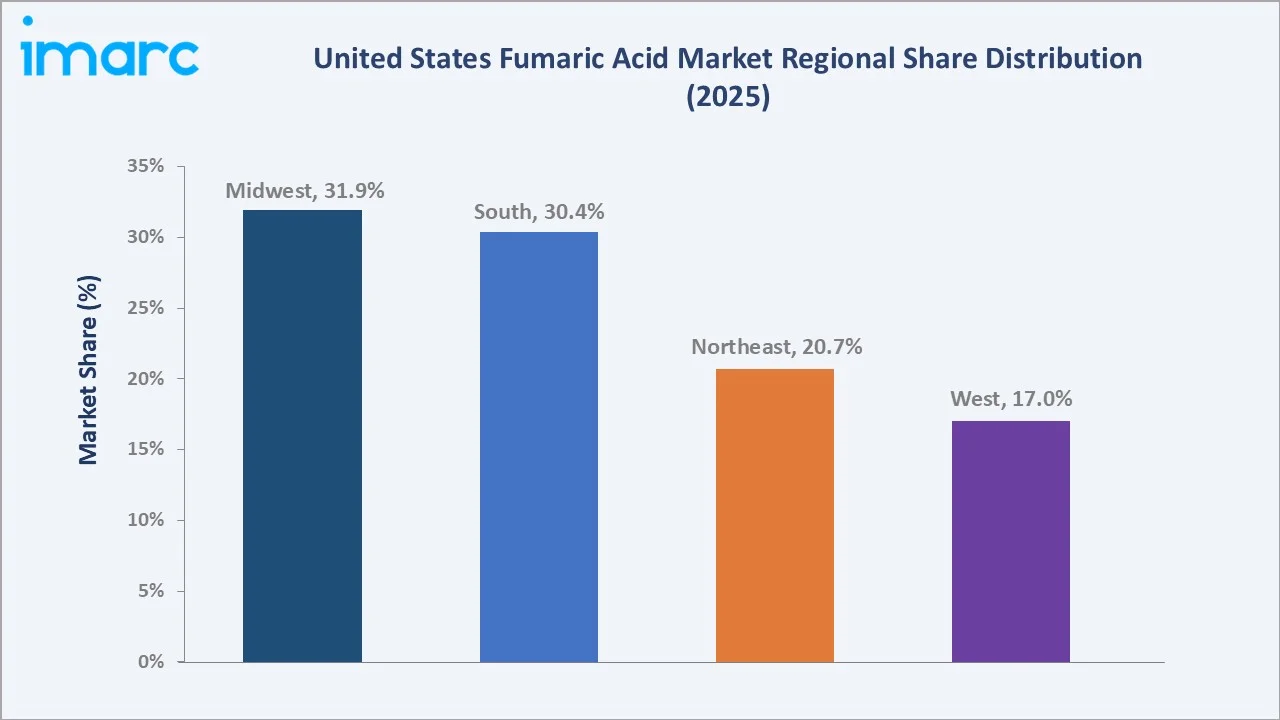
The Northeast at 20.7% reflects pharmaceutical and specialty chemical procurement, representing higher-value per-unit demand for pharmaceutical-grade fumaric acid. The West at 17.0% is the smallest but fastest-developing region, driven by clean-label food manufacturing and natural personal care product growth in California and Pacific Northwest markets.
Competitive Landscape
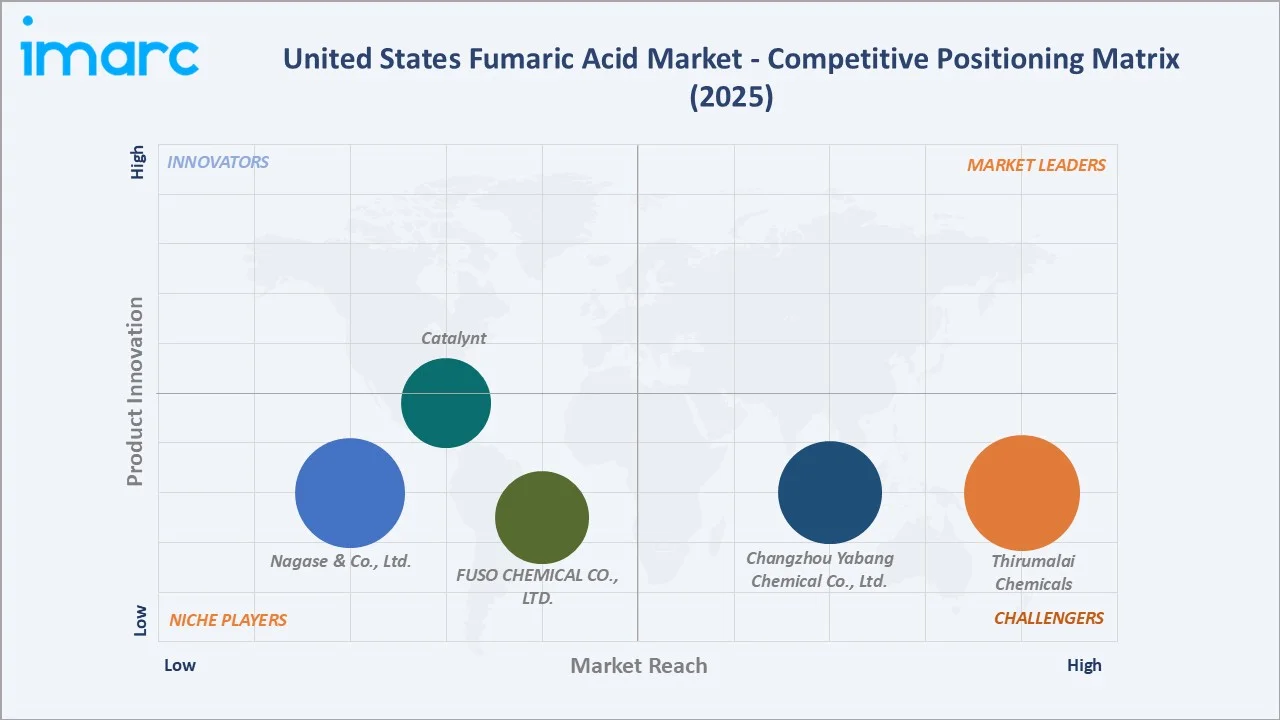
The United States fumaric acid market competitive landscape is moderately concentrated, with established chemical producers, specialty ingredient distributors, and global chemical companies competing on product quality, regulatory compliance, supply reliability, domestic manufacturing capability, and pricing.
|
Company Name |
Key Products |
Market Position |
Core Strength |
|
Thirumalai Chemicals |
Fumaric acid |
Strong Challenger |
Greenfield 30,000-tonne US plant in West Virginia; integrated upstream maleic anhydride production positioning |
|
Changzhou Yabang Chemical Co., Ltd. |
Fumaric acid for food and industrial applications |
Challenger |
Major Asian fumaric acid producer with US distribution through specialty chemical distributor partnerships |
|
Nagase & Co., Ltd. |
Fumaric Acid |
Niche |
Japan-headquartered global chemical trading company with a supplier network, distributes fumaric acid across food, pharmaceutical, and industrial sectors |
|
FUSO CHEMICAL CO., LTD. |
Fumaric acid |
Niche |
Japan-based specialty organic acid manufacturer with deep expertise in high-purity fumaric acid production; supplies food, pharmaceutical, and industrial segments globally |
|
Catalynt |
Fumaric acid |
Emerging |
One of North America's largest certified women-owned specialty chemical distributors; supplies fumaric acid across food, pharmaceutical, personal care, and industrial sectors |
Key players include Thirumalai Chemicals, Changzhou Yabang Chemical Co., Ltd., Nagase & Co., Ltd., FUSO CHEMICAL CO., LTD., Catalynt, and others.
Key Company Profiles
Thirumalai Chemicals
Thirumalai Chemicals is an India-headquartered specialty chemical company with a significant US market investment through its greenfield manufacturing plant development in West Virginia, targeting North American fumaric acid and maleic anhydride supply as a domestically integrated producer.
- Key Products: Fumaric acid
- Strategic Focus: Establishing a fully integrated US manufacturing footprint for fumaric acid and upstream maleic anhydride; positioning as a domestic supplier to reduce US import dependency and capture growing demand from food, polymer, and pharmaceutical end-use sectors.
Catalynt
Catalynt is a US-based specialty chemical distributor and one of North America's largest certified women-owned raw material suppliers, serving food, pharmaceutical, personal care, industrial, and agricultural customers across North America through an extensive multi-point stocking and import network.
- Key Products: Fumaric acid
- Strategic Focus: Expanding its position as a full-service specialty chemical distribution partner for US food, pharmaceutical, and personal care manufacturers; leveraging its women-owned certification, broad supplier network, and multi-point logistics infrastructure to provide fumaric acid and complementary ingredient solutions with supply chain reliability and customer-specific formulation support.
Market Concentration Analysis
The US fumaric acid market is moderately concentrated, with the top two players collectively accounting for most of the domestic production capacity. Global producers supply significant import volumes, particularly for industrial and cost-sensitive applications. Distribution-tier companies collectively serve a broad base of US food, pharmaceutical, and industrial customers.
International import competition from Asian producers will continue in the industrial-grade segment, while the food-grade and pharmaceutical-grade segments will remain dominated by North American producers with certified supply chains and regulatory compliance.
Investment & Growth Opportunities
Highest Growth Segments
Pharmaceutical excipient applications (~6.5% CAGR), bio-based fumaric acid production (~7-8% CAGR from smaller base), UPR for green construction (~6.2% CAGR), personal care pH modifier applications (~6.0% CAGR), and natural clean-label food acidulants (~5.8% CAGR) represent the highest-growth investment vectors in the US fumaric acid market through 2034.
Emerging Investment Opportunities
Green polymer applications represent the US fumaric acid market's highest per-unit-value emerging opportunity. Fumaric acid-based UPR for wind turbine blade composites, green building panels, and lightweight automotive parts generates premium pricing above conventional food-grade applications, with rising US infrastructure and sustainability mandates creating a structurally growing demand pool through the forecast period.
Investment Themes
- Domestic production capacity investment for fumaric acid and upstream maleic anhydride manufacturing: New US production plants offer supply security, logistics advantages, and regulatory compliance benefits that justify premium pricing from food and pharmaceutical customers seeking certified domestic supply chains.
- Bio-based fumaric acid production technology investment targeting clean-label food and green polymer markets: Bio-derived fumaric acid commands pricing premiums from sustainability-focused customers and positions producers for growing regulatory and consumer pressure toward bio-based specialty chemicals in food and industrial applications.
Future Market Outlook (2026-2034)
The United States fumaric acid market is projected to grow from USD 106.59 Million in 2025 to USD 171.32 Million by 2034, delivering a 5.41% CAGR over the forecast period. The market's anchor value of USD 138.72 Million in 2030 reflects a market at a key mid-cycle commercial milestone, with domestic production expansion and pharmaceutical diversification reshaping competitive dynamics.
Three structural forces define US fumaric acid market growth through 2034. Domestic production capacity expansion by Bartek and Thirumalai is expected to shift the US market from import-dependent to partially self-sufficient, with pricing implications for all application segments. Pharmaceutical and personal care demand diversification is expected to raise the average per-unit value of US fumaric acid consumption above the baseline food-grade pricing level. Bio-based production investment is expected to unlock premium market segments and strengthen sustainability credentials for US producers competing in clean-label food and green polymer markets.
Research Methodology
Primary Research
Primary research comprised structured interviews with 40+ industry stakeholders (2025), including food ingredient procurement managers, specialty chemical manufacturers, pharmaceutical excipient suppliers, UPR and resin producers, chemical distributors, and regulatory affairs specialists across key US market participants and international suppliers.
Secondary Research
Secondary research encompassed company annual reports, FDA GRAS notifications database, US International Trade Commission trade data for maleic anhydride and fumaric acid, American Chemistry Council industry statistics, food ingredient market databases, EPA chemical inventory data, and over 50 industry publications and trade press sources reviewed for the report.
Forecasting Models
Market revenue forecasts developed using application-based bottom-up modeling: (i) US food acidulant demand forecasting by food processing sector growth rates; (ii) UPR and alkyd resin demand projections linked to construction and automotive sector investment; (iii) pharmaceutical and personal care application-specific CAGR modeling; (iv) blended market CAGR triangulation from primary and secondary data sources.
Report Coverage:
| Report Features | Details |
|---|---|
| Base Year of the Analysis | 2025 |
| Historical Period | 2020-2025 |
| Forecast Period | 2026-2034 |
| Units | Million USD |
| Scope of the Report | Exploration of Historical Trends and Market Outlook, Industry Catalysts and Challenges, Segment-Wise Historical and Future Market Assessment:
|
| Applications Covered | Food Additives, Rosin-Sized Sheathing Paper, Unsaturated Polyester Resins, Alkyd Resins, Others |
| End Use Industries Covered | Food and Beverages Industry, Cosmetics Industry, Pharmaceutical Industry, Chemical Industry, Others |
| Regions Covered | Northeast, Midwest, South, West |
| Companies Covered | Thirumalai Chemicals, Changzhou Yabang Chemical Co. Ltd., Nagase & Co. Ltd., FUSO CHEMICAL CO. LTD., Catalynt, etc. |
| Customization Scope | 10% Free Customization |
| Post-Sale Analyst Support | 10-12 Weeks |
| Delivery Format | PDF and Excel through Email (We can also provide the editable version of the report in PPT/Word format on special request) |
Frequently Asked Questions About the US Fumaric Acid Market Report
The United States fumaric acid market size reached USD 106.59 Million in 2025, driven by Food Additives leading application at 39.7%, Food and Beverages Industry commanding 42.8% end-use share, and the Midwest leading regional demand at 31.9% through its concentration of food processing and chemical manufacturing infrastructure.
The market grows at a CAGR of 5.41% during 2026-2034, reaching USD 171.32 Million by 2034, driven by expanding food processing demand, industrial resin applications, pharmaceutical excipient growth, and increasing domestic production capacity from new US manufacturing investments.
Food Additives leads at 39.7%, capturing broad-based demand from bakery, beverage, and processed food manufacturers. Unsaturated Polyester Resins at 26.4% is the second-largest application, driven by construction and automotive composite demand in the US industrial sector.
The Food and Beverages Industry leads at 42.8% through large-scale acidulant and preservative procurement by US food manufacturers. The Chemical Industry at 24.6% is the second-largest end-use sector through resin, coating, and polymer intermediate manufacturing applications.
The Midwest leads at 31.9% through its concentration of food processing plants and chemical manufacturing infrastructure. The South at 30.4% is closely behind through its large food and beverage production base and growing industrial composites manufacturing sector.
Leading companies include Thirumalai Chemicals, Changzhou Yabang Chemical Co., Ltd., Nagase & Co., Ltd., FUSO CHEMICAL CO., LTD., Catalynt, and others.
The United States fumaric acid market is projected to reach approximately USD 138.72 Million by 2030, with Thirumalai Chemicals' new West Virginia plant at full capacity, Bartek's expanded production driving domestic supply growth, pharmaceutical-grade demand expanding, and bio-based fumaric acid production gaining commercial scale.
Three priority investment opportunities: domestic fumaric acid production capacity for supply chain security and food/pharma customer requirements; bio-based fumaric acid production technology targeting clean-label and green polymer premium markets; and pharmaceutical-grade fumaric acid supply for growing excipient and dermatological treatment demand.
Need more help?
- Speak to our experienced analysts for insights on the current market scenarios.
- Include additional segments and countries to customize the report as per your requirement.
- Gain an unparalleled competitive advantage in your domain by understanding how to utilize the report and positively impacting your operations and revenue.
- For further assistance, please connect with our analysts.
 Request Customization
 Speak to an Analyst
 Request Brochure
 Inquire Before Buying
Benefits of Customization
- Personalize this research
- Triangulate with your data
- Get data as per your format and definition
- Gain a deeper dive into a specific application, geography, customer, or competitor
- Any level of personalization
Get in Touch With Us
UNITED STATES
Phone: +1-201-971-6302
INDIA
Phone: +91-120-433-0800
UNITED KINGDOM
Phone: +44-753-714-6104
Email: [email protected]
Client Testimonials


.webp)


