
United States Gaming Market Size, Share, Trends and Forecast by Device Type, Platform, Revenue Type, Type, Age Group, and Region, 2026-2034
United States Gaming Market Size, Share, Trends & Forecast (2026-2034)
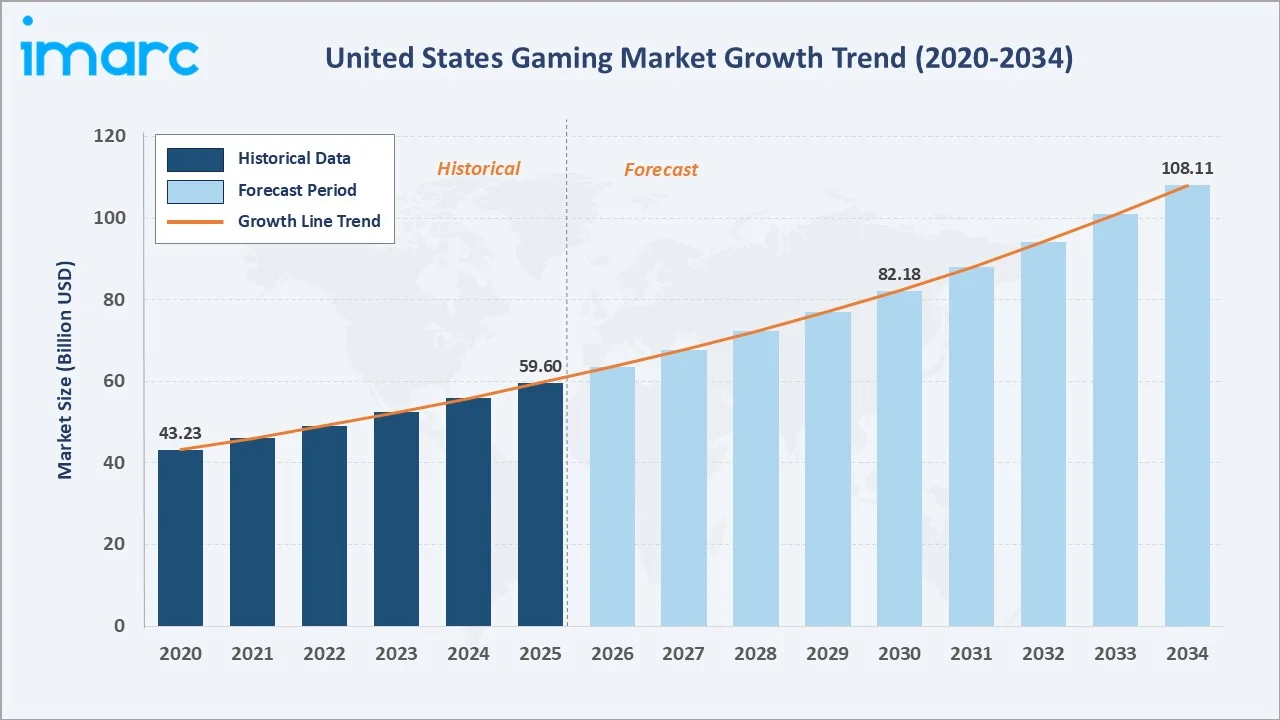
The United States gaming market grew from USD 59.60 Billion in 2025 to USD 63.56 Billion in 2026 and is projected to reach USD 108.11 Billion by 2034, growing at a CAGR of 6.63% during 2026-2034. The US video game market is driven by rapid mobile gaming adoption, expanding cloud platforms, and the proliferation of in-game monetization models.
Growing esports viewership, high-speed 5G penetration, and gaming-as-a-service are further propelling market expansion. In-Game Purchase leads at 46.8%, Online platform commands 76.4%, and the South region dominates at 34.6% of the national market share.
Market Snapshot
|
Metric |
Value |
|
Base Year Market Size (2025) |
USD 59.60 Billion |
|
Market Size (2026) |
USD 63.56 Billion |
|
Forecast Market Size (2034) |
USD 108.11 Billion |
|
CAGR (2026-2034) |
6.63% |
|
Base Year |
2025 |
|
Historical Period |
2020-2025 |
|
Forecast Period |
2026-2034 |
|
Dominant Revenue Type |
In-Game Purchase (46.8%, 2025) |
|
Dominant Platform |
Online (76.4%, 2025) |
|
Leading Region |
South (34.6%, 2025) |
The United States gaming market size increased from USD 43.23 Billion in 2020 to USD 59.60 Billion in 2025 and is estimated to reach USD 63.56 Billion in 2026. The market is further expected to grow to USD 82.18 Billion by 2030 and USD 108.11 Billion by 2034. The US gaming market share is commercially unique among global gaming markets, combining one of the largest mass-consumer mobile gaming markets, a rapidly growing cloud gaming segment, and a premium console and PC market driven by high production-value AAA titles with extended commercial tails through live-service monetization frameworks.
To get more information on this market, Request Sample
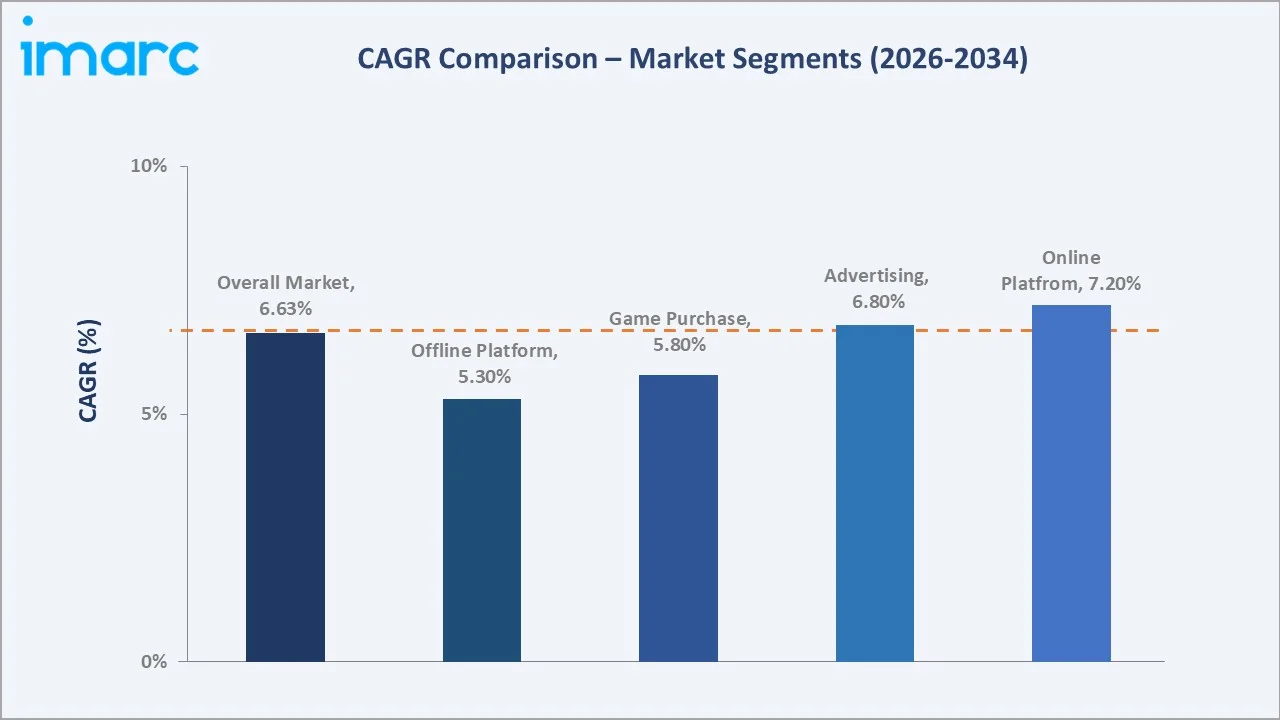
The In-Game Purchase segment grows fastest at ~7.50% CAGR, driven by microtransactions and battle passes across free-to-play mobile and console titles. Online platforms expand at ~7.20% CAGR owing to cloud gaming adoption and digital storefronts displacing physical retail across all demographic segments in the US video game market.
Executive Summary
The United States gaming market expanded to USD 59.60 Billion in 2025 to an estimated USD 63.56 Billion in 2026, cementing its position as the world's largest national gaming economy. The market is underpinned by a vast digital-native consumer base, strong esports culture, and a robust ecosystem of platform operators and publishers.
These structural drivers support above-GDP-growth expansion through 2034, projected at USD 108.11 Billion. In-Game Purchase at 46.8% leads through microtransaction monetization. Online at 76.4% reflects digital distribution dominance. South at 34.6% commands the largest regional share. The US gaming market share analysis confirms concentration among key platform operators and publishers.
Key Market Insights
|
Insight |
Data |
|
Dominant Revenue Type |
In-Game Purchase – 46.8% share (2025) |
|
Dominant Platform |
Online – 76.4% market share (2025) |
|
Leading Region |
South – 34.6% share (2025) |
|
Market Opportunity |
Cloud gaming subscriptions, esports sponsorships, AR/VR gaming, mobile in-game advertising |
Key Analytical Observations Supporting the Above Data:
- In-Game Purchase at 46.8%: Dominates due to recurring microtransactions, seasonal battle passes, and virtual goods embedded within free-to-play titles. This model generates predictable, high-margin recurring revenue for publishers and creates strong player engagement loops.
- Online at 76.4%: Commands the platform majority owing to digital storefronts, cloud streaming, and multiplayer ecosystems that eliminate physical media dependency. Continuous live-service updates and cross-platform connectivity further entrench online as the dominant channel.
- South at 34.6%: Leads regionally due to a large and youthful population, robust broadband infrastructure in metro areas, and strong mobile gaming adoption across Texas, Florida, and Georgia. Rapidly expanding gaming communities in Southern states continue to outpace national average growth.
United States Gaming Market Overview
The United States gaming market represents the world's single largest national gaming economy, integrating console, PC, mobile, and cloud gaming ecosystems. The market is characterized by high per-capita gaming spend, a deeply engaged player base, and a competitive multi-platform landscape.
The ecosystem spans major platform operators, world-class development studios, digital distribution networks, and a robust esports and content-creator economy that amplifies consumer engagement. Rising internet penetration and 5G proliferation are accelerating access across all demographics and geographies.
Market Dynamics
To evaluate market opportunities, Request Sample
Market Drivers
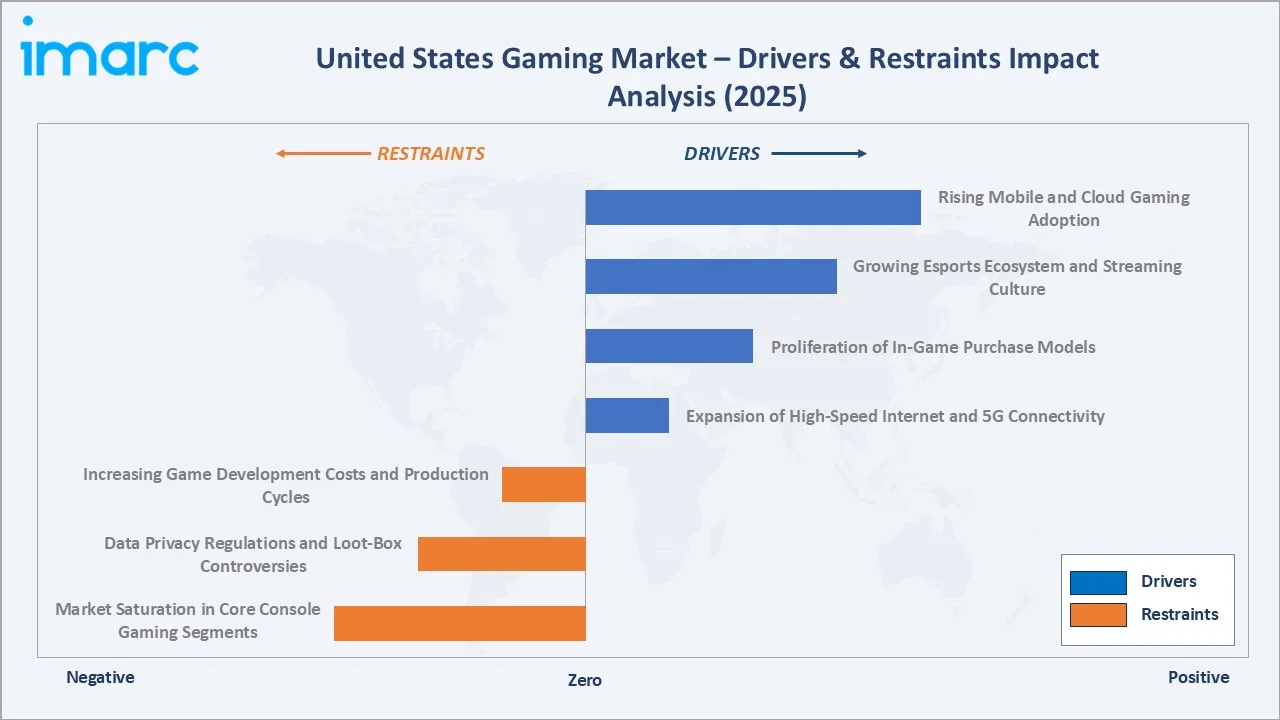
- Rising Mobile and Cloud Gaming Adoption: Rising adoption of smartphones and high-speed 5G networks has lowered barriers to mobile gaming, expanding the addressable market to previously underserved demographics. Mobile gaming now represents a critical revenue channel within the overall United States gaming market, with smartphone game users exceeding 200 million. Cloud gaming further removes hardware investment requirements, enabling new subscribers across lower-income households and regions with limited access to premium gaming hardware.
- Growing Esports Ecosystem and Streaming Culture: Esports tournaments, Twitch streaming, and YouTube Gaming generate billions of viewing hours annually, converting passive audiences into active players. Brands invest heavily in in-game sponsorships and advertising, generating incremental revenue streams beyond conventional title sales. The creator economy amplifies game discovery organically, reducing traditional marketing costs for publishers and sustaining engagement for live-service titles long after initial release.
- Proliferation of In-Game Purchase Models: Free-to-play titles monetized through in-game purchases, battle passes, and virtual cosmetics have transformed revenue structures across the gaming industry. This approach lowers entry barriers while driving sustained recurring revenues from highly engaged player communities. Live-service frameworks enable publishers to extend a title's commercial lifecycle significantly beyond traditional premium release windows, maximizing lifetime value per active player.
- Expansion of High-Speed Internet and 5G Connectivity: Nationwide rollout of 5G networks and government-backed broadband expansion programs extend reliable, low-latency internet access to rural communities and lower-income urban areas. This connectivity improvement directly underpins cloud gaming services and online multiplayer adoption. Improved network infrastructure also supports higher-quality in-game advertising and real-time content updates, enabling richer live-service experiences that drive recurring engagement and spend.
Market Restraints
- Increasing Game Development Costs and Production Cycles: AAA game development budgets have escalated to hundreds of millions of dollars, while production timelines stretch three to five years. This increases financial risk for publishers and has led to studio consolidations and significant layoffs industry-wide. Smaller and mid-tier studios face increasing difficulty competing with major publisher marketing budgets, limiting the volume of commercially successful new IP introductions and reducing the diversity of titles available.
- Data Privacy Regulations and Loot-Box Controversies: Regulatory scrutiny over data collection practices and the classification of loot boxes as gambling in several states poses material compliance risk. Publishers must navigate evolving state-level regulations, increasing legal costs and potentially restricting certain monetization mechanisms. Consumer advocacy groups continue to pressure legislators for stricter oversight, creating uncertainty for publishers dependent on in-game purchase revenues as a primary monetization channel across their title portfolios.
- Market Saturation in Core Console Gaming Segments: The installed base of home consoles is approaching saturation among core gamers, limiting organic hardware-driven market expansion. Publishers increasingly depend on in-game purchases and subscription services to sustain revenue growth within existing player populations. New console hardware cycles require substantial consumer investment, creating delayed adoption that can suppress premium game sales during transition periods between console generations.
Market Opportunities
- Gaming Subscription Service Expansion: Subscription gaming services are creating predictable recurring revenue pools by bundling extensive game libraries with cloud streaming capabilities. Cross-platform compatibility and day-one release inclusion accelerate subscriber growth and reduce reliance on individual title sales. Expanding subscription offerings into mobile and emerging markets provides publishers with a scalable, geographically diverse revenue base that sustains growth independent of console hardware cycle timing.
- Immersive AR/VR/XR Gaming Experiences: AR, VR, and XR technologies are enabling immersive gaming experiences previously constrained by hardware limitations. Declining headset costs and improving content libraries represent a significant monetization opportunity for hardware makers and software publishers. Investment in spatial computing platforms, haptic feedback systems, and motion-tracked interfaces is creating the next wave of premium gaming hardware revenue, targeting early-adopter and entertainment-focused consumer demographics.
Market Challenges
- Player Attention Fragmentation: Player attention is fragmented across thousands of game titles, social media platforms, and streaming services competing for the same engagement time. Publishers face intense competition for engagement minutes, necessitating continuous live-service updates and aggressive marketing expenditure to retain active user bases. Sustaining player engagement over multi-year title lifecycles requires consistent content investment and community management at increasing cost per retained active user.
- Cybersecurity Threats and Online Fraud: Cybersecurity incidents—account hacking, DDoS attacks, and in-game economy fraud—erode player trust and impose significant operational costs. Publishers must invest continuously in security infrastructure to maintain platform integrity and protect in-game economies from exploitation. As virtual economies grow in scale and real-world monetary value, they become increasingly attractive targets for organized cybercrime, requiring publishers to treat security as a core operational and reputational investment priority.
Emerging Market Trends
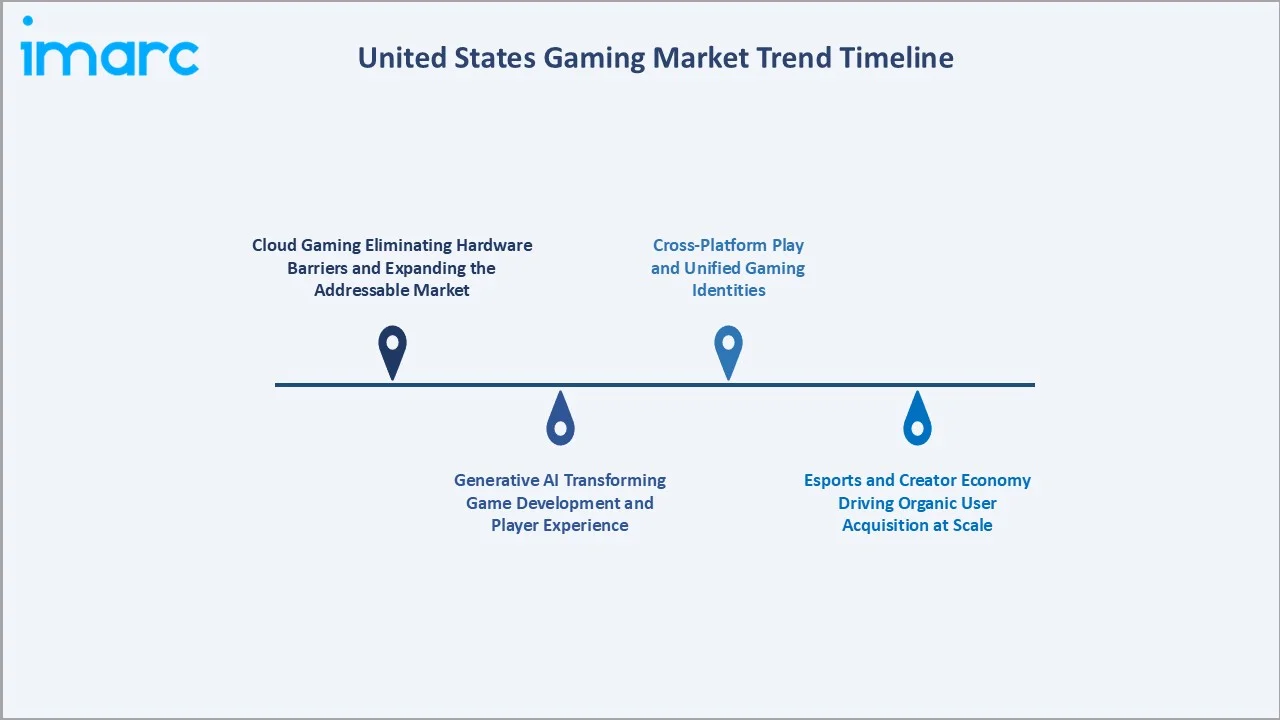
1. Cloud Gaming Eliminating Hardware Barriers and Expanding the Addressable Market
Cloud streaming platforms allow players to access high-fidelity games on low-cost devices without expensive console or PC hardware, rapidly broadening the gaming demographic. Budget-conscious consumers, mobile-first users, and players in regions with limited retail access are entering the gaming ecosystem for the first time through cloud services. Platform operators are investing heavily in server infrastructure and content libraries to capture this expanding subscriber base.
2. Generative AI Transforming Game Development and Player Experience
Generative AI is accelerating game content creation—procedural level design, NPC dialogue, and asset generation—reducing time-to-market and development costs meaningfully. Studios leveraging AI tools gain competitive advantages in content volume and personalization. AI-driven adaptive difficulty and personalized in-game content are improving player retention and monetization conversion rates, with early adopters reporting measurable improvements in average session length and in-game spend per active user.
3. Esports and Creator Economy Driving Organic User Acquisition at Scale
Professional esports leagues and content creators on streaming platforms generate billions of viewing hours annually, creating powerful organic marketing channels that significantly reduce paid user acquisition costs. Games with thriving creator ecosystems sustain player engagement longer and exhibit superior monetization metrics. Brand integration within esports broadcasts represents a rapidly growing in-game advertising segment, with revenues growing at above-market rates across the U.S. gaming market segments.
4. Cross-Platform Play and Unified Gaming Identities
Demand for seamless gameplay across console, PC, and mobile is driving cross-platform integration as a competitive requirement for major live-service titles. Unified player identities and shared progression systems enhance retention by allowing players to maintain investment across devices. Cross-platform architecture also expands the competitive pool for multiplayer titles, improving match quality and reducing queue times, which are primary drivers of long-term engagement and recurring in-game purchase frequency.
Industry Value Chain Analysis
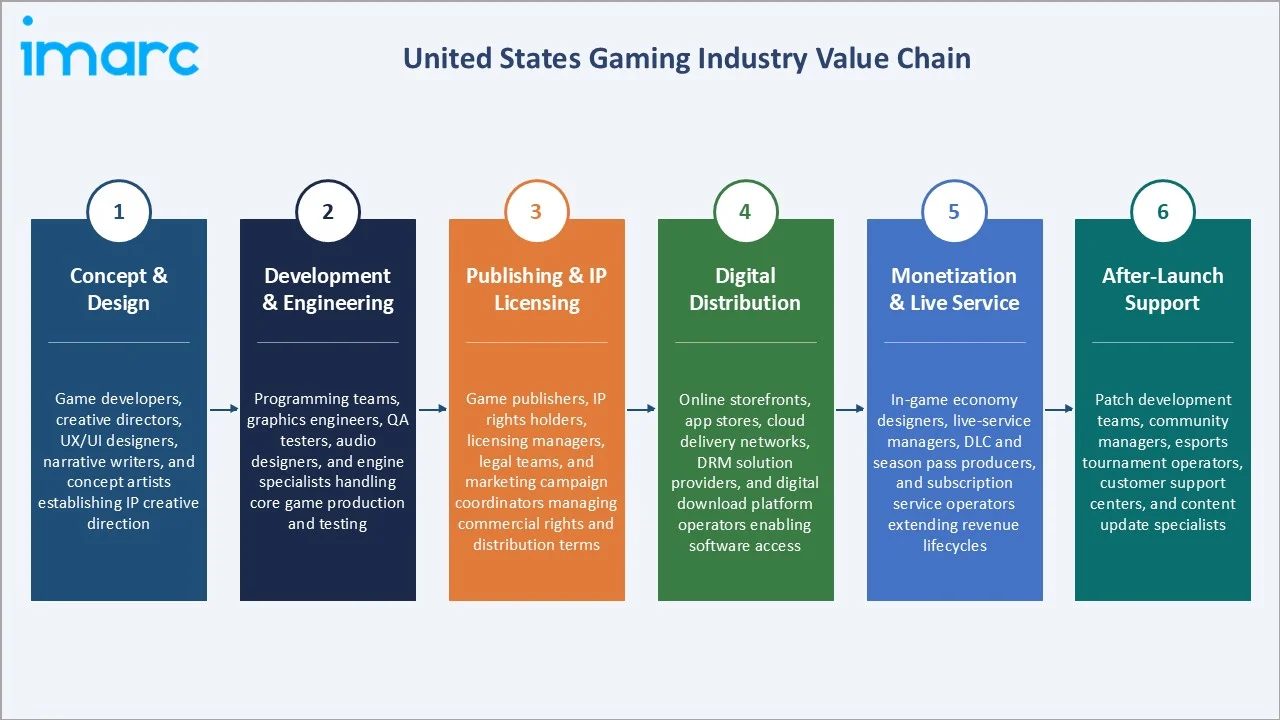
The United States gaming value chain spans concept ideation, high-cost engineering development, publisher-led IP management, digital distribution through major storefronts, live-service monetization, and ongoing post-launch support. Each stage adds distinct commercial value and involves specialized participants competing on quality, speed, and technology.
|
Stage |
Key Participants |
|
Concept & Design |
Game developers, creative directors, UX/UI designers, narrative writers, and concept artists establishing IP creative direction |
|
Development & Engineering |
Programming teams, graphics engineers, QA testers, audio designers, and engine specialists handling core game production and testing |
|
Publishing & IP Licensing |
Game publishers, IP rights holders, licensing managers, legal teams, and marketing campaign coordinators managing commercial rights and distribution terms |
|
Digital Distribution |
Online storefronts, app stores, cloud delivery networks, DRM solution providers, and digital download platform operators enabling software access |
|
Monetization & Live Service |
In-game economy designers, live-service managers, DLC and season pass producers, and subscription service operators extending revenue lifecycles |
|
After-Launch Support |
Patch development teams, community managers, esports tournament operators, customer support centers, and content update specialists |
Digital distribution is the United States gaming value chain's most commercially consequential stage, with platform operators capturing 20–30% revenue share from all software transactions.
Technology Landscape in the United States Gaming Industry
Game Engine and Real-Time Rendering Technologies
Advanced game engines power the majority of commercial game development in the United States, enabling photorealistic real-time rendering across console, PC, and mobile platforms. These engines reduce custom development overhead and provide cross-platform export capabilities, significantly accelerating time-to-market for studios of all sizes and budget ranges.
Cloud Gaming and Streaming Infrastructure
Cloud gaming infrastructure streams high-fidelity titles to low-cost endpoint devices, removing the hardware investment barrier for a growing segment of consumers. Rapid 5G network expansion is reducing latency constraints, making cloud gaming viable for competitive multiplayer titles. Improved streaming infrastructure also enables higher-quality mobile gaming experiences that support premium in-game purchase monetization on mobile devices.
Artificial Intelligence and Procedural Content Generation
AI-driven procedural generation tools are transforming content production pipelines, reducing manual asset creation costs while increasing game replayability and content depth. Dynamic NPC behaviour, adaptive difficulty systems, and AI-generated environments deliver more engaging experiences. Publishers investing in AI tooling early are achieving meaningful cost and quality advantages that are beginning to reflect in improved player retention and in-game spend metrics.
Market Segmentation Analysis
The report covers the following segments:
|
Segment Category |
Leading Segment |
Market Share |
Year |
| Device Type | 🔒 | 🔒 | 2025 |
| Platform | Online | 76.4% | 2025 |
| Revenue Type | In-Game Purchase | 46.8% | 2025 |
| Type | 🔒 | 🔒 | 2025 |
| Age Group | 🔒 | 🔒 | 2025 |
| Region | South | 34.6% | 2025 |

By Revenue Type
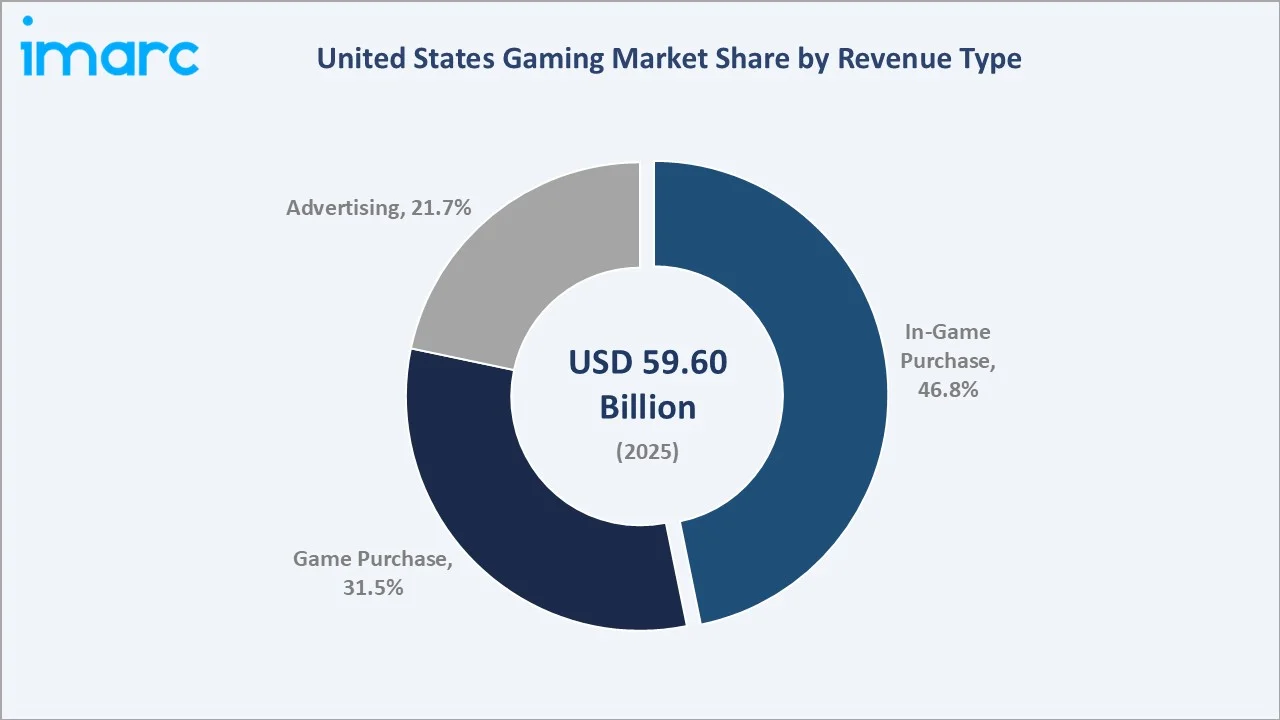
In-Game Purchase leads at 46.8% (2025). This segment encompasses microtransactions, battle passes, virtual cosmetics, and downloadable content across free-to-play and premium titles. It represents the most commercially scalable revenue model, generating recurring income from engaged player communities with high conversion rates across mobile and console platforms.
To access detailed market analysis, Request Sample
Game Purchase at 31.5% reflects sustained demand for premium title releases, particularly AAA console and PC games with high production value. Advertising at 21.7% is growing rapidly as in-game programmatic advertising and brand integrations expand, driven by mobile gaming's massive and highly diversified audience reach across demographic segments.
By Platform
Online leads at 76.4% (2025). Digital distribution, cloud gaming, and online multiplayer have structurally shifted gaming to connected platforms. Console digital stores and PC gaming platforms account for the bulk of transaction volume, supported by rapidly growing subscription services that are converting one-time buyers into recurring revenue contributors.
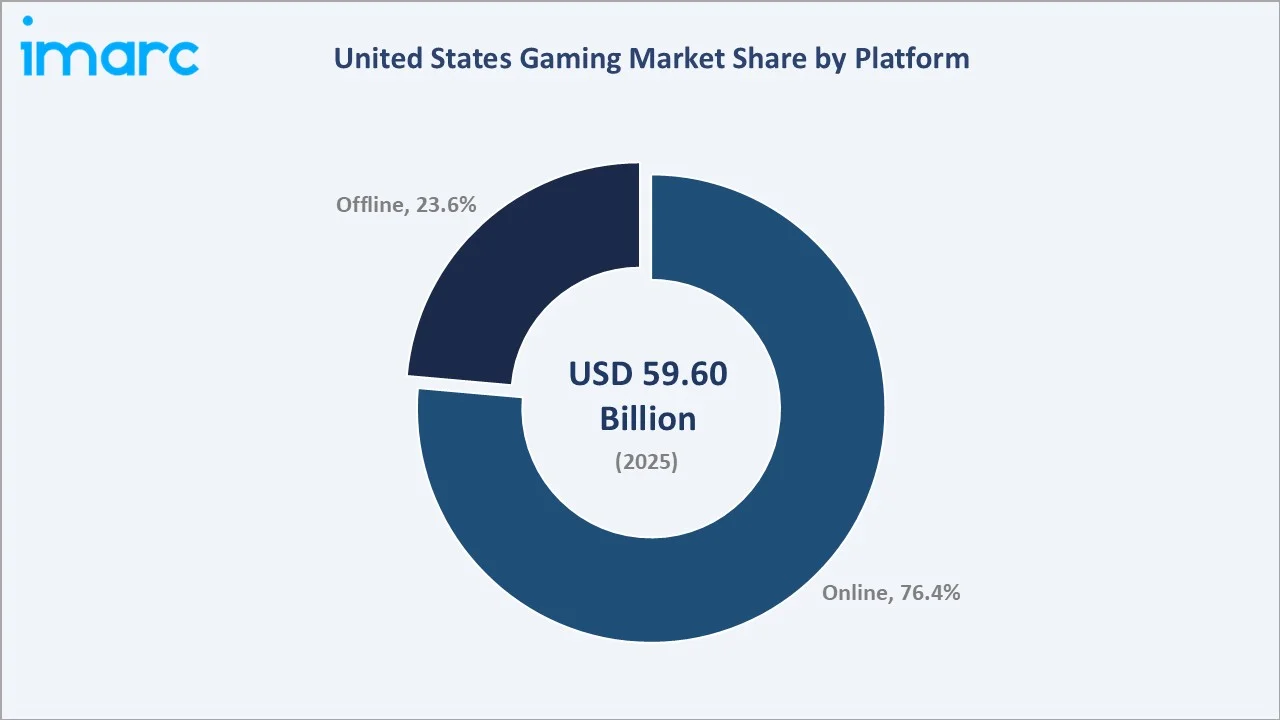
Offline at 23.6% remains relevant through physical retail and local-play console gaming, particularly in sports and party game categories. However, the offline segment is declining structurally as digital distribution and cloud connectivity increasingly replace physical media purchase and local-only gameplay across core gaming demographics.
Regional Market Insights
|
Region |
Share (2025) |
Key Drivers & Characteristics |
|
South |
34.6% |
Large youthful consumer base, high smartphone penetration, and strong mobile and online gaming adoption across major metropolitan areas. |
|
West |
28.7% |
Proximity to major gaming studios, high-income tech-sector households, and robust broadband infrastructure supporting premium gaming spend. |
|
Midwest |
21.4% |
Emerging esports infrastructure, rising broadband penetration in suburban areas, and growing gaming communities in mid-sized urban centres. |
|
Northeast |
15.3% |
Dense urban markets with above-average household incomes supporting premium console and PC gaming spend across concentrated metropolitan populations. |
South's 34.6% market leadership reflects its large and youthful consumer base, above-average mobile gaming penetration, and rapidly expanding broadband infrastructure. West at 28.7% benefits from proximity to major game studios and high-income tech-sector households driving premium gaming spend across console, PC, and mobile platforms.
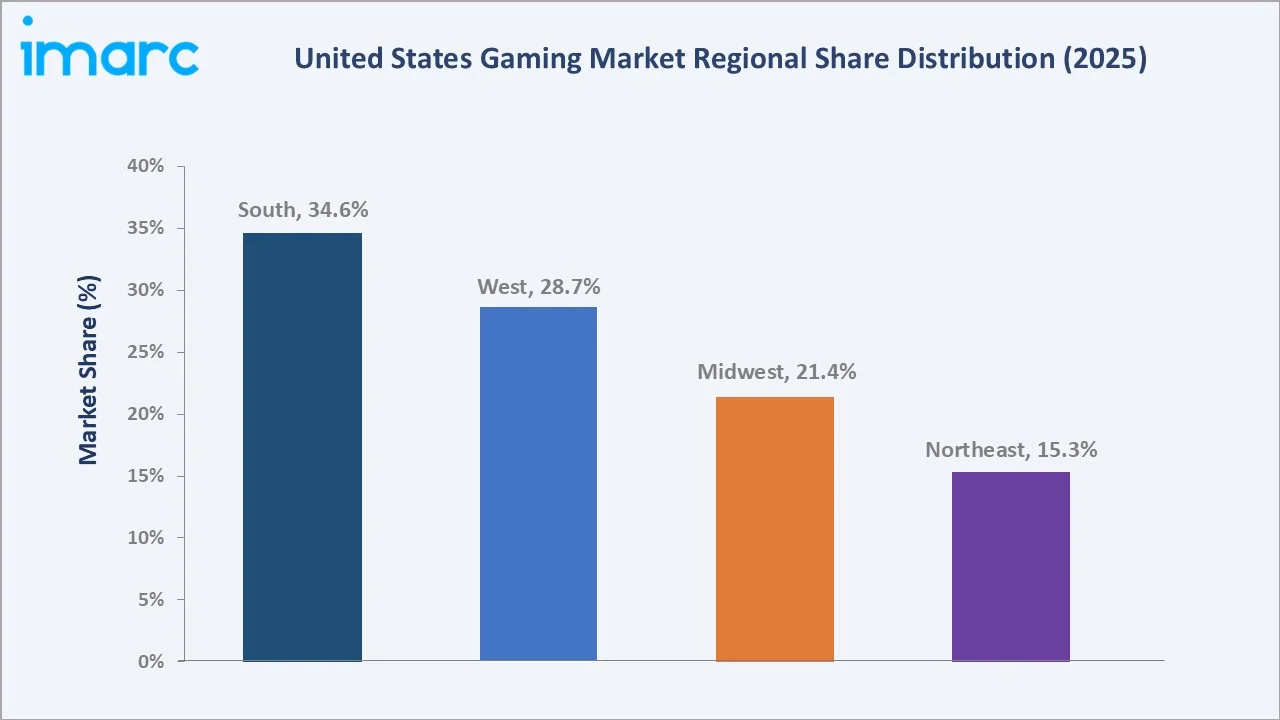
Midwest at 21.4% is supported by emerging esports infrastructure and improving broadband access in suburban and rural areas. Northeast at 15.3% is the smallest but highest per-capita spending region, with dense urban markets supporting premium console, PC, and mobile gaming spend, anchored by New York City and Boston metro areas with well-established gaming communities.
Competitive Landscape
The United States gaming market competitive landscape is highly consolidated at the premium segment, with major publishers commanding significant IP-driven revenue shares. This US gaming industry analysis reveals that competition is intensifying through cloud gaming platforms, subscription services, and mobile-first challengers disrupting traditional console distribution.
|
Company |
Key Brands |
Market Position |
Core Strength |
| Electronic Arts Inc. | FC 27, NHL 27, MADDEN 27, My Sims, Battlefield REDSEC, Split Fiction | Strong Challenger | Deep sports simulation IP portfolio and expanding live-service model across consoles |
| Take-Two Interactive Software, Inc. | GTA, Red Dead Redemption, NBA 2K, Civilization | Market Leader | Rockstar Games' premium open-world IP commands industry-leading lifetime revenue benchmarks |
| Epic Games, Inc. | Fortnite, Rocket League, Fall Guys, Unreal Engine | Innovator | Cross-platform engine licensing, proprietary storefront, and free-to-play live-service leadership |
| Sony Group Corporation | God of War, Spider-Man, Horizon | Market Leader | Premium first-party exclusive portfolio and leading global console platform installed base |
Key players include Electronic Arts Inc., Take-Two Interactive Software, Inc., Epic Games, Inc., Sony Group Corporation, and others.
Key Company Profiles
Electronic Arts Inc.
Electronic Arts Inc. is a leading global interactive entertainment software company, recognized for its sports simulation franchises and live-service gaming portfolio. EA generates sustained recurring revenues from a vast and loyal international player base through annual sports releases and long-running online gaming communities.
- Key Brands: FC 27, NHL 27, MADDEN 27, My Sims, Battlefield REDSEC, Split Fiction
- Recent Developments: In July 2025, Electronic Arts Inc. launched EA Sports FC 26 with enhanced AI-driven player behaviour simulation and expanded Ultimate Team monetization features, reporting record in-game purchase revenues in the title's first quarter of availability on console and PC platforms.
- Strategic Focus: Deepening live-service monetization across its sports portfolio while diversifying through Apex Legends' free-to-play model and continued investment in PC and console cross-platform capabilities. EA's strategic priority is sustaining competitive positioning against rival publishers through annual franchise refresh cycles and continuous Ultimate Team content updates. Expanding its mobile sports gaming presence represents a secondary growth vector targeting new demographics underserved by console-centric sports title formats.
Take-Two Interactive Software, Inc.
Take-Two Interactive Software, Inc. is a leading developer, publisher, and marketer of interactive entertainment, operating through its Rockstar Games and 2K labels to deliver premium open-world titles with industry-leading production values and extended commercial tails.
- Key Brands: GTA, Red Dead Redemption, NBA 2K, Civilization
- Recent Developments: In June 2026, Take-Two Interactive Software, Inc. confirmed the global release window for Grand Theft Auto VI, generating record pre-release consumer engagement metrics. The title is expected to set new commercial benchmarks for open-world game revenues across console and PC platforms, representing the most anticipated game launch in industry history.
- Strategic Focus: Maximizing GTA Online and NBA 2K annual release revenues while investing in its next generation of premium open-world IP under Rockstar Games. Mobile expansion through its Zynga acquisition diversifies revenue streams beyond console and PC, targeting the high-growth mobile casual gaming demographic. The company's long-term strategic focus is on establishing a portfolio of evergreen live-service titles capable of sustaining in-game purchase revenues across multi-year commercial cycles with minimal incremental content investment per player.
Market Concentration Analysis
The United States gaming market is highly concentrated among a small number of platform operators and publishers at the premium segment. The top five publishers account for an estimated 55–65% of total market revenue by value.
Market concentration is evolving through two opposing forces: platform consolidation through major acquisitions is increasing concentration among the largest operators, while mobile and cloud gaming segments are structurally democratizing publisher access. This enables mid-tier studios to reach global audiences without traditional platform gatekeeping, gradually creating a more competitive mid-market independent gaming segment.
Investment & Growth Opportunities
Highest Growth Segments
In-game purchase monetization (~7.50% CAGR), offline platform (~5.30% CAGR), game purchase (~5.80% CAGR), and online platform (~7.20% CAGR) represent the highest-growth investment vectors in the United States gaming market through 2034.
Emerging Investment Opportunities
AI-driven personalization in live-service titles represents the most commercially novel opportunity, enabling publishers to tailor in-game experiences and monetization prompts at individual player level. Early AI personalization adopters report measurable improvements in average revenue per user and player retention rates across their active title portfolios.
Investment Themes
- Gaming Subscription Platforms: Bundling extensive game libraries with cloud streaming capabilities creates defensible recurring revenue and reduces consumer reliance on individual title purchases, providing more predictable cash flows for platform operators and content partners over extended subscription lifecycle periods.
- Mobile Monetization Infrastructure: Investing in in-game advertising networks and mobile-specific in-app purchase platforms captures the United States' largest gaming audience segment, which continues to grow above the overall market CAGR with improving average spend metrics across demographic cohorts.
Future Market Outlook (2026-2034)
The United States gaming market is projected to grow from USD 59.60 Billion in 2025 to USD 63.56 Billion in 2026, reaching USD 108.11 Billion by 2034 at a CAGR of 6.63% during 2026-2034. The market's anchor value of USD 82.18 Billion in 2030 reflects a structural mid-decade inflection driven by cloud gaming maturation and subscription service scaling.
Three structural forces define market growth through 2034: cloud gaming's elimination of hardware barriers expanding the addressable market; generative AI reducing development costs while increasing content volume; and subscription services converting one-time purchasers into recurring revenue contributors, structurally improving publisher revenue predictability and reducing dependence on individual blockbuster title launch cycles for annual results.
Research Methodology
Primary Research
Primary research comprised structured interviews with United States gaming industry stakeholders, including Chief Revenue Officers, Platform Directors, Brand Managers, digital distribution heads, esports tournament operators, and consumer survey respondents from all four census regions and major demographic cohorts including mobile, console, PC, and cloud gaming segments.
Secondary Research
Secondary research encompassed company annual reports, SEC filings, platform developer disclosures, ESA annual gaming reports, industry analyst publications, investor presentations, and press releases from major publishers and platform operators. Over 60 secondary sources were reviewed to validate market size and segment share estimates.
Forecasting Models
Market revenue forecasts were developed using a platform-monetization model: active user base by platform multiplied by average revenue per user per monetization type, aggregated across revenue categories. Advertising revenue was modeled separately using CPM and impression-volume projections per platform, with segment-specific CAGRs applied to each component to produce the consolidated market forecast.
United States Gaming Market Report:
| Report Features | Details |
|---|---|
| Base Year of the Analysis | 2025 |
| Historical Period | 2020-2025 |
| Forecast Period | 2026-2034 |
| Units | Billion USD |
| Scope of the Report |
Exploration of Historical Trends and Market Outlook, Industry Catalysts and Challenges, Segment-Wise Historical and Future Market Assessment:
|
| Device Types Covered | Consoles, Mobiles and Tablets, Computer |
| Platforms Covered | Online, Offline |
| Revenue Types Covered | In-Game Purchase, Game Purchase, Advertising |
| Types Covered | Adventure/Role Playing Games, Puzzles, Social Games, Strategy, Simulation, Others |
| Age Groups Covered | Adult, Children |
| Regions Covered | Northeast, Midwest, South, West |
| Companies Covered | Electronic Arts Inc., Take-Two Interactive Software, Inc., Epic Games, Inc., Sony Group Corporation, etc. |
| Customization Scope | 10% Free Customization |
| Post-Sale Analyst Support | 10-12 Weeks |
| Delivery Format | PDF and Excel through Email (We can also provide the editable version of the report in PPT/Word format on special request) |
Key Benefits for Stakeholders:
- IMARC’s report offers a comprehensive quantitative analysis of various market segments, historical and current market trends, market forecasts, and dynamics of the United States gaming market from 2020-2034.
- The research study provides the latest information on the market drivers, challenges, and opportunities in the United States gaming market.
- Porter's five forces analysis assist stakeholders in assessing the impact of new entrants, competitive rivalry, supplier power, buyer power, and the threat of substitution. It helps stakeholders to analyze the level of competition within the United States gaming industry and its attractiveness.
- Competitive landscape allows stakeholders to understand their competitive environment and provides an insight into the current positions of key players in the market.
Frequently Asked Questions About the US Gaming Market Report
The United States gaming market size is estimated at USD 59.60 Billion in 2025, driven by in-game purchases, cloud gaming adoption, and mobile gaming penetration. Rising esports engagement and digital distribution expansion further support market growth across all age and income demographics.
The United States gaming market grows at a CAGR of 6.63% during 2026-2034, reaching USD 108.11 Billion by 2034. Growth is sustained by subscription services, in-game monetization, mobile expansion, and cloud gaming infrastructure investment across the full forecast period.
In-Game Purchase leads at 46.8% through microtransactions, battle passes, and virtual cosmetics embedded in free-to-play and live-service titles, generating high-margin recurring revenues for publishers across all major gaming platforms.
Online leads at 76.4% through digital distribution storefronts, cloud gaming services, and online multiplayer ecosystems. The platform's dominance reflects the structural shift away from physical retail toward connected gaming experiences across all device categories.
South leads at 34.6% through a large and youthful consumer base, high smartphone penetration, and expanding broadband infrastructure across Texas, Florida, and Georgia supporting mobile and online gaming adoption well above the national average.
Leading companies include Electronic Arts Inc., Take-Two Interactive Software, Inc., Epic Games, Inc., Sony Group Corporation, and others.
The United States gaming market is projected to reach approximately USD 82.18 Billion by 2030, with cloud gaming and subscription services driving above-overall-market growth as they capture a larger share of total gaming revenue across console, PC, and mobile segments.
Need more help?
- Speak to our experienced analysts for insights on the current market scenarios.
- Include additional segments and countries to customize the report as per your requirement.
- Gain an unparalleled competitive advantage in your domain by understanding how to utilize the report and positively impacting your operations and revenue.
- For further assistance, please connect with our analysts.
 Request Customization
 Speak to an Analyst
 Request Brochure
 Inquire Before Buying
Benefits of Customization
- Personalize this research
- Triangulate with your data
- Get data as per your format and definition
- Gain a deeper dive into a specific application, geography, customer, or competitor
- Any level of personalization
Get in Touch With Us
UNITED STATES
Phone: +1-201-971-6302
INDIA
Phone: +91-120-433-0800
UNITED KINGDOM
Phone: +44-753-714-6104
Email: [email protected]
Client Testimonials























Related Reports

Choose your plan
*Please note that the prices mentioned below are starting prices for each bundle type. Kindly contact our team for further details.*
Single User License
- 1 User License, Access on 2 Devices
- PDF Report + Excel Dataset (Password Protected)
- Lifetime Access
- No Printing Rights
- 10% Free Report Customization
- 10–12 Weeks of Analyst Support
Five User License
- Access for 5 Users, 2 Devices per User
- PDF Report + Excel Dataset (Password Protected)
- Lifetime Access
- Dedicated Account Manager
- 12–14 Weeks of Analyst Support
- No Printing Rights
- 15% Free Report Customization
- 25% Discount on Your Next Purchase
Corporate User License
- Unlimited User Access (Within Your Organization)
- PDF Report + Excel Dataset
- Lifetime Access
- Dedicated Account Manager
- 14–20 Weeks of Analyst Support
- No Printing Rights
- 20% Free Report Customization
- 30% Discount on Your Next Purchase
Essential Insights
What's included:
3 reports
- Lifetime Access
- PDF Reports
- Excel Datasets
- 2 Weeks of Free Analyst Support
- 2 User Licenses
- Access on 2 Devices
- Printing Rights
- Complimentary PowerPoint (PPT) Version
- Complimentary License Upgrade
Professional Access
What's included:
5 reports
- Lifetime Access
- PDF Reports
- Excel Datasets
- 8 Weeks of Free Analyst Support
- 2 User Licenses
- Access on 2 Devices
- Printing Rights
- Complimentary PowerPoint (PPT) Version
- Complimentary License Upgrade
Business Advantage
What's included:
8 reports
- Lifetime Access
- PDF Reports
- Excel Datasets
- 14 Weeks of Free Analyst Support
- 2 User Licenses
- Access on 2 Devices
- Printing Rights
- Complimentary PowerPoint (PPT) Version
- Complimentary License Upgrade
Enterprise Intelligence
What's included:
10 reports
- Lifetime Access
- PDF Reports
- Excel Datasets
- 20 Weeks of Free Analyst Support
- 2 User Licenses
- Access on 2 Devices
- Printing Rights
- Complimentary PowerPoint (PPT) Version
- Complimentary License Upgrade