
United States Negative Pressure Wound Therapy Market Size, Share, Trends and Forecast by Device, Component, Wound Type, Indication, End Users, and Region, 2026-2034
United States Negative Pressure Wound Therapy Market Size and Share:
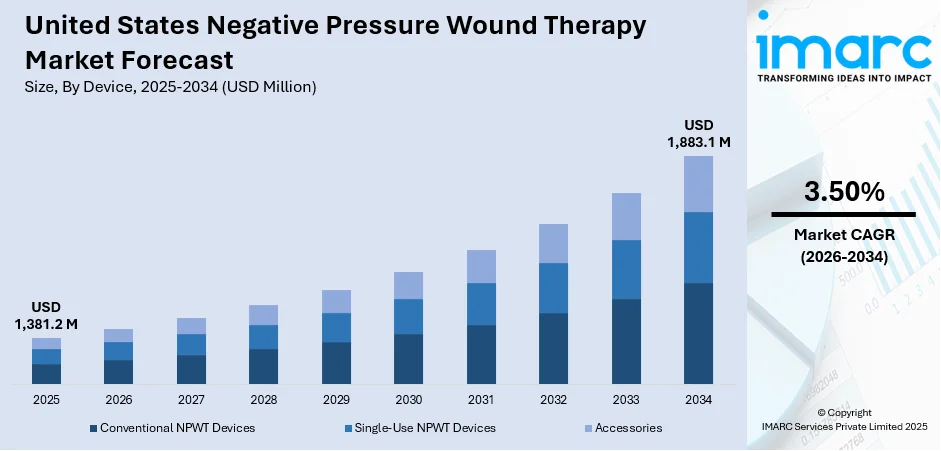
The United States negative pressure wound therapy market size was valued at USD 1,381.2 Million in 2025. Looking forward, IMARC Group estimates the market to reach USD 1,883.1 Million by 2034, exhibiting a CAGR of 3.50% from 2026-2034. The market is driven by the growing prevalence of chronic wounds and post-surgical complications, which require advanced healing solutions. The increasing adoption of minimally invasive treatments and demand for faster recovery are also fueling NPWT usage. Additionally, technological advancements such as portable, user-friendly, and disposable systems are making therapy more accessible across care settings. The shift toward outpatient and home-based care further supports United States negative pressure wound therapy market share, as providers seek cost-effective, efficient wound management solutions.
|
Report Attribute
|
Key Statistics
|
|---|---|
|
Base Year
|
2025
|
|
Forecast Years
|
2026-2034
|
|
Historical Years
|
2020-2025
|
|
Market Size in 2025
|
USD 1,381.2 Million |
|
Market Forecast in 2034
|
USD 1,883.1 Million |
| Market Growth Rate (2026-2034) | 3.50% |
Access the full market insights report Request Sample
The increasing prevalence of chronic and post-surgical wounds is a key driver of the NPWT market in the U.S. Chronic wounds, including those related to diabetes, immobility, and vascular conditions, affect an estimated 2.4 to 6.5 million individuals annually and often require long-term, specialized treatment. NPWT has proven effective in promoting faster healing, reducing infection risk, and managing wound exudate. Additionally, the rise in surgical procedures has created greater demand for advanced wound care solutions during recovery. As healthcare systems emphasize better patient outcomes, shorter hospital stays, and cost-efficiency, NPWT is increasingly adopted across hospitals, outpatient facilities, and home care settings for effective management of complex wounds.
To get more information on this market Request Sample
The evolution of NPWT technology has significantly enhanced market adoption. Modern devices are now smaller, more intuitive, and designed for greater patient comfort, making them suitable for use outside traditional hospital settings. The rise of portable and single-use systems supports wound care in outpatient clinics and at home, aligning with the broader shift toward decentralized healthcare. These advancements simplify treatment, reduce caregiver burden, and improve patient adherence. As a result, healthcare systems are increasingly integrating NPWT into comprehensive wound management strategies, recognizing its role in reducing complications and enhancing recovery across diverse patient populations.
United States Negative Pressure Wound Therapy Market Trends:
Rise of Single-Use and Disposable NPWT Systems
The adoption of single-use and disposable NPWT systems is gaining momentum across the U.S. healthcare landscape. These compact, pre-packaged devices are designed for ease of use, particularly in outpatient and home care settings. They eliminate the need for device reprocessing, which reduces contamination risks and saves time for healthcare professionals. The convenience and portability of these systems make them ideal for short-term therapy, especially after surgical procedures or minor injuries. Healthcare providers value their efficiency and reduced administrative burden, while patients appreciate the discreet design and simplified usage. This trend reflects a broader move toward cost-effective, patient-centered care models that prioritize flexibility, infection control, and mobility. As healthcare continues to shift beyond the hospital setting, disposable NPWT systems are becoming a preferred solution for efficient wound care delivery in both clinical and non-clinical environments.
Integration of Digital Technologies and Remote Monitoring
Digital transformation is reshaping NPWT by integrating smart technologies into wound care devices, enhancing both clinical efficiency and patient experience. Modern NPWT systems now feature wireless connectivity, pressure sensors, and intuitive digital interfaces, enabling clinicians to remotely monitor treatment and respond swiftly to complications. This real-time oversight allows for more personalized care and supports patient adherence, particularly in home care settings. Notably, among 1,105 outpatients, those using NPWT with remote therapy monitoring (RTM) experienced a significant drop in 90-day wound care costs—from $14,752 to $11,119—despite higher device costs, owing to reduced non-device expenses. These innovations bridge the gap between hospital supervision and at-home independence, aligning with the growing shift toward telehealth and connected care. As a result, digital NPWT systems are becoming essential tools in data-driven wound management, offering improved outcomes, cost savings, and a more responsive, patient-centered care experience.
Growth of Home-Based and Outpatient NPWT Use
The expansion of NPWT into home-based and outpatient care is a significant United States negative pressure wound therapy market trend. As healthcare shifts away from inpatient settings, there’s growing demand for wound care solutions that can be safely and effectively managed outside the hospital. Advances in portable NPWT devices have made this transition possible, allowing patients to receive consistent therapy in more comfortable and convenient environments. Home use promotes quicker recovery, reduces the risk of hospital-acquired infections, and supports continuity of care post-discharge. Healthcare providers and payers are also embracing this shift due to its potential for cost savings and improved resource allocation. With proper support and remote monitoring capabilities, patients can manage their wound care with minimal disruption to daily life. This trend reflects a broader commitment to personalized, flexible care that meets patients where they are physically and medically.
United States Negative Pressure Wound Therapy Industry Segmentation:
IMARC Group provides an analysis of the key trends in each segment of the United States negative pressure wound therapy market, along with forecast at the regional, and country levels from 2026-2034. The market has been categorized based on device, component, wound type, indication, and end user.
Analysis by Device:
- Conventional NPWT Devices
- Single-Use NPWT Devices
- Accessories
Based on the United States negative pressure wound therapy market forecast, the conventional NPWT devices account for the majority market share of 85.3% due to their established presence, proven clinical efficacy, and widespread use in hospitals and surgical settings. These systems are highly effective for treating complex, deep, or heavily exudating wounds, making them the standard of care in acute and inpatient environments. Their ability to deliver continuous or intermittent negative pressure, along with customizable settings, allows for precise wound management. Healthcare providers trust conventional devices for critical wound cases, supported by strong clinical data and institutional familiarity. Additionally, their integration into hospital protocols and reimbursement structures contributes to sustained demand. While portable and single-use options are growing, conventional NPWT remains dominant due to its versatility, performance reliability, and suitability for complex wound care.
Analysis by Component:
- Canisters and Dressings
- Pumps
Canisters and dressings hold the largest market share in the U.S. Negative Pressure Wound Therapy (NPWT) market due to their essential role in the overall therapy system. Dressings form the direct interface with the wound, helping maintain a sealed environment, absorb exudate, and promote healing, while canisters safely collect and store wound fluids. The frequent need for replacement during treatment makes these components highly consumable, driving consistent demand. Innovations in dressing materials—such as antimicrobial, foam, or hydrocolloid types—have further improved patient outcomes and comfort. Additionally, compatibility with both traditional and portable NPWT devices boosts their usage across hospital, outpatient, and home settings. As NPWT adoption expands, the ongoing requirement for high-quality, effective disposables secures the leading market position for canisters and dressings.
Analysis by Wound Type:
- Chronic Wounds
- Acute Wounds
According to the United States negative pressure wound therapy market analysis the chronic wounds dominate due to their prolonged healing time and complexity, which require advanced and consistent wound care solutions. Conditions such as diabetic foot ulcers, pressure ulcers, and venous leg ulcers are increasingly common, particularly among aging populations and individuals with diabetes or mobility issues. NPWT is especially effective for chronic wounds as it promotes granulation, reduces infection risk, and manages excess wound fluid, all essential for long-term healing. The shift toward outpatient and home care further supports NPWT use in chronic cases, offering patients continuity of care outside the hospital. As the burden of chronic diseases rises, the need for efficient, cost-effective wound healing solutions continues to push demand for NPWT in this segment.
Analysis by Indication:
- Surgical and Traumatic Wounds
- Pressure Ulcers
- Venous Ulcers
- Diabetic Foot Ulcer
- Burns
- Others
Ulcers represent the majority share in the U.S. negative pressure wound therapy (NPWT) market due to their chronic nature and difficulty in healing through conventional methods. Pressure ulcers, diabetic foot ulcers, and venous leg ulcers are common, especially among the elderly and individuals with limited mobility or chronic conditions. NPWT is highly effective in promoting wound healing by enhancing blood flow, removing exudate, and reducing bacterial load—factors critical in ulcer management. Its ability to accelerate tissue regeneration and reduce complications makes it a preferred treatment for long-standing wounds. The rising incidence of diabetes, obesity, and aging-related conditions continues to drive demand for NPWT in ulcer care, establishing this segment as the leading application in the United States negative pressure wound therapy market outlook.
Analysis by End User:
To get detailed segment analysis of this market Request Sample
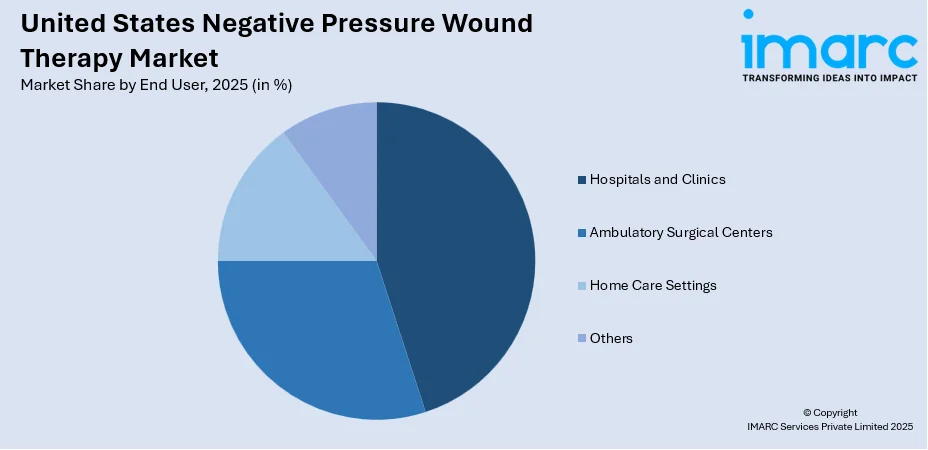
- Hospitals and Clinics
- Ambulatory Surgical Centers
- Home Care Settings
- Others
Hospitals and clinics dominate the U.S. negative pressure wound therapy (NPWT) market with a 40.0% share, primarily due to their role in managing complex and acute wounds. These healthcare settings are the first point of treatment for surgical incisions, traumatic injuries, and severe chronic wounds, where NPWT is often initiated. The availability of skilled professionals, advanced equipment, and comprehensive post-operative care makes hospitals and clinics ideal for administering NPWT. Additionally, inpatient environments allow close monitoring and timely adjustments to therapy. As the standard of care for wound management in surgical and emergency departments, NPWT systems are widely adopted in these settings. The growing number of surgeries and the need for effective infection control further reinforce hospitals' leadership in the NPWT market.
Regional Analysis:
- Northeast
- Midwest
- South
- West
The Northeast region sees strong NPWT demand due to its dense urban population and advanced healthcare infrastructure. Large hospital networks and academic medical centers drive adoption, especially for post-surgical and chronic wound care. The region’s focus on cutting-edge medical technology supports early adoption of portable and disposable NPWT systems.
Additionally, in the Midwest, NPWT market growth is supported by a mix of urban hospitals and expansive rural care networks. Chronic wound cases related to diabetes and aging populations are common. Telehealth and portable NPWT systems are increasingly used to serve remote areas, enhancing accessibility and continuity of care.
Moreover, the South leads in NPWT demand due to high rates of obesity, diabetes, and surgical procedures. The region has a large aging population, contributing to chronic wound prevalence. Expanding outpatient care and home health services drive the use of cost-effective NPWT solutions, especially single-use and portable devices.
Besides this, the Western U.S. benefits from a strong tech presence and innovative healthcare delivery models, making it a hub for digital NPWT adoption. Urban centers support rapid deployment of advanced therapies, while rural areas rely on portable NPWT for remote care. Sustainability and ease-of-use also influence product preference in this region.
Competitive Landscape:
The competitive landscape is characterized by strong rivalry, ongoing innovation, and a focus on expanding access across care settings. Established players dominate the market with proprietary technologies, but newer entrants and specialized providers are gaining traction through differentiated offerings. The competition centers on product effectiveness, ease of use, portability, and integration with digital health tools. Companies strive to enhance their portfolios with compact, disposable systems and smart monitoring features to meet evolving patient and provider needs. Partnerships with healthcare facilities, distributors, and homecare providers are key strategies for market expansion. Regulatory approvals and reimbursement pathways also play a significant role in shaping market dynamics. Overall, the landscape is marked by strategic investments in R&D, a shift toward outpatient and home-based care, and efforts to deliver cost-effective, high-quality wound management solutions across a broad patient population.
The report provides a comprehensive analysis of the competitive landscape in the United States negative pressure wound therapy market with detailed profiles of all major companies.
Latest News and Developments:
- May 2025: Smith+Nephew awarded a 10-year, USD 75 Million contract by the U.S. Department of Defense to provide RENASYS TOUCH Negative Pressure Wound Therapy systems. These systems will support military medical providers with personalized wound care during prolonged casualty care and transport, enhancing military healthcare.
- October 2024: Venture Medical was announced as the exclusive U.S. distributor for Vendaje AC, a placental-derived wound care product from BioStem Technologies. This partnership offers advanced solutions for non-healing wounds, providing Medicare reimbursement and expanding access to innovative treatments nationwide, backed by clinical studies and evidence.
- September 2024: Solventum launched the V.A.C. Peel and Place Dressing, an innovative all-in-one solution for Negative Pressure Wound Therapy. This dressing simplifies application, reduces time and training, and improves patient comfort. It also lowers costs by reducing dressing changes and home nursing visits, benefiting both hospitals and patients.
- August 2024: Irrimax Corporation launched two new IRRISEPT kits, the Accessory Kit and Wound Solution Kit, expanding its antimicrobial wound lavage product line. These kits enable flexible use with powered irrigation systems, addressing customer needs and continuing the company’s innovation pipeline to improve patient outcomes and reduce healthcare costs.
- August 2024: Pensar Medical partnered with Centurion Therapeutics to distribute the Microdoc® sNPWT system, a cost-effective wound therapy platform. This collaboration aims to expand access to advanced wound care, targeting a USD 400 Million market, with over 500 sales professionals across 600 care sites to improve patient outcomes.
United States Negative Pressure Wound Therapy Market Report Scope:
| Report Features | Details |
|---|---|
| Base Year of the Analysis | 2025 |
| Historical Period | 2020-2025 |
| Forecast Period | 2026-2034 |
| Units | Million USD |
| Scope of the Report |
Exploration of Historical Trends and Market Outlook, Industry Catalysts and Challenges, Segment-Wise Historical and Future Market Assessment:
|
| Devices Covered | Conventional NPWT Devices, Single-Use NPWT Devices, Accessories |
| Components Covered | Canisters and Dressings, Pumps |
| Wound Types Covered | Chronic Wounds, Acute Wounds |
| Indications Covered | Surgical and Traumatic Wounds, Pressure Ulcers, Venous Ulcers, Diabetic Foot Ulcer, Burns, Others |
| End Users Covered | Hospitals and Clinics, Ambulatory Surgical Centers, Home Care Settings, Others |
| Region Covered | Northeast, Midwest, South, West |
| Customization Scope | 10% Free Customization |
| Post-Sale Analyst Support | 10-12 Weeks |
| Delivery Format | PDF and Excel through Email (We can also provide the editable version of the report in PPT/Word format on special request) |
Key Benefits for Stakeholders:
- IMARC’s report offers a comprehensive quantitative analysis of various market segments, historical and current market trends, market forecasts, and dynamics of the United States negative pressure wound therapy market from 2020-2034.
- The research study provides the latest information on the market drivers, challenges, and opportunities in the United States negative pressure wound therapy market.
- The study maps the leading, as well as the fastest-growing, regional markets. It further enables stakeholders to identify the key country-level markets within each region.
- Porter's Five Forces analysis assists stakeholders in assessing the impact of new entrants, competitive rivalry, supplier power, buyer power, and the threat of substitution. It helps stakeholders to analyze the level of competition within the United States negative pressure wound therapy industry and its attractiveness.
- Competitive landscape allows stakeholders to understand their competitive environment and provides an insight into the current positions of key players in the market.
Frequently Asked Questions About the United States Negative Pressure Wound Therapy Market Report
The United States negative pressure wound therapy market was valued at USD 1,381.2 Million in 2025.
The United States negative pressure wound therapy market is projected to exhibit a CAGR of 3.50% during 2026-2034, reaching a value of USD 1,883.1 Million by 2034.
Key factors driving the U.S. Negative Pressure Wound Therapy market include rising cases of chronic and surgical wounds, demand for faster healing, and the shift toward home-based care. Technological advancements in portable and disposable devices also support wider adoption, improving treatment efficiency and patient convenience across various care settings.
Need more help?
- Speak to our experienced analysts for insights on the current market scenarios.
- Include additional segments and countries to customize the report as per your requirement.
- Gain an unparalleled competitive advantage in your domain by understanding how to utilize the report and positively impacting your operations and revenue.
- For further assistance, please connect with our analysts.
 Request Customization
 Speak to an Analyst
 Request Brochure
 Inquire Before Buying
Benefits of Customization
- Personalize this research
- Triangulate with your data
- Get data as per your format and definition
- Gain a deeper dive into a specific application, geography, customer, or competitor
- Any level of personalization
Get in Touch With Us
UNITED STATES
Phone: +1-201-971-6302
INDIA
Phone: +91-120-433-0800
UNITED KINGDOM
Phone: +44-753-714-6104
Email: [email protected]
Client Testimonials


.webp)


