
United States Pressure Transmitter Market Size, Share, Trends and Forecast by Type, Sensing Technology, Fluid Type, Application, and End Use Industry, 2026-2034
United States Pressure Transmitter Market Summary:
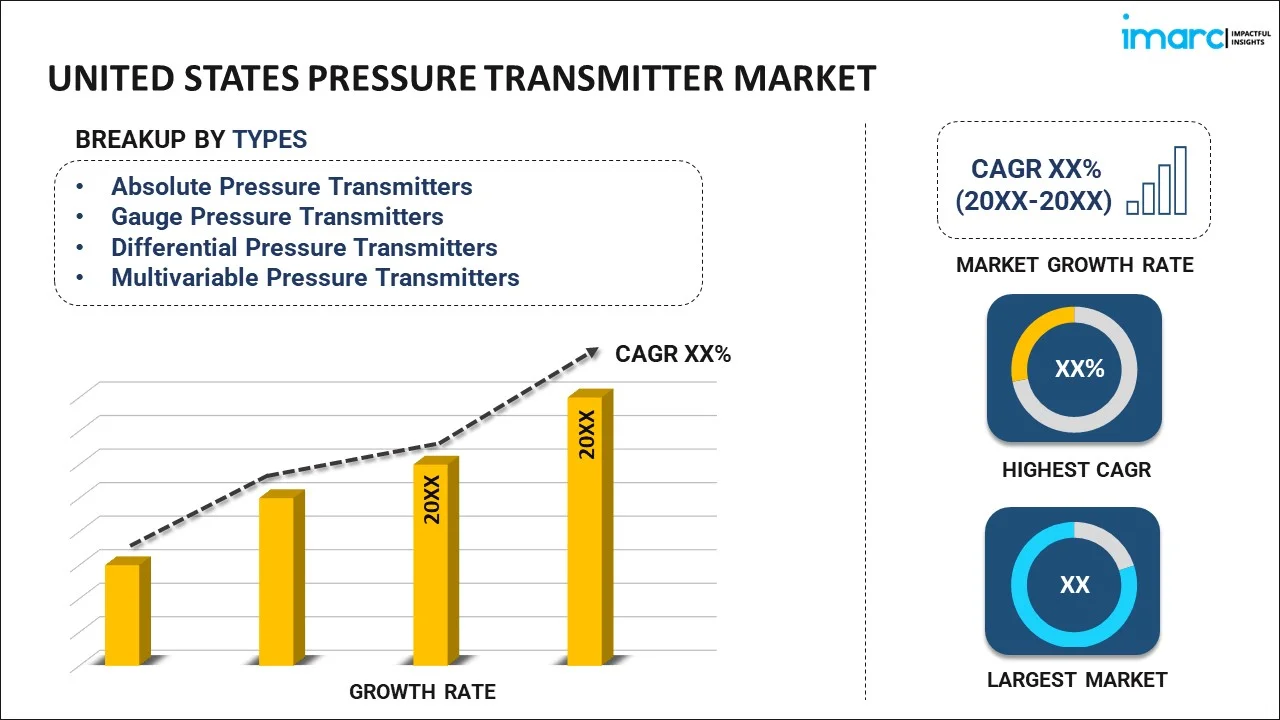
The United States pressure transmitter market size was valued at USD 993.96 Million in 2025 and is projected to reach USD 1,106.62 Million by 2034, growing at a compound annual growth rate of 1.20% from 2026-2034.
The market is propelled by escalating demand from oil and gas operations requiring precise pressure monitoring across upstream, midstream, and downstream applications. The ongoing adoption of Industrial Internet of Things (IioT) technologies and smart manufacturing practices drives investments in intelligent pressure transmitters. Additionally, substantial infrastructure development investments in water treatment, power generation, and energy sectors continue to expand the installed base of pressure monitoring instrumentation across diverse industrial facilities, thereby expanding the United States pressure transmitter market share.
Key Takeaways and Insights:
- By Type: Gauge pressure transmitters dominate the market with a share of 32% in 2025, driven by extensive applications in liquid level measurement and hydrostatic pressure sensing.
- By Sensing Technology: Strain gauge leads with a market share of 38% in 2025, owing to its precision, stability across temperature variations, and durability in harsh industrial environments.
- By Fluid Type: Liquid represents the largest segment with a market share of 40% in 2025, reflecting widespread use in oil and gas drilling operations and petrochemical processing.
- By Application: Pressure holds the largest share of 43% in 2025, performing as the central monitoring parameter throughout multiple process industries.
- By End Use Industry: Oil & gas represent 25% market share in 2025, leveraging pressure transmitters for wellhead monitoring, pipeline operations, and offshore drilling safety.
- Key Players: The competitive landscape features established instrumentation manufacturers alongside specialized automation technology providers, competing through product innovation, technical support capabilities, and integrated solutions offerings tailored to specific industrial requirements.
The United States maintains a sophisticated pressure transmitter market characterized by mature industrial infrastructure and advanced process automation adoption. Industries leverage these precision instruments for critical operations spanning petroleum extraction, chemical manufacturing, power generation, and municipal water systems. The market benefits from stringent regulatory frameworks governing workplace safety, environmental protection, and process reliability that mandate accurate pressure monitoring across hazardous and mission-critical applications. Recent technological advances have introduced wireless communication capabilities, enabling remote diagnostics and predictive analytics for improved operational efficiency. For instance, in 2025, ABB expanded in the US by launching its new P-300 pressure transmitter series. Engineered to provide 0.055% precision throughout an extensive pressure span, from just 0.05 kPa to 105 MPa, the P-300 series serves as a unified solution for diverse applications including precise differential readings and high-pressure assessments.
United States Pressure Transmitter Market Trends:
Integration of Industrial IoT and Wireless Communication Technologies
The United States pressure transmitter market is witnessing rapid adoption of Industrial Internet of Things and wireless communication protocols that eliminate complex wiring requirements while enabling remote monitoring capabilities across distributed industrial operations. These smart transmitters integrate seamlessly with enterprise systems, providing real-time pressure data to centralized control platforms for immediate analysis and response. In November 2024, ABB launched its P-Series pressure transmitter portfolio including the P100, P300, and P500 series at the China International Import Expo, featuring enhanced connectivity and smart operation functionality for industries including oil and gas and hydrogen applications, exemplifying how manufacturers are incorporating advanced digital capabilities into next-generation pressure measurement devices. IMARC Group predicts that the U.S. industrial IoT market is projected to attain USD 568.9 Billion by 2033. This will further driver the need for efficient pressure transmitters in the country.
Emphasis on Energy Efficiency and Sustainability
Regulatory requirements for energy conservation are driving demand for advanced pressure monitoring solutions that help industries minimize energy wastage and improve resource utilization across different processes. Manufacturers are increasingly focused on developing transmitters that not only provide accurate measurements but also contribute to overall system efficiency through optimized process control. In July 2024, the U.S. Department of Energy released a $33 million program to promote AI-enabled smart manufacturing, encouraging businesses to adopt premium pressure transmitters that optimize automation, efficiency, and sustainability objectives, reflecting government support for industrial modernization initiatives that enhance environmental performance while maintaining productivity.
Expansion of Smart Manufacturing and Predictive Maintenance
Manufacturers are increasingly deploying intelligent pressure transmitters with advanced diagnostic capabilities for predictive maintenance programs that identify equipment degradation before failures occur. These devices continuously monitor their own health alongside process parameters, alerting operators to calibration drift, sensor deterioration, or installation issues that could compromise measurement accuracy. Moreover, in 2025, the Biden-Harris Administration, via the U.S. Department of Energy (DOE), revealed almost $13 million in funding from the Bipartisan Infrastructure Law for states, including state-funded universities and technical and community colleges, to guarantee that smart manufacturing technologies and high-performance computing (HPC) resources are available to domestic manufacturing companies. Managed by the DOE’s Office of Manufacturing and Energy Supply Chains (MESC), the State Manufacturing Leadership Program (SMLP) seeks to eliminate current obstacles hindering small- and medium-sized manufacturers (SMMs) from adopting innovative, data-driven tools and technologies. These government policies also encourage smart manufacturing procedures, thereby increasing the need for smart pressure transmitters.
Market Outlook 2026-2034:
The United States pressure transmitter market is positioned for steady expansion driven by ongoing infrastructure modernization, industrial automation advancement, and evolving regulatory requirements across key end-use sectors. The energy sector transition toward cleaner technologies including hydrogen production and renewable power generation creates new application opportunities for specialized pressure measurement instrumentation. The market generated a revenue of USD 993.96 Million in 2025 and is projected to reach a revenue of USD 1,106.62 Million by 2034, growing at a compound annual growth rate of 1.20% from 2026-2034. Apart from this, aging water and wastewater treatment infrastructure necessitates equipment upgrades to meet contemporary environmental standards and operational efficiency targets.
United States Pressure Transmitter Market Report Segmentation:
| Segment Category | Leading Segment | Market Share |
|---|---|---|
| Type | Gauge Pressure Transmitters | 32% |
| Sensing Technology | Strain Gauge | 38% |
| Fluid Type | Liquid | 40% |
| Application | Pressure | 43% |
| End Use Industry | Oil & Gas | 25% |
Type Insights:
To get detailed segment analysis of this market Request Sample
- Absolute Pressure Transmitters
- Gauge Pressure Transmitters
- Differential Pressure Transmitters
- Multivariable Pressure Transmitters
Gauge pressure transmitters dominate with a market share of 32% of the total United States pressure transmitter market in 2025.
Gauge pressure transmitters represent the predominant type segment due to their versatility across diverse industrial applications requiring pressure measurement relative to atmospheric conditions. These transmitters are extensively utilized for liquid level measurement in storage tanks, reservoirs, and process vessels by sensing hydrostatic pressure at tank bottoms, providing reliable inventory monitoring for petroleum products, chemicals, and water systems. The widespread adoption stems from their straightforward installation, robust performance, and compatibility with existing plant infrastructure. In the oil and gas sector, gauge transmitters monitor wellhead pressures, pipeline operating conditions, and tank farm inventory levels, delivering critical data for production optimization and safety management. Their ability to operate reliably in outdoor environments with temperature fluctuations and variable weather conditions makes them particularly suitable for distributed monitoring applications across refineries, chemical plants, and utility facilities.
The technology benefits from mature manufacturing processes that ensure consistent quality and competitive pricing, encouraging broad deployment across industries with varying technical sophistication levels. Water and wastewater treatment facilities employ gauge pressure transmitters throughout pumping stations, distribution networks, and treatment processes to maintain system pressures within operational parameters and detect leaks or blockages. Power generation plants utilize these devices for monitoring feedwater systems, steam generators, and cooling circuits, where accurate pressure control directly impacts efficiency and equipment longevity. The segment continues to evolve with digital communication enhancements and diagnostic features while maintaining the fundamental reliability that industrial users require for continuous process monitoring in both critical safety applications and general operational oversight across manufacturing and infrastructure sectors.
Sensing Technology Insights:
- Strain Gauge
- Capacitive
- Piezoelectric
- Others
Strain gauge leads with a share of 38% of the total United States pressure transmitter market in 2025.
Strain gauge sensing technology maintains its dominant market position through proven performance characteristics including high precision, excellent long-term stability, and reliable operation across wide temperature ranges encountered in industrial environments. The technology operates on the principle of piezoresistive effect where applied pressure causes mechanical deformation of a sensing element, producing proportional changes in electrical resistance that are converted to standardized output signals. This fundamental approach has been refined over decades to achieve accuracy levels meeting stringent requirements for process control, safety instrumentation, and custody transfer applications. Strain gauge transmitters are particularly favored in the oil and gas industry for controlling hydraulic pressure during drilling operations, monitoring flow lines, and managing subsea injection valves where measurement reliability directly impacts operational safety and environmental protection.
Manufacturing advancements in semiconductor fabrication and materials science have enabled miniaturization of strain gauge elements while improving their durability and resistance to harsh media exposure including corrosive chemicals, extreme temperatures, and high vibration environments. These transmitters excel in applications requiring stable zero reference and minimal drift over extended calibration intervals, reducing maintenance costs and operational disruptions. Chemical processing facilities deploy strain gauge transmitters for monitoring reactor pressures, distillation column operations, and material transfer systems where consistent accuracy ensures product quality and prevents equipment damage.
Fluid Type Insights:
- Liquid
- Steam
- Gas
Liquid exhibits a clear dominance with a 40% share of the total United States pressure transmitter market in 2025.
Liquid applications dominate the pressure transmitter market due to the fundamental requirement for level measurement in storage and process vessels across virtually all industrial sectors. Pressure transmitters serving liquid applications utilize hydrostatic pressure principles where the measured pressure directly correlates to liquid column height, providing accurate inventory monitoring for tanks containing petroleum products, chemicals, water, and other fluids. The oil and gas industry represents a primary application area where transmitters monitor crude oil storage tanks, product terminals, and pipeline systems, ensuring inventory accuracy for commercial transactions and preventing overfill conditions. In petrochemical operations, these devices measure pressure in liquefied petroleum gas systems, crude oil fractionation towers, and various process streams handling liquid hydrocarbons, providing essential data for process optimization and safety management throughout complex refining and chemical manufacturing facilities.
Water and wastewater treatment represents another substantial application domain where pressure transmitters monitor levels in clarifiers, storage reservoirs, wet wells, and filter backwash systems, supporting automated control strategies that optimize treatment processes while ensuring compliance with environmental discharge standards. The segment benefits from technological advances in materials engineering that have produced diaphragm seals and wetted components capable of withstanding corrosive liquids, abrasive slurries, and high-temperature process fluids without degradation. Food and beverage manufacturing facilities utilize sanitary design transmitters with hygienic certifications for monitoring ingredient tanks, fermentation vessels, and product storage systems where contamination prevention is critical. Power generation plants employ liquid pressure transmitters throughout cooling water systems, condensate returns, and chemical treatment processes, maintaining precise control over water chemistry and system pressures that directly influence equipment efficiency and longevity.
Application Insights:
- Flow
- Level
- Pressure
Pressure leads with a share of 43% of the total United States pressure transmitter market in 2025.
[Pressure measurement represents the fundamental application driving transmitter adoption across industrial sectors where accurate pressure monitoring ensures process safety, equipment protection, and operational efficiency. Direct pressure measurement applications span gas compression systems, hydraulic circuits, pneumatic controls, and process reactors where maintaining pressures within design parameters prevents equipment failures and safety incidents. Chemical manufacturing facilities utilize pressure transmitters throughout reaction vessels, distillation columns, and material transfer systems where precise pressure control influences product yields, quality specifications, and batch consistency. The oil and gas sector relies extensively on pressure monitoring for well control operations, gathering systems, and processing facilities where pressure variations indicate production changes, equipment malfunctions, or safety-critical conditions requiring immediate operator intervention.
Power generation plants employ pressure transmitters for monitoring steam systems, boiler operations, and turbine control applications where accurate pressure measurement directly impacts generation efficiency and equipment reliability. These devices provide critical inputs to automated control systems that adjust fuel flows, valve positions, and operational parameters to maintain optimal performance while preventing overpressure conditions that could damage expensive generating equipment. The pharmaceutical and biotechnology industries utilize precision pressure transmitters in clean room environments, sterile processing systems, and fermentation vessels where maintaining specific pressure differentials prevents contamination and ensures product quality. Industrial compressed air systems, which serve as utility backbones for manufacturing facilities, depend on pressure transmitters for compressor control, distribution network management, and end-use application optimization, reducing energy consumption while ensuring adequate pressure availability for pneumatic tools and process equipment throughout diverse manufacturing operations.
End Use Industry Insights:
- Oil & Gas
- Power Generation
- Water & Wastewater
- Food & Beverages
- Chemicals
- Metals & Mining
- Pulp & Paper
- Pharmaceuticals
- Others
Oil & gas exhibit a clear dominance with a 25% share of the total United States pressure transmitter market in 2025.
The oil and gas industry represents the dominant end-use segment for pressure transmitters due to the fundamental requirement for accurate pressure monitoring throughout exploration, production, transportation, and refining operations. Upstream production facilities utilize pressure transmitters for wellhead monitoring, determining reservoir pressures, optimizing production rates, and ensuring well control during drilling activities where precise pressure management prevents blowouts and formation damage. Offshore drilling platforms depend on high-specification transmitters capable of operating in harsh marine environments with extreme temperatures, corrosive saltwater exposure, and high vibration conditions while maintaining measurement accuracy critical for personnel safety and environmental protection.
Midstream pipeline operations employ pressure transmitters throughout gathering systems, transmission lines, and distribution networks to monitor flow conditions, detect leaks, and manage pipeline integrity through continuous pressure surveillance across thousands of miles of infrastructure. Refineries and petrochemical complexes utilize hundreds of pressure transmitters per facility for monitoring distillation towers, reactor vessels, pump discharge pressures, and product transfer systems where measurement accuracy directly impacts product yields, energy efficiency, and equipment reliability. The segment benefits from ongoing automation initiatives aimed at improving operational efficiency, reducing labor costs, and enhancing safety performance through remote monitoring capabilities and predictive maintenance strategies. Natural gas processing plants require specialized transmitters for cryogenic applications, high-pressure separation systems, and custody transfer measurement where regulatory compliance and commercial accuracy standards mandate premium instrumentation with documented traceability and performance certifications.
Region Insights:
To get detailed regional analysis of this market Request Sample
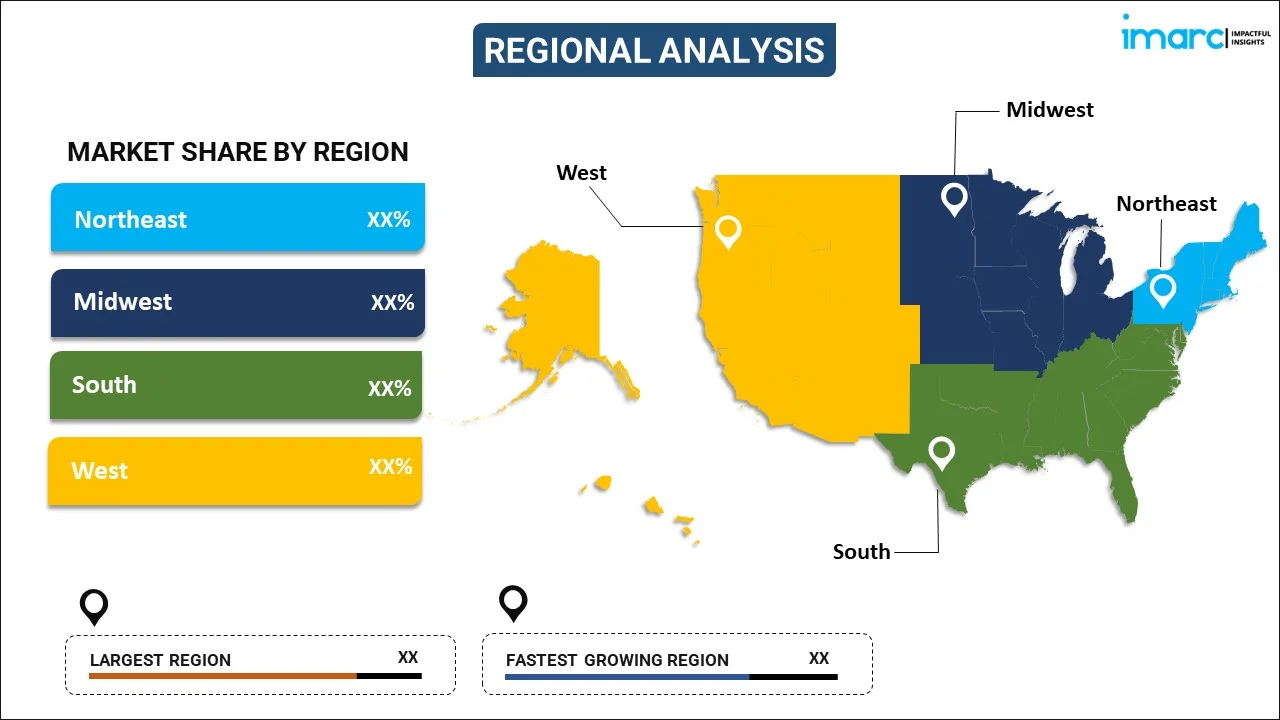
- Northeast
- Midwest
- South
- West
The Northeast region maintains steady demand driven by established pharmaceutical manufacturing clusters, chemical processing facilities, and aging water infrastructure requiring modernization. Dense industrial concentration in states like New Jersey, Pennsylvania, and New York supports consistent replacement cycles, while stringent environmental regulations mandate enhanced monitoring capabilities across refineries and chemical plants.
The Midwest represents a significant market anchored by extensive automotive manufacturing, food processing operations, and petrochemical facilities across the Great Lakes industrial corridor. States including Ohio, Michigan, and Illinois feature concentrated industrial bases requiring pressure measurement across diverse applications, while agricultural processing facilities and ethanol production plants contribute to regional demand patterns.
The South dominates regional market share through concentrated oil and gas infrastructure along the Gulf Coast, encompassing major refining complexes, petrochemical facilities, and offshore production platforms. Texas and Louisiana account for substantial transmitter deployments across upstream, midstream, and downstream operations, while expanding industrial development throughout the region supports growing measurement requirements.
The West region exhibits diverse demand patterns spanning semiconductor manufacturing in technology corridors, food processing throughout agricultural regions, and emerging renewable energy infrastructure including geothermal and hydrogen production facilities. California's stringent environmental regulations drive advanced monitoring requirements, while mining operations across mountain states maintain consistent pressure measurement needs for extraction and processing applications.
Market Dynamics:
Growth Drivers:
Why is the United States Pressure Transmitter Market Growing?
Expansion of Oil and Gas Operations
The oil and gas sector's ongoing development drives substantial demand for pressure transmitters across upstream, midstream, and downstream segments requiring accurate measurement for operational safety and efficiency. Upstream exploration and production activities utilize pressure transmitters for wellhead monitoring, reservoir pressure determination, and drilling fluid management where precise measurements prevent well control incidents and optimize hydrocarbon recovery rates. The industry's shift toward unconventional resources including shale gas and tight oil formations necessitates advanced pressure monitoring technologies capable of withstanding high-pressure hydraulic fracturing operations and horizontal drilling environments. In 2025, The Department of the Interior revealed a Secretary’s Order called “Unleashing American Offshore Energy,” instructing the Bureau of Ocean Energy Management to implement the actions required, as per federal law, to abolish the limiting Biden 2024–2029 National Outer Continental Shelf Oil and Gas Leasing Program and substitute it with a new, extensive 11th National Outer Continental Shelf Oil and Gas Leasing Program by October 2026. In accordance with this directive, the Department is issuing the Secretary’s Draft Proposed Program for the 11th National Outer Continental Shelf Oil and Gas Leasing Program.
Stringent Safety and Regulatory Compliance Requirements
Industrial facilities face increasingly rigorous regulatory mandates governing workplace safety, environmental protection, and process reliability that necessitate accurate pressure monitoring systems for hazard prevention and regulatory compliance. The U.S. EPA finalized Supplemental Effluent Limitations Guidelines for steam electric power generating units in May 2024, requiring coal-fired power plants to reduce wastewater pollutants by more than 660 million pounds annually through improved treatment processes that depend on precise pressure control throughout chemical feed systems, filtration equipment, and discharge monitoring points. These regulatory frameworks compel facilities to invest in certified instrumentation meeting performance specifications for safety instrumented systems, emergency shutdown applications, and continuous emissions monitoring where measurement failures could result in catastrophic incidents or regulatory violations.
Infrastructure Development and Water Treatment Expansion
Continuous investments in critical infrastructure sectors including water treatment, power generation, and transportation systems generate sustained demand for pressure transmitters supporting facility operations and process optimization. The Bipartisan Infrastructure Law delivered over $50 billion to the EPA for improving drinking water, wastewater, and stormwater infrastructure, including $10 billion specifically for communities affected by emerging contaminants like PFAS, necessitating upgraded treatment facilities with modern instrumentation. Water treatment plants utilize pressure transmitters throughout raw water intake systems, chemical feed operations, filtration processes, and distribution networks to maintain optimal operating pressures ensuring treatment effectiveness and preventing pipe breaks in aging municipal systems. Wastewater treatment facilities require pressure monitoring in pumping stations, aeration basins, membrane bioreactors, and biosolids processing equipment where accurate measurement supports automated control strategies optimizing energy consumption while meeting discharge permit requirements. Power generation sector infrastructure including both conventional fossil fuel plants and emerging renewable energy facilities depends on pressure transmitters for feedwater systems, steam turbines, and cooling circuits where measurement accuracy directly impacts generation efficiency and equipment reliability.
Market Restraints:
High Calibration and Maintenance Costs
Pressure transmitters require regular calibration to maintain measurement precision and accuracy throughout their operational lifecycle. Environmental conditions including temperature fluctuations, vibration exposure, and process media characteristics cause sensing elements to drift from original accuracy levels over time, necessitating periodic recalibration using traceable reference standards. The calibration process is time-consuming and costly, particularly for high-precision or high-range devices used in custody transfer applications, pharmaceutical manufacturing, and safety instrumented systems where regulatory compliance mandates documented calibration intervals and performance verification. Facilities must either maintain internal calibration laboratories with expensive reference equipment and trained technicians or contract with third-party calibration services, creating recurring operational expenses. Field-mounted transmitters often require removal from service for bench calibration, causing process disruptions and production losses particularly in continuous manufacturing operations where redundant instrumentation may not be available.
Cybersecurity Risks with IIoT Integration
The integration of pressure transmitters with Industrial Internet of Things systems and network-connected control platforms introduces cybersecurity vulnerabilities that could compromise critical industrial operations and safety systems. Connected devices create potential entry points for cyberattacks targeting industrial control systems, enabling unauthorized access to process networks, manipulation of measurement data, or disruption of automated control functions. Balancing efficiency, compatibility, and sustainability while addressing these security risks remains a significant challenge for widespread deployment of smart transmitters. Industries handling hazardous materials or operating critical infrastructure must implement comprehensive cybersecurity frameworks including network segmentation, encrypted communications, authentication protocols, and continuous monitoring to protect against evolving cyber threats. The complexity and cost of cybersecurity measures can deter adoption of advanced digital transmitters particularly in smaller facilities with limited information technology resources and expertise.
High Initial Investment and Operational Complexity
Advanced pressure transmitter technologies incorporating smart features like wireless communication, remote diagnostics, and predictive analytics capabilities require substantial upfront capital investment that may exceed budgets for small and medium-sized enterprises. The implementation costs extend beyond equipment purchase to include engineering design, installation labor, network infrastructure, and system integration expenses for incorporating new transmitters into existing control systems. Organizations must also invest in workforce training to enable maintenance personnel to properly configure, troubleshoot, and maintain digital transmitters with sophisticated functionality compared to traditional analog devices. This learning curve can result in extended commissioning timelines and increased operational risks during transition periods. The complexity of modern transmitter features including multiple communication protocols, advanced diagnostics, and configuration software may overwhelm facilities lacking specialized instrumentation expertise, leading to underutilization of advanced capabilities despite premium pricing.
Competitive Landscape:
The United States pressure transmitter market demonstrates concentrated competition among multinational industrial automation corporations possessing extensive product portfolios, established distribution networks, and comprehensive technical support infrastructure serving diverse end-use industries. Market leaders maintain competitive advantages through continuous product innovation, global manufacturing capabilities, and long-standing customer relationships built on reliability and service quality. These corporations invest substantially in research and development activities targeting next-generation technologies including wireless communication, advanced diagnostics, and materials engineering for extreme service conditions. The competitive environment emphasizes total cost of ownership value propositions encompassing initial purchase price, installation simplicity, calibration intervals, and lifecycle support rather than commodity pricing strategies. Regional manufacturers and specialized instrumentation suppliers compete through niche market focus, customized solutions, and responsive technical service differentiating their offerings from standardized products offered by global corporations.
United States Pressure Transmitter Market Report Coverage:
| Report Features | Details |
|---|---|
| Base Year of the Analysis | 2025 |
| Historical Period | 2020-2025 |
| Forecast Period | 2026-2034 |
| Units | Million USD |
| Scope of the Report | Exploration of Historical Trends and Market Outlook, Industry Catalysts and Challenges, Segment-Wise Historical and Future Market Assessment:
|
| Types Covered | Absolute Pressure Transmitters, Gauge Pressure Transmitters, Differential Pressure Transmitters, Multivariable Pressure Transmitters |
| Sensing Technologies Covered | Strain Gauge, Capacitive, Piezoelectric, Others |
| Fluid Types Covered | Liquid, Steam, Gas |
| Applications Covered | Flow, Level, Pressure |
| End Use Industries Covered | Oil & Gas, Power Generation, Water & Wastewater, Food & Beverages, Chemicals, Metals & Mining, Pulp & Paper, Pharmaceuticals, Others |
| Regions Covered | Northeast, Midwest, South, West |
| Customization Scope | 10% Free Customization |
| Post-Sale Analyst Support | 10-12 Weeks |
| Delivery Format | PDF and Excel through Email (We can also provide the editable version of the report in PPT/Word format on special request) |
Frequently Asked Questions About the United States Pressure Transmitter Market Report
The United States pressure transmitter market size was valued at USD 993.96 Million in 2025.
The United States pressure transmitter market is expected to grow at a compound annual growth rate of 1.20% from 2026-2034 to reach USD 1,106.62 Million by 2034.
Gauge pressure transmitters dominated the market with a 32% share in 2025, driven by extensive applications in liquid level measurement, storage tank monitoring, and hydrostatic pressure sensing across oil and gas, water treatment, and chemical processing industries requiring atmospheric reference pressure measurements.
Key factors driving the United States pressure transmitter market include expansion of oil and gas operations across upstream exploration, midstream transportation, and downstream refining segments requiring accurate pressure monitoring for operational safety and efficiency optimization; stringent regulatory compliance requirements governing workplace safety, environmental protection, and process reliability that mandate certified instrumentation for hazard prevention; and infrastructure development investments in water treatment, power generation, and transportation systems supporting facility modernization and process control enhancement.
Major challenges include high calibration and maintenance costs requiring periodic recalibration using traceable reference standards and specialized equipment particularly for high-precision devices used in safety-critical applications, cybersecurity risks associated with Industrial Internet of Things integration creating vulnerabilities in network-connected control systems; and high initial investment requirements for advanced transmitters with smart features including wireless communication, remote diagnostics, and predictive analytics capabilities that may exceed budgets for small and medium-sized enterprises while requiring workforce training to properly configure and maintain sophisticated digital instrumentation.
Need more help?
- Speak to our experienced analysts for insights on the current market scenarios.
- Include additional segments and countries to customize the report as per your requirement.
- Gain an unparalleled competitive advantage in your domain by understanding how to utilize the report and positively impacting your operations and revenue.
- For further assistance, please connect with our analysts.
 Request Customization
 Speak to an Analyst
 Request Brochure
 Inquire Before Buying
Benefits of Customization
- Personalize this research
- Triangulate with your data
- Get data as per your format and definition
- Gain a deeper dive into a specific application, geography, customer, or competitor
- Any level of personalization
Get in Touch With Us
UNITED STATES
Phone: +1-201-971-6302
INDIA
Phone: +91-120-433-0800
UNITED KINGDOM
Phone: +44-753-714-6104
Email: [email protected]
Client Testimonials


.webp)


