
United States Radiation-Hardened Electronics Market Size, Share, Trends and Forecast by Product Type, Material Type, Technique, Component Type, Application, and Region, 2026-2034
United States Radiation-Hardened Electronics Market Summary:
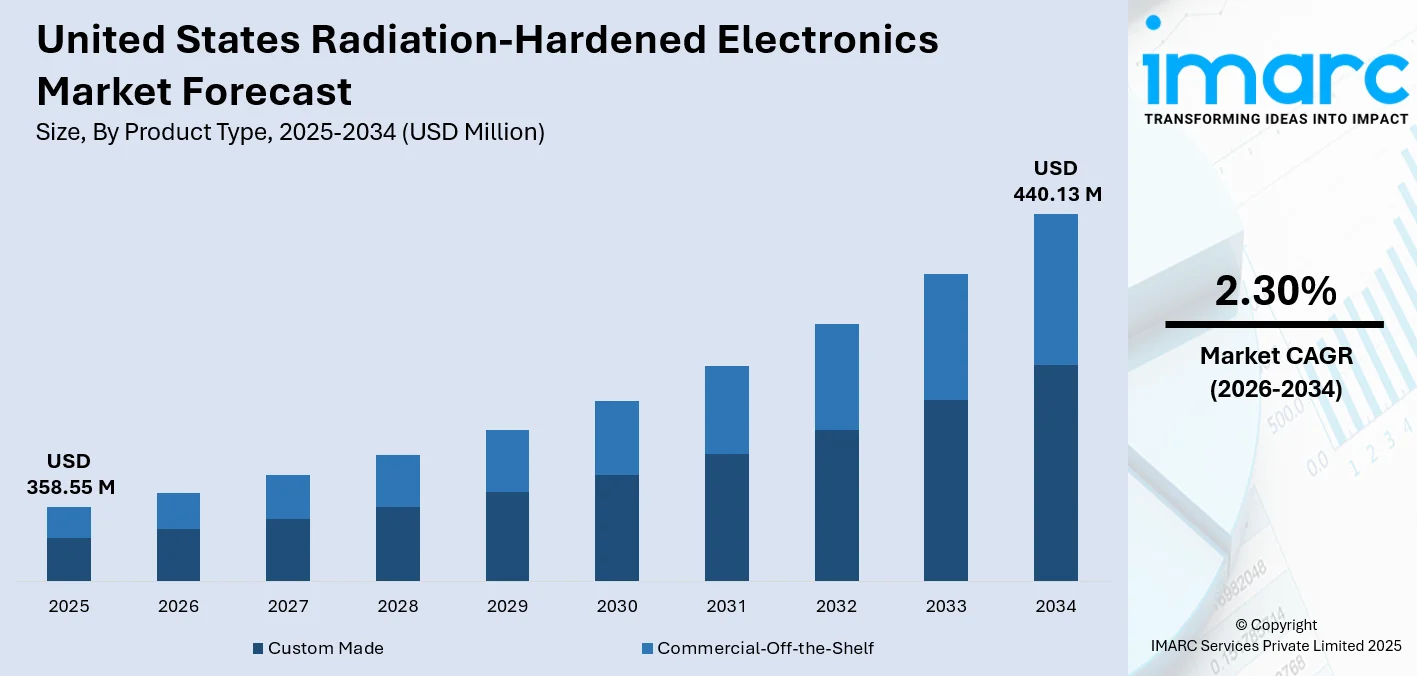
The United States radiation-hardened electronics market size was valued at USD 358.55 Million in 2025 and is projected to reach USD 440.13 Million by 2034, growing at a compound annual growth rate of 2.30% from 2026-2034.
The market is driven by escalating demand for resilient electronic components across space exploration, defense, and aerospace sectors where radiation-resistant functionality is essential. Increasing investments in satellite constellations, advanced military technologies, and nuclear energy applications are propelling adoption rates. The expanding commercial space industry, coupled with government initiatives supporting national security infrastructure, continues to stimulate procurement of specialized components, thereby strengthening the United States radiation-hardened electronics market share.
Key Takeaways and Insights:
-
By Product Type: Commercial-off-the-shelf dominates the market with a share of 63% in 2025, driven by its cost-effectiveness, rapid deployment capabilities, and increasing adoption in low Earth orbit satellites and defense applications where standardized solutions meet performance requirements efficiently.
-
By Material Type: Silicon leads the market with a share of 56% in 2025, owing to its established manufacturing infrastructure, proven radiation tolerance properties, and widespread application across processors, memory components, and integrated circuits in space and defense systems.
-
By Technique: Radiation hardening by design (RHBD) represents the largest segment with a market share of 59% in 2025, attributed to incorporating radiation mitigation at the architectural level, ensuring superior performance and reliability in mission-critical aerospace and defense applications.
-
By Component Type: Power management dominates the market with a share of 26% in 2025, driven by the critical necessity of stable power regulation in spacecraft systems, satellite operations, and military electronics where consistent energy distribution ensures operational integrity.
-
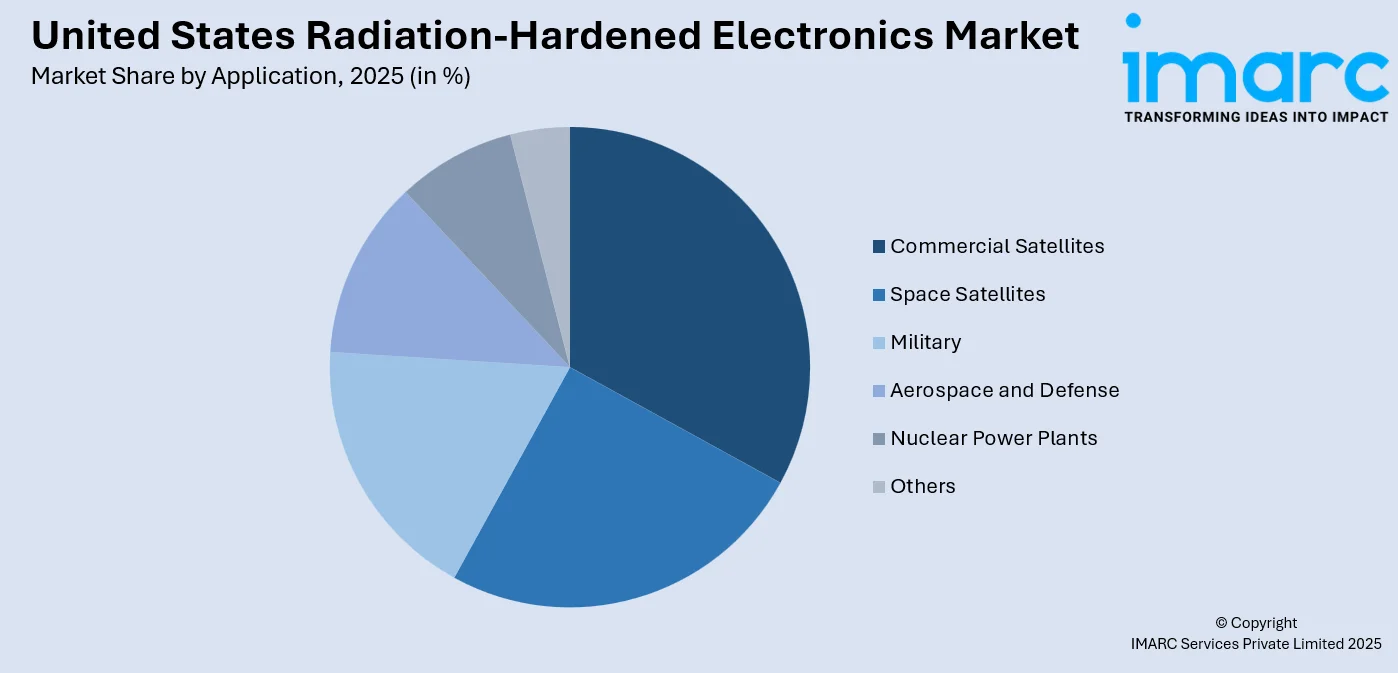
By Application: Commercial satellites lead the market with a share of 23% in 2025, attributed to the proliferating deployment of satellite constellations for telecommunications, Earth observation, and broadband internet services requiring radiation-tolerant electronic systems.
-
By Region: West dominates the market with a share of 32% in 2025, driven by the concentration of aerospace and defense contractors, space technology companies, and semiconductor manufacturers in California, Colorado, and Washington state.
-
Key Players: The United States radiation-hardened electronics market is moderately consolidated, led by major semiconductor firms and specialized aerospace manufacturers. Competition centers on strategic partnerships, technology collaborations, and sustained R&D investments to improve radiation tolerance and broaden application portfolios.
To get more information on this market Request Sample
The United States radiation-hardened electronics market is experiencing robust growth driven by multiple converging factors. The expanding space exploration initiatives, both governmental and commercial, require sophisticated electronic components capable of withstanding harsh cosmic radiation environments. As per sources, in November 2025, GlobalFoundries and BAE Systems partnered to develop 12nm FinFET radiation-hardened chips, combining U.S.-based manufacturing and space-grade electronics expertise for aerospace, defense, and communications applications. Moreover, defense modernization programs demand advanced radiation-resistant systems for military satellites, missile defense networks, and strategic communication platforms. The nuclear energy sector's resurgence necessitates reliable electronics for reactor instrumentation and control systems. Additionally, the proliferation of satellite-based services, including broadband connectivity, remote sensing, and navigation systems, continues to generate substantial demand for radiation-hardened components across the aerospace value chain.
United States Radiation-Hardened Electronics Market Trends:
Growing Adoption of Commercial-Off-the-Shelf Solutions in Space Applications
The market is witnessing a significant shift toward commercial-off-the-shelf radiation-tolerant components as space programs seek cost-effective alternatives without compromising reliability. This trend is particularly prevalent in low Earth orbit satellite constellations where mission durations and radiation exposure levels permit the use of modified commercial components. In November 2025, Vorago Technologies introduced four radiation-tolerant VA4 microcontrollers for low Earth orbit satellite constellations, offering embedded radiation protection and reducing costs by up to 75% versus traditional space-grade electronics. Furthermore, aerospace companies are increasingly implementing screening and qualification protocols to adapt standard electronics for space environments, enabling faster development cycles and reduced procurement costs while maintaining acceptable performance thresholds for commercial space applications.
Integration of Advanced Semiconductor Materials for Enhanced Performance
The industry is experiencing accelerated development of wide-bandgap semiconductor materials, particularly silicon carbide and gallium nitride, for radiation-hardened applications. These advanced materials offer superior thermal conductivity, higher breakdown voltages, and improved radiation tolerance compared to traditional silicon-based solutions. In May 2025, Infineon Technologies launched the first in-house radiation-hardened GaN transistors, achieving DLA JANS (U.S. government standard) certification for mission-critical space applications, enhancing reliability and performance in harsh orbital environments. Defense and aerospace programs are increasingly specifying these materials for power management systems and high-frequency applications where enhanced performance characteristics translate to reduced system weight, improved efficiency, and extended operational capabilities in challenging radiation environments.
Expansion of Reconfigurable and Software-Defined Radiation-Hardened Systems
The market is observing growing demand for reconfigurable radiation-hardened electronics, particularly field-programmable gate arrays, that enable satellite operators to modify system functionality while in orbit. According to sources, in November 2025, QuickLogic showcased radiation-tolerant embedded FPGA (eFPGA) Hard IP at Space Tech Expo Europe, enabling flexible, secure, and reconfigurable logic for aerospace and defense systems. Moreover, this capability significantly reduces mission risks and extends operational flexibility by allowing software updates and functional modifications throughout the spacecraft lifecycle. The trend reflects the broader industry movement toward adaptable space systems that can respond to evolving mission requirements, incorporate technological improvements, and address operational anomalies through remote reconfiguration capabilities.
Market Outlook 2026-2034:
The United States radiation-hardened electronics market revenue is projected to expand steadily through the forecast period, driven by sustained investments in space exploration and defense modernization. Commercial satellite deployment programs, government-funded aerospace initiatives, and nuclear energy sector requirements will continue generating demand. Technological advancements in semiconductor fabrication and radiation hardening techniques are expected to enhance product performance while improving cost efficiency. Strategic government contracts and collaborative research programs will further stimulate market expansion and innovation. The market generated a revenue of USD 358.55 Million in 2025 and is projected to reach a revenue of USD 440.13 Million by 2034, growing at a compound annual growth rate of 2.30% from 2026-2034.
United States Radiation-Hardened Electronics Market Report Segmentation:
|
Segment Category |
Leading Segment |
Market Share |
|
Product Type |
Commercial-Off-the-Shelf |
63% |
|
Material Type |
Silicon |
56% |
|
Technique |
Radiation Hardening by Design (RHBD) |
59% |
|
Component Type |
Power Management |
26% |
|
Application |
Commercial Satellites |
23% |
|
Region |
West |
32% |
Product Type Insights:
- Custom Made
- Commercial-Off-the-Shelf
Commercial-off-the-shelf dominates with a market share of 63% of the total United States radiation-hardened electronics market in 2025.
Commercial-off-the-shelf commands the largest market as components have gained widespread acceptance due to their inherent cost advantages over custom-made solutions, offering substantial savings in development expenses and procurement timelines. The segment benefits from established manufacturing processes and extensive supplier networks that ensure reliable component availability for commercial space programs, defense applications, and satellite constellation deployments across the country.
The growing adoption of commercial-off-the-shelf (COTS) radiation-tolerant components reflects the evolving risk tolerance in commercial space ventures where mission economics increasingly favor modified standard components over fully custom solutions. Manufacturers have developed sophisticated screening and qualification methodologies that enable COTS devices to meet stringent radiation performance requirements while preserving cost efficiencies. In November 2025, Microchip Technology launched the radiation-tolerant ATA6571RT CAN FD transceiver, providing high-reliability, cost-effective communication interfaces for satellites and spacecraft in harsh space environments. Furthermore, this approach has proven particularly valuable for mega-constellation satellite programs and small satellite missions where procurement economics significantly influence program viability.
Material Type Insights:
- Silicon
- Silicon Carbide
- Gallium Nitride
- Others
Silicon leads with a share of 56% of the total United States radiation-hardened electronics market in 2025.
Silicon dominates the material type segment owing to decades of established fabrication expertise and comprehensive understanding of radiation effects on silicon semiconductors. The extensive infrastructure supporting silicon device manufacturing enables cost-effective production of radiation-hardened components while maintaining stringent quality standards required for aerospace and defense applications. Silicon remains the preferred material for processors, memory devices, and integrated circuits deployed in satellites and spacecraft systems.
The segment's leadership position reflects the mature ecosystem of design tools, characterization methodologies, and testing protocols specifically developed for silicon-based radiation-hardened devices. Continuous improvements in silicon-on-insulator technologies and advanced fabrication nodes have enhanced radiation tolerance characteristics while enabling integration of increasingly complex functionalities. The availability of qualified foundry services and established supply chains further reinforces silicon's dominant position in the radiation-hardened electronics market.
Technique Insights:
- Radiation Hardening by Design (RHBD)
- Radiation Hardening by Process (RHBP)
- Radiation Hardening by Software (RHBS)
Radiation hardening by design (RHBD) exhibits a clear dominance with a 59% share of the total United States radiation-hardened electronics market in 2025.
Radiation hardening by design represents the leading technique segment, incorporating radiation mitigation strategies directly into circuit architecture and layout during the design phase. RHBD approaches enable manufacturers to utilize standard fabrication processes while achieving required radiation tolerance through innovative circuit topologies, redundant structures, and specialized design rules. This methodology has proven particularly effective for application-specific integrated circuits and field-programmable gate arrays destined for high-radiation space environments. As per sources, Frontgrade and Lattice Semiconductor completed radiation qualification and began shipping flight-grade Certus™-NX-RT FPGAs, enabling on-orbit, radiation-tolerant reconfigurable processing for U.S. satellites.
The technique's dominance stems from its flexibility in addressing both total ionizing dose effects and single-event phenomena through architectural solutions that can be implemented across various technology nodes and foundries. RHBD enables designers to optimize radiation hardness for specific mission requirements while balancing performance, power consumption, and cost considerations. Advanced electronic design automation tools incorporating radiation-aware synthesis and verification capabilities have further accelerated RHBD adoption across the aerospace industry.
Component Type Insights:
- Power Management
- Application Specific Integrated Circuit
- Logic
- Memory
- Field-Programmable Gate Array
- Others
Power management dominates with a market share of 26% of the total United States radiation-hardened electronics market in 2025.
Power management hold the largest share within the component type segmentation, reflecting the critical importance of stable power regulation in spacecraft and satellite systems. These components, including voltage regulators, power converters, and power distribution units, must maintain precise operational characteristics despite continuous radiation exposure throughout mission lifetimes. According to sources, in April 2025, EPC Space launched the EPCS4001 radiation-hardened DC-DC controller with the EPCSC401 reference design, providing robust, compact power conversion for spacecraft and high-radiation environments. Moreover, the segment's prominence underscores the fundamental requirement for reliable power systems that enable all other electronic subsystems to function correctly.
The power management segment encompasses diverse product categories serving applications from low-power scientific instruments to high-capacity satellite bus systems and electric propulsion power processing units. Increasing power demands in modern satellites and spacecraft, driven by advanced payloads and communication systems, continue expanding requirements for sophisticated radiation-hardened power management solutions. The transition toward higher voltage architectures and more efficient power conversion topologies presents ongoing development opportunities within this segment.
Application Insights:
- Space Satellites
- Commercial Satellites
- Military
- Aerospace and Defense
- Nuclear Power Plants
- Others
The commercial satellites lead with a share of 23% of the total United States radiation-hardened electronics market in 2025.
Commercial satellites represent the leading application segment, driven by the proliferating deployment of satellite constellations for telecommunications, broadband internet, Earth observation, and navigation services. The commercial space sector's rapid expansion has generated unprecedented demand for radiation-hardened electronics as private enterprises launch increasingly sophisticated satellite systems into various orbital regimes. This application segment benefits from substantial private investment flowing into commercial space ventures.
The segment's growth trajectory reflects fundamental shifts in satellite economics where mass production approaches and standardized platform architectures enable cost-effective constellation deployment. Commercial satellite operators require radiation-hardened components that balance performance requirements against procurement economics, favoring solutions that minimize program costs while ensuring mission reliability. The expanding scope of satellite-based services across communications, remote sensing, and connectivity applications continues driving sustained demand within this segment.

Regional Insights:
- Northeast
- Midwest
- South
- West
West dominates with a market share of 32% of the total United States radiation-hardened electronics market in 2025.
West dominates the United States radiation-hardened electronics market, anchored by the concentration of aerospace and defense contractors, semiconductor manufacturers, and space technology companies in California, Colorado, Washington, and Arizona. This region hosts major satellite manufacturers, launch service providers, and government space facilities that generate substantial procurement requirements for radiation-hardened components. The established aerospace industrial base provides extensive supply chain capabilities supporting domestic production.
The region's leadership position reflects decades of space industry development and defense contractor presence that has cultivated specialized expertise in radiation-hardened electronics design and manufacturing. Technology clusters in the West attract skilled workforce talent and research partnerships with leading universities advancing radiation effects science and hardening methodologies. Moreover, the proximity of component suppliers to major system integrators facilitates collaborative development and responsive technical support essential for complex aerospace programs.
Market Dynamics:
Growth Drivers:
Why is the United States Radiation-Hardened Electronics Market Growing?
Expanding Space Exploration and Commercial Satellite Deployment Programs
The United States radiation-hardened electronics market is experiencing significant growth driven by expanding space exploration initiatives and commercial satellite deployment programs. Government agencies continue advancing ambitious missions to the Moon, Mars, and deep space destinations, requiring sophisticated radiation-hardened systems capable of operating reliably for extended durations in harsh cosmic environments. In August 2025, Texas Instruments announced that its radiation-hardened and radiation-tolerant semiconductors are powering NASA-ISRO’s NISAR satellite, supporting high-resolution radar imaging and scientific exploration in extreme space conditions. Simultaneously, commercial space enterprises are deploying large-scale satellite constellations for broadband connectivity, Earth observation, and communication services, generating unprecedented demand for radiation-tolerant electronic components. The convergence of public and private sector investments in space infrastructure has created a sustained growth trajectory for radiation-hardened electronics manufacturers serving this expanding market.
Defense Modernization and National Security Electronics Requirements
Defense modernization programs represent a substantial driver for the United States radiation-hardened electronics market as military organizations upgrade strategic systems and deploy advanced technologies across multiple domains. Military satellites, missile defense systems, nuclear command and control infrastructure, and airborne electronic warfare platforms require radiation-hardened components to ensure operational reliability in contested environments. The emphasis on maintaining technological superiority and addressing emerging threats has accelerated procurement of specialized electronic systems designed to withstand both natural space radiation and potential nuclear electromagnetic pulse effects. According to sources, in September 2024, the U.S. Department of Defense awarded $25.8 Million to Honeywell to sustain domestic production of strategic radiation-hardened microelectronics, supporting defense systems and supply chain resilience. Moreover, sustained defense budgets and long-term modernization roadmaps provide consistent demand visibility for radiation-hardened electronics suppliers serving military programs.
Nuclear Energy Sector Expansion and Safety System Requirements
The nuclear energy sector's evolution is driving increased demand for radiation-hardened electronics in reactor instrumentation, control systems, and safety monitoring applications. New reactor designs, including small modular reactors and advanced generation facilities, require sophisticated electronic systems capable of reliable operation in high-radiation environments throughout extended operational lifetimes. In August 2025, the U.S. Department of Energy launched the Nuclear Reactor Pilot Program, selecting 11 advanced reactor projects to accelerate testing, deployment, and commercialization of next-generation nuclear technologies. Furthermore, regulatory requirements mandate stringent radiation qualification standards for safety-critical electronics deployed in nuclear facilities, ensuring consistent demand for qualified components. The broader energy transition emphasizing clean power generation has renewed interest in nuclear capacity expansion, creating growth opportunities for radiation-hardened electronics manufacturers serving this specialized market segment with components meeting nuclear qualification standards.
Market Restraints:
What Challenges the United States Radiation-Hardened Electronics Market is Facing?
High Development and Production Costs
The radiation-hardened electronics market faces significant cost barriers associated with specialized design processes, qualification testing, and limited production volumes. Development expenses for radiation-hardened components substantially exceed standard commercial electronics due to extensive characterization, simulation, and verification requirements. The specialized manufacturing processes and stringent quality controls necessary to achieve radiation tolerance add considerable costs that constrain market accessibility for some applications.
Extended Qualification and Certification Timelines
Lengthy qualification and certification processes represent significant constraints on market responsiveness and new product introduction timelines. Radiation testing campaigns, reliability demonstrations, and formal certification procedures can extend development cycles considerably compared to commercial electronics. These extended timelines create challenges for programs requiring rapid technology insertion or facing schedule pressures from evolving mission requirements.
Limited Supplier Base and Production Capacity Constraints
The specialized nature of radiation-hardened electronics results in a concentrated supplier base with limited production capacity that can constrain market growth during demand surges. Few manufacturers possess the specialized expertise, facilities, and qualified processes necessary to produce radiation-hardened components meeting aerospace and defense requirements. This concentration creates potential supply chain vulnerabilities and can result in extended lead times during periods of elevated demand.
Competitive Landscape:
The United States radiation-hardened electronics market exhibits a moderately consolidated competitive structure characterized by established semiconductor corporations and specialized aerospace component manufacturers competing across diverse product segments. Market participants differentiate through technological capabilities, product portfolio breadth, qualification credentials, and customer relationships developed through long-term program support. Strategic partnerships between component suppliers and system integrators enable collaborative development addressing emerging requirements. Continuous research investments and technology acquisitions shape competitive positioning as participants seek to expand capabilities and capture growth opportunities in expanding application areas. The competitive environment emphasizes reliability, technical performance, and responsive customer support as key differentiating factors influencing procurement decisions.
Recent Developments:
-
In May 2024, Apogee Semiconductor launched its AF54RHC GEO family of radiation-hardened integrated circuits for MEO, GEO, and deep space missions. The ICs provide 300 krad TID performance, over 80 MeV·mg/cm² single-event effect resilience, and pin-to-pin compatibility, enhancing reliability for demanding space applications and offering nine variants for sampling.
Report Coverage:
| Report Features | Details |
|---|---|
| Base Year of the Analysis | 2025 |
| Historical Period | 2020-2025 |
| Forecast Period | 2026-2034 |
| Units | Million USD |
| Segment Coverage | Product Type, Material Type, Technique, Component Type, Application, Region |
| Region Covered | Northeast, Midwest, South, West |
| Customization Scope | 10% Free Customization |
| Post-Sale Analyst Support | 10-12 Weeks |
| Delivery Format | PDF and Excel through Email (We can also provide the editable version of the report in PPT/Word format on special request) |
Frequently Asked Questions About the United States Radiation-Hardened Electronics Market Report Report
The United States radiation-hardened electronics market size was valued at USD 358.55 Million in 2025.
The United States radiation-hardened electronics market is expected to grow at a compound annual growth rate of 2.30% from 2026-2034 to reach USD 440.13 Million by 2034.
Commercial-off-the-shelf dominates the market due to cost efficiency, established manufacturing infrastructure, and growing use in commercial satellite programs and defense applications, enabling rapid deployment of reliable radiation-hardened electronic components across multiple sectors.
Key factors driving the United States radiation-hardened electronics market include expanding space exploration programs, commercial satellite constellation deployments, defense modernization initiatives, nuclear energy sector requirements, and advancing semiconductor technologies enhancing radiation tolerance.
Major challenges include high development and production costs, extended qualification and certification timelines, limited supplier base and production capacity constraints, technology obsolescence management, and supply chain vulnerabilities affecting component availability.
Need more help?
- Speak to our experienced analysts for insights on the current market scenarios.
- Include additional segments and countries to customize the report as per your requirement.
- Gain an unparalleled competitive advantage in your domain by understanding how to utilize the report and positively impacting your operations and revenue.
- For further assistance, please connect with our analysts.
 Request Customization
 Speak to an Analyst
 Request Brochure
 Inquire Before Buying
Benefits of Customization
- Personalize this research
- Triangulate with your data
- Get data as per your format and definition
- Gain a deeper dive into a specific application, geography, customer, or competitor
- Any level of personalization
Get in Touch With Us
UNITED STATES
Phone: +1-201-971-6302
INDIA
Phone: +91-120-433-0800
UNITED KINGDOM
Phone: +44-753-714-6104
Email: [email protected]
Client Testimonials


.webp)


