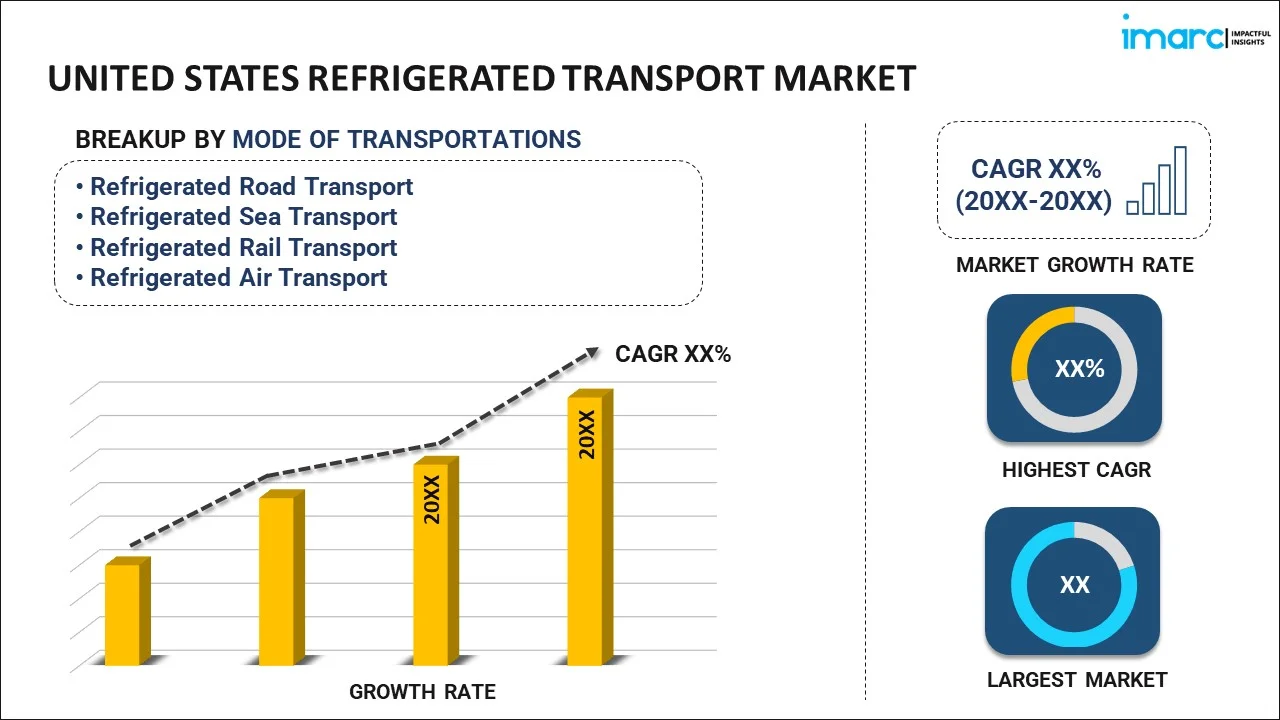
United States Refrigerated Transport Market Report by Mode of Transportation (Refrigerated Road Transport, Refrigerated Sea Transport, Refrigerated Rail Transport, Refrigerated Air Transport), Technology (Vapor Compression Systems, Air-Blown Evaporators, Eutectic Devices, Cryogenic Systems), Temperature (Single-Temperature, Multi-Temperature), Application (Chilled Food Products, Frozen Food Products, and Others), and Region 2026-2034
Market Overview:
The United States refrigerated transport market size reached USD 5.07 Billion in 2025. Looking forward, IMARC Group expects the market to reach USD 6.93 Billion by 2034, exhibiting a growth rate (CAGR) of 3.51% during 2026-2034. The market is driven by amplifying demand for temperature-sensitive products in food, pharmaceutical, and healthcare industries. Cold chain monitoring technology, electrification of fleets, and route optimization are boosting operational effectiveness and adherence. Growing online grocery shopping and strict safety regulations also underpin market growth. Increased merging of sustainable operations and intelligent logistics solutions is highly enhancing the competitiveness and service dependability, contributing to the United States refrigerated transportation market share.
|
Report Attribute
|
Key Statistics
|
|---|---|
|
Base Year
|
2025
|
|
Forecast Years
|
2026-2034
|
|
Historical Years
|
2020-2025
|
|
Market Size in 2025
|
USD 5.07 Billion |
|
Market Forecast in 2034
|
USD 6.93 Billion |
| Market Growth Rate (2026-2034) | 3.51% |
Access the full market insights report Request Sample
United States Refrigerated Transport Market Analysis:
- Major Market Drivers: The increasing demand for the movement of perishable goods such as fresh fruits and vegetables, dairy products, meat, and temperature-sensitive drugs is a principal driver of demand. Growth in online grocery ordering and delivery and improved regulatory requirements on food safety are also driving demand for cold chain logistics services.
- Key Market Trends: Growing emphasis on the use of state-of-the-art technologies such as GPS tracking, remote temperature monitoring, and energy-efficient refrigeration systems. The technologies are offering improved visibility to supply chains, reducing spoilage, and facilitating sustainability goals for temperature-controlled transportation operations, propelling United States refrigerated transport market growth.
- Competitive Landscape: The segment is comprised of a mix of traditional logistics companies and regional specialized fleets offering tailored refrigerated solutions. Industry players are investing in fleet renewal, automation, and digital platforms to improve the reliability of services and remain competitive in various temperature-sensitive industries.
- Challenges and Opportunities: High fuel prices, maintenance expenditure, and emissions standards are challenges. Opportunities in fleet electrification, green refrigerants, and expanding cold chain capacity to meet rising demand from food, pharmaceutical, and health sectors.
Refrigerated transport is the method of transporting shipments with specially designed temperature-controlled vehicles, such as refrigerated trucks or vans. These vehicles consist of built-in cooling technology equipped with refrigerating systems or containers with ready-made freezing mixtures, water ice, dry ice, or liquefied gases. They help maintain the required temperature throughout the transportation process to prevent the spoilage of fruits, meat, seafood, and dairy and other perishable products.
The United States represents one of the largest refrigerated transport markets across the globe. The market is primarily driven by the escalating import and export of products like fruits, vegetables, seafood, meat, and fresh flowers. Refrigerated transport reduces food deterioration due to physical, biochemical and physiological changes while preserving the quality of the product. Technological developments like cryogenics and the increased demand for frozen foods are further contributing to the high demand for refrigerated transportation systems in the country. Moreover, refrigerated transportation service providers are focusing on improving their supply chain efficiency and cold storage facilities. The leading companies are also using radio frequency identification (RFID), Bluetooth and other newly introduced technologies, such as drone delivery and driverless vehicles, to enhance the efficiency of the logistics services.
United States Refrigerated Transport Market Trends:
Increased Demand for Perishable Food Distribution
Increased consumption of perishable food items, such as dairy, meat, seafood, fruits and vegetables, and frozen meals, is having a considerable impact on refrigerated transport demand within the United States. Consumers are also intensely looking for fresh and quality-checked food products with longer shelf lives, leading food retailers and distributors to advance cold chain logistics. Urbanization, combined with increased disposable incomes, is also driving online food and meal-kit delivery faster, which is based on temperature-controlled logistics. The amplifying growth of supermarket chains as well as specialty food stores has led to more frequent and diverse refrigerated shipments. This change in structure towards cold-stored food supply has required the use of technologically equipped refrigerated trucks and trailers. These fleets are fitted with real-time temperature-monitoring systems to maintain compliance with food safety regulations. Consequently, this trend is promoting significant United States refrigerated transport market growth, driven by changing consumption patterns and logistics infrastructure development.
Pharmaceutical Cold Chain Distribution Expansion
The growing pharmaceutical industry is propelling rising use of refrigerated transport for the safe transportation of temperature-sensitive medications, vaccines, and biologics within the United States. As a result of advances in biotechnology and personalized medicine, most therapeutics today necessitate strict temperature control upon storage and transportation to maintain their effectiveness. Regulatory conditions placed by agencies like the FDA call for accurate temperature documentation and retention in transit, thus triggering the demand for specialized cold chain transport vehicles and containers. Clinical trial material and cell and gene therapy distribution has compounded this demand for validated cold chain logistics solutions. All these have expanded the refrigerated transportation market beyond food and beverage to encompass mission-critical healthcare use. As pharmaceutical supply chains become increasingly complicated and geographically extended, temperature-controlled logistics remain strategically vital. This sectoral integration and diversification are shaping the emerging United States refrigerated transport market trends, denoting a trend towards multi-industry dependency.
Technological Developments in Fleet Management
Technological advancement is having a crucial role in changing the efficiency and trustworthiness of refrigerated transport in the United States. Real-time monitoring, telematics, and Internet of Things -based temperature monitoring sensors have allowed transport providers to track cargo conditions in real time, guaranteeing adherence to cold chain procedures. Predictive maintenance solutions and route optimization software further improve business performance by minimizing downtime and fuel usage. Due to environmental controls and pressure toward sustainability, newer refrigeration units come equipped with the ability to run on low-emission refrigerants and hybrid or electric powertrain integration. These innovations not only save the environment but also promote cost savings in the long term. Further, digital platforms enable effortless co-ordination between shippers, logistics providers, and recipients with heightened transparency and accountability. These innovations highlight the significance of automation and data analytics in determining the United States refrigerated transport market analysis, which helps industry participants uphold quality, decrease loss, and expedite delivery timelines.
Key Market Segmentation:
IMARC Group provides an analysis of the key trends in each sub-segment of the United States refrigerated transport market report, along with forecasts at the country and regional level from 2026-2034. Our report has categorized the market based on mode of transportation, technology, temperature and application.
Breakup by Mode of Transportation:

To get detailed segment analysis of this market Request Sample
- Refrigerated Road Transport
- Refrigerated Sea Transport
- Refrigerated Rail Transport
- Refrigerated Air Transport
Breakup by Technology:
- Vapor Compression Systems
- Air-Blown Evaporators
- Eutectic Devices
- Cryogenic Systems
Breakup by Temperature:
- Single-Temperature
- Multi-Temperature
Breakup by Application:
- Chilled Food Products
- Dairy Products
- Bakery and Confectionery Products
- Fresh Fruits and Vegetables
- Others
- Frozen Food Products
- Frozen Dairy Products
- Processed Meat Products
- Fish and Seafood Products
- Others
- Others
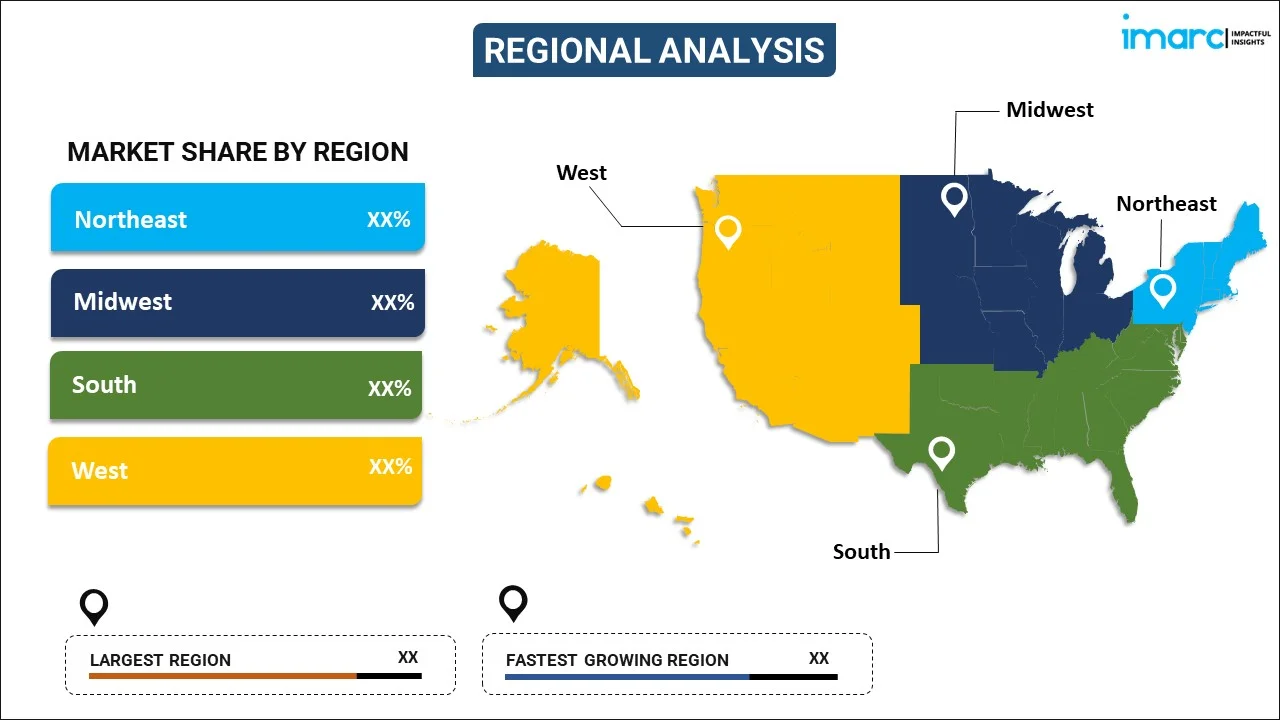
Breakup by Region:

To get detailed regional analysis of this market Request Sample
- Northeast
- Midwest
- South
- West
Competitive Landscape:
The competitive landscape of the industry has also been examined along with the profiles of the key players.
Latest News and Developments:
- In December 2024, Volvo Autonomous Solutions and DHL Supply Chain launched driverless freight trucking between Dallas and Houston with the use of Aurora Driver technology. This milestone represents a turning point for the United States refrigerated transport industry, which will see higher levels of automation and efficiency in temperature-controlled logistics along prominent regional freight routes.
- In May 2024, Isuzu Commercial Truck of America introduced its next-generation all-electric NRR EV truck with Thermo King's e300 all-electric refrigeration unit. Introduced at the ACT Expo, the Class 5 truck advances sustainable refrigerated transportation, with several configurations of batteries and power management optimized for cold-chain delivery throughout the United States.
Report Coverage:
| Report Features | Details |
|---|---|
| Base Year of the Analysis | 2025 |
| Historical Period | 2020-2025 |
| Forecast Period | 2026-2034 |
| Units | Billion USD |
| Segment Coverage | Mode of Transportation, Technology, Temperature, Application, Region |
| Region Covered | Northeast, Midwest, South, West |
| Customization Scope | 10% Free Customization |
| Post-Sale Analyst Support | 10-12 Weeks |
| Delivery Format | PDF and Excel through Email (We can also provide the editable version of the report in PPT/Word format on special request) |
Key Questions Answered in This Report
The refrigerated transport market in the United States was valued at USD 5.07 Billion in 2025.
The United States refrigerated transport market is projected to exhibit a (CAGR) of 3.51% during 2026-2034, reaching a value of USD 6.93 Billion by 2034.
Relevant drivers of the United States refrigerated transport market are rising demand for perishable food and pharmaceutical products, expansion of e-commerce grocery services, improved food safety controls, and demands for enhanced shelf life. Moreover, development in cold chain logistics, temperature monitoring technologies, and increasing urbanization are fueling the growth of the market in both food and healthcare supply chains.
Need more help?
- Speak to our experienced analysts for insights on the current market scenarios.
- Include additional segments and countries to customize the report as per your requirement.
- Gain an unparalleled competitive advantage in your domain by understanding how to utilize the report and positively impacting your operations and revenue.
- For further assistance, please connect with our analysts.
 Request Customization
 Speak to an Analyst
 Request Brochure
 Inquire Before Buying


.webp)


.webp)


