
US Renewable Energy Market Size, Share, Trends and Forecast by Type, End User, and Region, 2026-2034
US Renewable Energy Market Size, Share, Trends & Forecast (2026-2034)
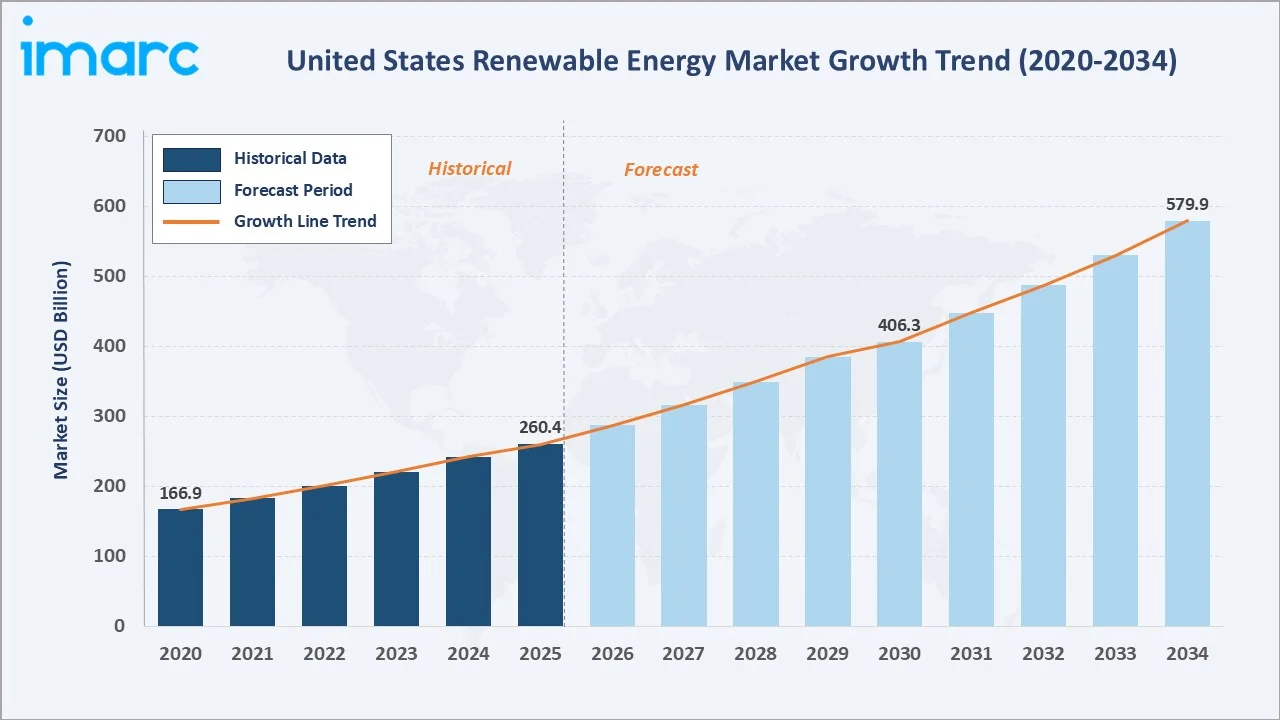
The US renewable energy market size was valued at USD 260.4 Billion in 2025 and is projected to reach USD 579.9 Billion by 2034, at a CAGR of 9.30% during 2026-2034. Expansion is driven by Inflation Reduction Act incentives, boosting clean energy investment and corporate procurement, alongside falling solar and storage costs and rising electricity demand from data centers and industrial electrification. Solar Power dominates with a 36.8% share in 2025, while Industrial end users account for 46.2% of national demand. The West leads regional demand with a 34.7% share in 2025, supported by California, Arizona, and Nevada utility-scale buildouts.
Market Snapshot
|
Metric |
Value |
|
Market Size (2025) |
USD 260.4 Billion |
|
Market Size (2030) |
USD 406.3 Billion |
|
Forecast Market Size (2034) |
USD 579.9 Billion |
|
CAGR (2026-2034) |
9.30% |
|
Base Year |
2025 |
|
Historical Period |
2020-2025 |
|
Forecast Period |
2026-2034 |
|
Largest Region |
West (34.7% share, 2025) |
|
Fastest Growing Region |
South |
|
Leading Type |
Solar Power (36.8%, 2025) |
|
Leading End User |
Industrial (46.2%, 2025) |
The chart below shows the US renewable energy market expansion from 2020–2034, with post-IRA policy acceleration driving the steepest gains in the forecast period.
To get more information on this market, Request Sample
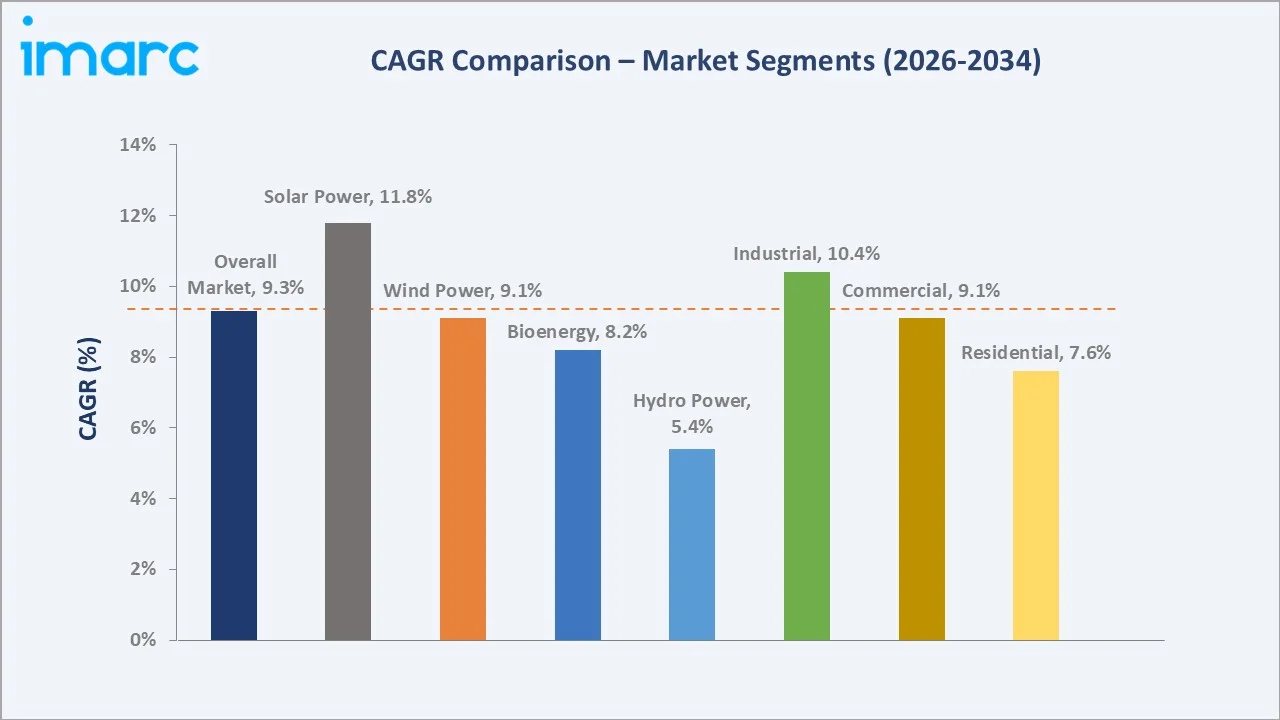
CAGR analysis identifies Solar Power and Industrial end users as the fastest-growing segments in the US renewable energy market through 2034, outpacing legacy hydro and residential penetration.
Executive Summary
The US renewable energy market is transforming due to federal tax credit expansions, record utility-scale buildouts, and surging corporate and hyperscaler demand for clean power. Valued at USD 260.4 Billion in 2025, the market is projected to reach USD 579.9 Billion by 2034, at a 9.30% CAGR. Renewables supplied around 26% of United States electricity generation in 2025, while wind and solar combined reached a record 17% of total output, according to the United States Energy Information Administration.
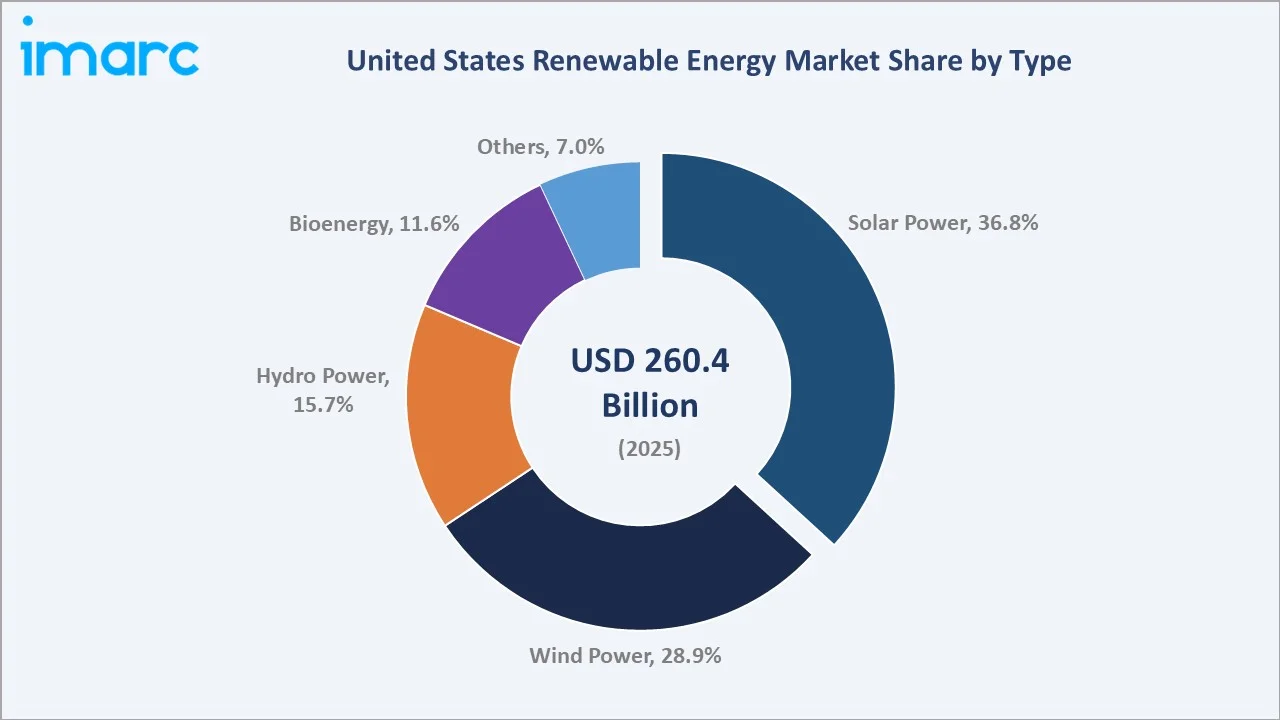
Solar Power leads the market with a 36.8% share in 2025, reflecting continued cost declines and supportive Investment Tax Credit treatment. Wind Power holds 28.9%, anchored by long-life onshore fleets in the Midwest and South. Industrial end users hold 46.2% of national demand, driven by manufacturing electrification, data center PPAs, and heavy industry decarbonization targets.
The West leads with a 34.7% share in 2025, supported by California, Arizona, Nevada, and Pacific Northwest hydro assets. The South holds 29.6%, lifted by Texas solar and wind dominance and Southeastern utility solar procurement. The Midwest accounts for 20.8%, propelled by wind-rich plains states, while the Northeast contributes 14.9%, led by offshore wind commissioning off Massachusetts and Rhode Island.
Key Market Insights
|
Insight |
Data |
|
Largest Type Segment |
Solar Power – 36.8% share (2025) |
|
Second Type Segment |
Wind Power – 28.9% share (2025) |
|
Leading End User |
Industrial – 46.2% share (2025) |
|
Leading Region |
West – 34.7% share (2025) |
|
Second Region |
South – 29.6% share (2025) |
|
Top Companies |
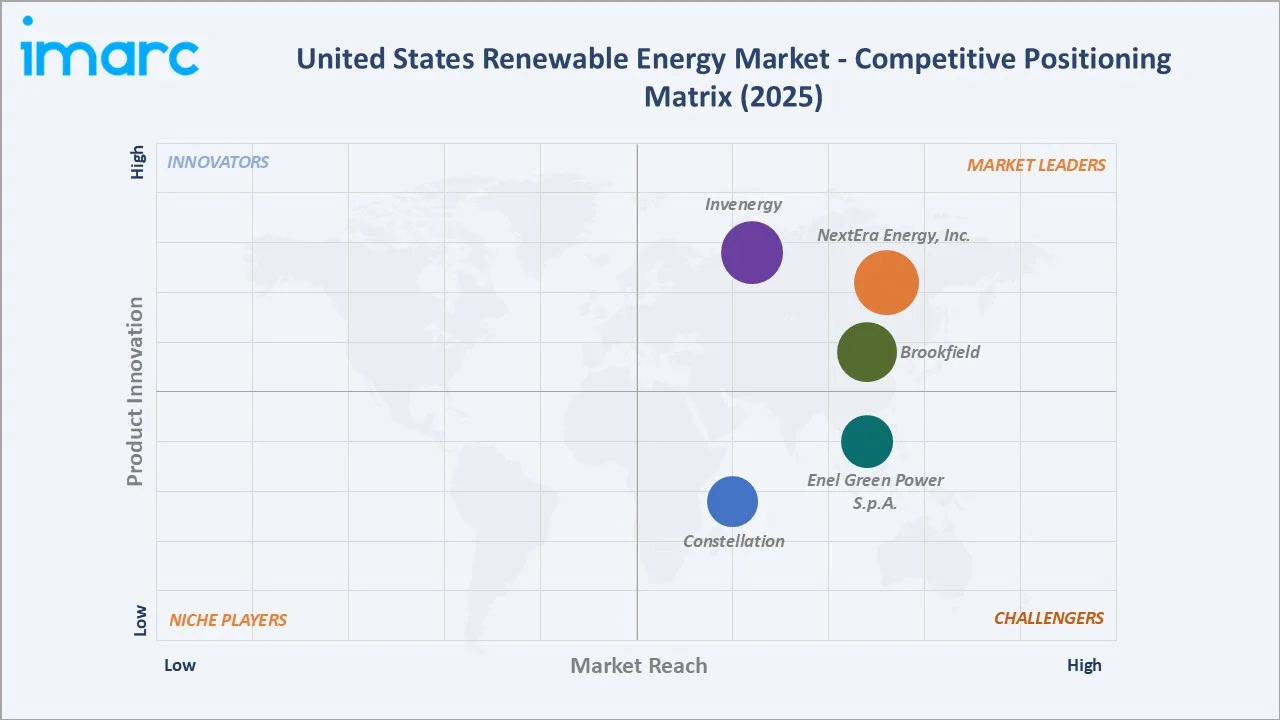
NextEra Energy, Inc., Brookfield, Invenergy, Constellation, and Enel Green Power S.p.A. |
Key Analytical Observations Supporting the Above Data:
- Solar Power's 36.8% leadership in 2025 is supported by continued record additions, with the United States installing over 30 GW of utility-scale solar capacity in 2024 and strong project pipelines expected to sustain growth into 2025–2026, driven by federal incentives and large-scale PV deployments.
- Wind Power at 28.9% in 2025 is underpinned by over 425,000 GWh of annual wind generation in recent years, with growth supported by new onshore capacity and early-stage offshore projects such as Vineyard Wind 1 advancing along the United States East Coast.
- Industrial end users command 46.2% in 2025, supported by rising corporate renewable procurement through long-term PPAs, particularly from data centers, advanced manufacturing, and energy-intensive industries seeking cost stability and decarbonization.
- The West region's 34.7% share in 2025 reflects strong renewable deployment led by California’s clean energy policies and large-scale solar expansion across the Southwest, though exact regional capacity additions vary annually and are not consistently reported as a single consolidated figure.
- The South is the fastest-growing region, with Texas alone adding 11.6 GW of new utility-scale solar in 2025, outpacing every other United States state.
- NextEra Energy operates approximately 76 GW of renewable capacity as of September 2025, establishing clear market leadership among United States clean energy developers.
US Renewable Energy Market Overview
Renewable energy in the United States spans electricity generated from solar photovoltaic and thermal, onshore and offshore wind, conventional and pumped-storage hydro, biomass and biogas, and geothermal sources. The ecosystem connects raw material suppliers, equipment manufacturers, project developers, EPC contractors, utilities, IPPs, transmission operators, and industrial, commercial, and residential end users. Growth is shaped by federal incentives, state RPS programs, electrification of transport and industry, resilience requirements, and rising electricity demand from data centers, AI workloads, and domestic manufacturing reshoring.
Market Dynamics
To evaluate market opportunities, Request Sample
Market Drivers
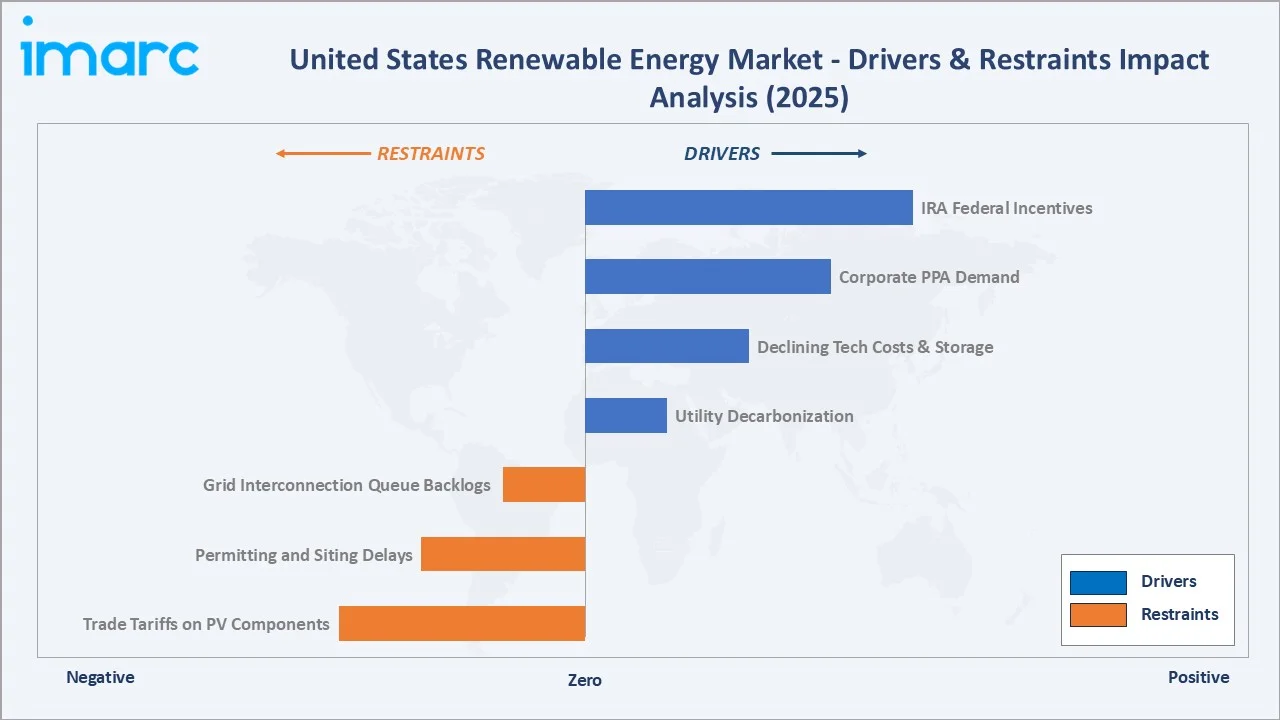
- Federal Incentives Under the Inflation Reduction Act: IRA tax credits (ITC/PTC) and domestic content incentives are accelerating renewable deployment. The U.S. Energy Information Administration projects record capacity additions led by solar, though exact yearly forecasts vary by outlook.
- Corporate Power Purchase Agreement Demand: Corporate PPAs from data centers and large enterprises are expanding rapidly, driven by decarbonization goals. U.S. clean energy investment exceeded USD 170 billion in 2022 and continues to grow, supported by private-sector procurement.
- Declining Technology Costs and Storage Integration: Falling costs of utility-scale solar and battery storage are improving project economics. EIA reports record growth in battery deployments, enhancing grid reliability and enabling higher renewable penetration across U.S. power systems.
- Utility Decarbonization Roadmaps and Load Growth: Utilities are accelerating coal retirements and investing in renewables with storage to meet rising electricity demand. Federal and regional transmission reforms across major grids support the integration of clean energy capacity.
Market Restraints
- Grid Interconnection Queue Backlogs: U.S. interconnection queues exceed 2,000 GW of proposed generation and storage capacity, with lengthy study processes delaying project timelines and revenues. Backlogs and procedural complexity remain major barriers to timely renewable project deployment.
- Permitting and Siting Delays: Local opposition, environmental reviews under NEPA, and transmission right-of-way challenges are lengthening project development cycles for wind and large-scale solar.
- Trade Tariffs on PV Components: Section 201, Section 301, and AD/CVD tariffs on imported PV cells, modules, and polysilicon have raised equipment costs for United States developers through 2025.
Market Opportunities
- Offshore Wind Buildout Along the Atlantic Coast: Projects such as Vineyard Wind 1 (~800 MW) have begun delivering power, marking early operational progress. The U.S. East Coast holds a multi-gigawatt offshore wind pipeline supported by federal leasing and state procurement targets.
- Green Hydrogen and Clean Fuel Production: Regional Hydrogen Hubs funded under the Bipartisan Infrastructure Law are catalyzing USD billions in electrolyzer investment, leveraging wind and solar surpluses for industrial decarbonization.
- Data Center and AI Load-Driven Clean PPAs: Rising electricity demand from data centers and AI workloads is expected to significantly increase U.S. power consumption this decade. This is accelerating long-term corporate PPAs for renewable energy to secure clean, reliable supply.
Market Challenges
- Skilled Workforce and EPC Capacity Shortages: Shortages of electricians, transmission-line workers, and solar installers are limiting project throughput, particularly in high-growth Texas, Arizona, and Southeastern markets.
- Policy and Tax Credit Uncertainty: Political transitions and potential revisions to IRA provisions create near-term investment uncertainty, especially around domestic content, prevailing-wage, and foreign-entity-of-concern rules.
- Transmission Capacity and Siting Constraints: Building interregional transmission lines remains slow due to multi-state permitting complexity, curtailing renewable deliverability from resource-rich interior states to coastal load centers.
Emerging Market Trends
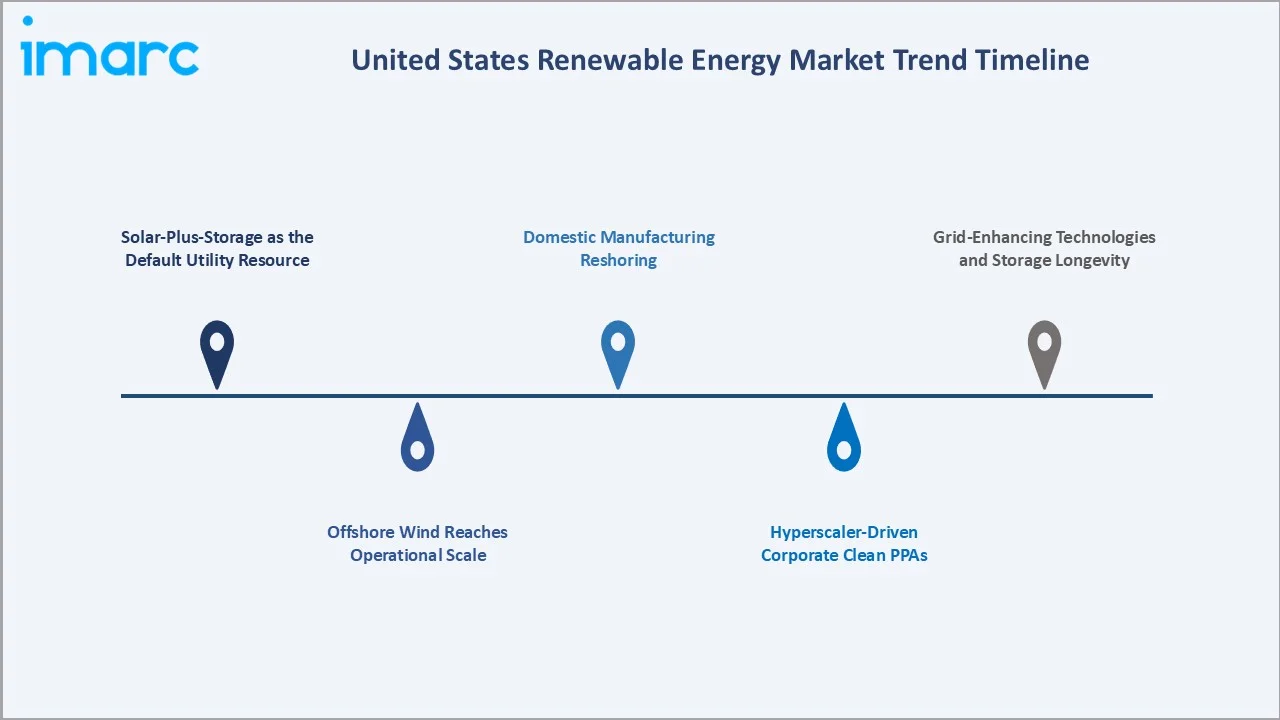
1. Solar-Plus-Storage as the Default Utility Resource
Utilities are increasingly procuring co-located solar and battery systems to improve reliability. The U.S. Energy Information Administration reports strong growth in battery capacity, led by Texas and California, supporting higher renewable integration.
2. Offshore Wind Reaches Operational Scale
The United States offshore wind sector transitioned from pilots to commercial operations with Vineyard Wind 1 and Revolution Wind energizing in 2025. A multi-gigawatt pipeline across the Atlantic Coast is under development, targeting deployment through the late 2020s.
3. Hyperscaler-Driven Corporate Clean PPAs
Large technology firms and data center operators are driving record renewable procurement through long-term PPAs. Corporate demand for clean electricity continues to expand in line with decarbonization targets and rising digital infrastructure energy needs.
4. Domestic Manufacturing Reshoring
IRA incentives are accelerating domestic manufacturing of solar and battery components. Companies like First Solar and Hanwha Qcells are expanding U.S. production capacity to strengthen supply chains.
5. Grid-Enhancing Technologies and Storage Longevity
Utilities are adopting grid-enhancing technologies and piloting long-duration storage solutions to improve transmission efficiency and reduce congestion. These innovations support higher renewable penetration and grid stability in constrained regions.
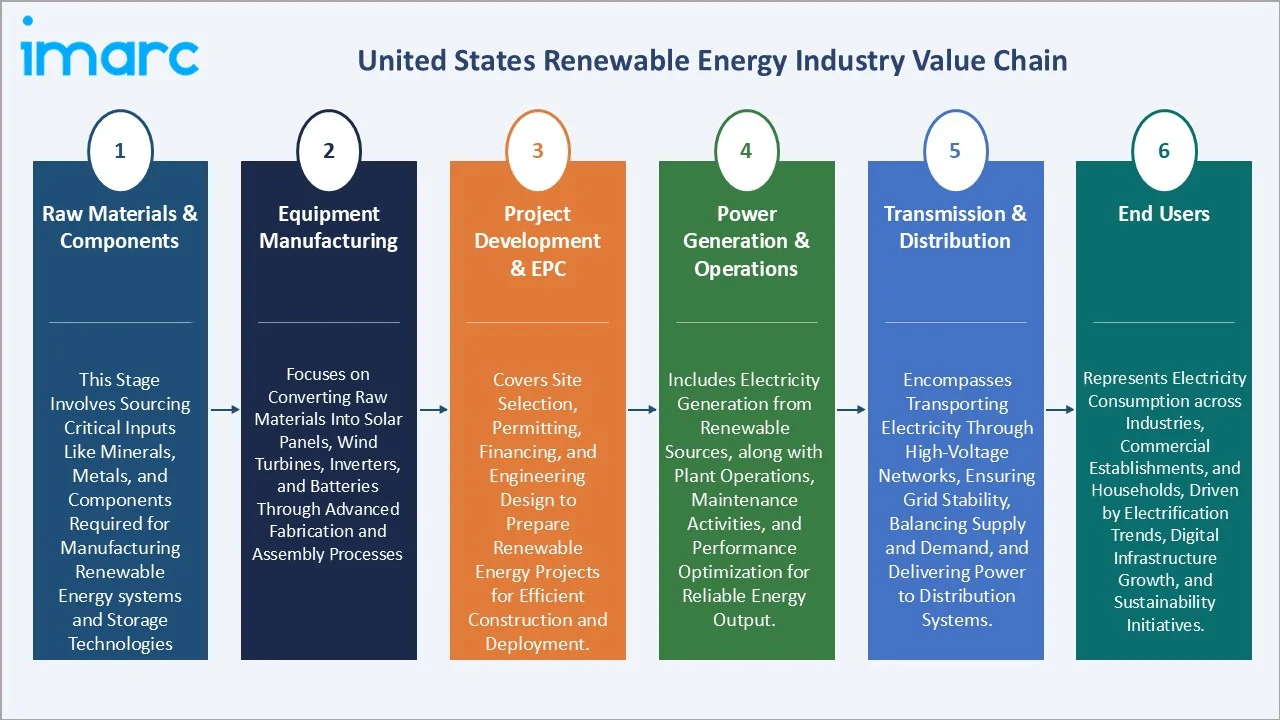
Industry Value Chain Analysis
The United States renewable energy value chain covers six stages, from raw material extraction and module manufacturing through project development, operations, and delivery to end users, each shaped by unique cost structures and regulatory requirements.
|
Stage |
Descriptions |
|
Raw Materials & Components |
This stage involves sourcing critical inputs like minerals, metals, and components required for manufacturing renewable energy systems and storage technologies |
|
Equipment Manufacturing |
Focuses on converting raw materials into solar panels, wind turbines, inverters, and batteries through advanced fabrication and assembly processes - First Solar, Hanwha Qcells |
|
Project Development & EPC |
Covers site selection, permitting, financing, and engineering design to prepare renewable energy projects for efficient construction and deployment. |
|
Power Generation & Operations |
Includes electricity generation from renewable sources, along with plant operations, maintenance activities, and performance optimization for reliable energy output. |
|
Transmission & Distribution |
Encompasses transporting electricity through high-voltage networks, ensuring grid stability, balancing supply and demand, and delivering power to distribution systems. |
|
End Users |
Represents electricity consumption across industries, commercial establishments, and households, driven by electrification trends, digital infrastructure growth, and sustainability initiatives. |
Vertically integrated independent power producers hold the strongest value positions by combining development, ownership, and long-term PPA origination. Scale enables superior procurement economics, operational efficiency, and technology investment beyond what smaller developers can pursue.
Technology Landscape in the United States Renewable Energy Industry
Advanced Photovoltaic and Module Technology
TOPCon and heterojunction technologies are entering commercial deployment, with module efficiencies typically exceeding 22–23%. Bifacial modules with trackers improve energy yield. Thin-film CdTe technology supports domestic manufacturing, aided by Inflation Reduction Act incentives and supply chain localization efforts.
Battery Energy Storage and Long-Duration Technologies
Lithium iron phosphate batteries dominate utility-scale storage due to safety and cost advantages. Long-duration technologies such as iron-air and flow batteries remain in pilot stages. U.S. battery capacity is rapidly expanding, with significant annual additions reported by energy agencies.
Smart Grid, Digitalization, and AI-Enabled Operations
Predictive analytics, digital twins, and AI-driven asset management are optimizing fleet performance across wind and solar portfolios. Advanced Distribution Management Systems and Distributed Energy Resource Management platforms are enabling bidirectional power flows for residential and commercial prosumers.
Green Hydrogen and Sector Coupling
The U.S. government has announced funding for multiple regional hydrogen hubs to accelerate clean hydrogen production using renewable energy. These initiatives target decarbonization across sectors including heavy industry, transportation, and chemicals through electrolytic hydrogen deployment.
Market Segmentation Analysis
The report covers the following segments:
|
Segment Category |
Leading Segment |
Market Share |
Year |
|
Type |
Solar Power |
36.8% |
2025 |
|
End User |
Industrial |
46.2% |
2025 |
|
Region |
West |
34.7% |
2025 |

By Type
Solar Power leads with a 36.8% share in 2025, driven by 27.2 GW of utility-scale additions in 2025 and a planned 43.4 GW in 2026. Continuing cost module declines, domestic content incentives, and Texas-, California-, and Arizona-led buildouts underpin sustained dominance.
To access detailed market analysis, Request Sample
Wind Power held 28.9% in 2025, anchored by long-established onshore fleets in Texas, Iowa, Oklahoma, Kansas, and Illinois and supplemented by newly operational offshore wind off Massachusetts and Rhode Island. Hydropower (15.7%) and Bioenergy (11.6%) provide baseload and dispatchable support, while Others (7.0%) capture geothermal and emerging waste-to-energy capacity.
By End User
Industrial end users command 46.2% in 2025, reflecting heavy-industry electrification, hyperscale data center PPAs, semiconductor fabs, and electric-vehicle supply chain facilities procuring dedicated clean power at gigawatt scale.
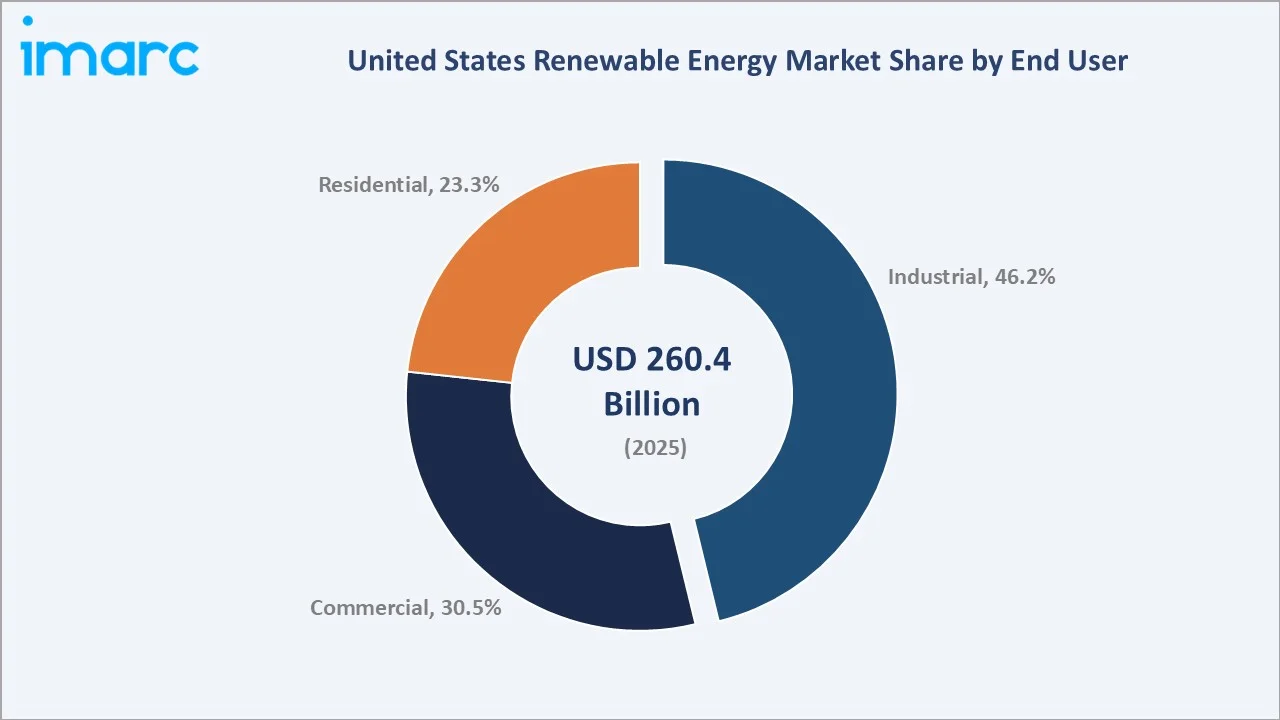
Commercial end users account for 30.5% in 2025, driven by retail, logistics, and office portfolios executing net-zero commitments through rooftop solar, community solar, and virtual PPAs. Residential demand stands at 23.3%, supported by rooftop solar adoption, net-metering programs, and residential battery storage integration that grew 11% in 2025 alone.
Regional Market Insights
|
Region |
Share (2025) |
Key Growth Drivers |
|
West |
34.7% |
California RPS, Texas-border and Arizona utility solar buildouts, Pacific Northwest hydro, Nevada geothermal |
|
South |
29.6% |
Texas leadership in onshore wind and utility solar (11.6 GW of 2025 solar adds), Southeast utility procurement, Gulf Coast green hydrogen hubs |
|
Midwest |
20.8% |
Wind-rich plains (Iowa, Kansas, Oklahoma, Illinois), MISO and SPP transmission expansions, growing corporate PPA activity |
|
Northeast |
14.9% |
Offshore wind commissioning (Vineyard Wind 1, Revolution Wind), state clean energy standards in NY, MA, NJ, CT, CEJA-style policy leadership |
The West commands a 34.7% national revenue share in 2025, reflecting its role as the largest renewable energy region in the United States. California’s ambitious Renewable Portfolio Standard drives national leadership, while Arizona and Nevada benefit from strong solar deployment. Pacific Northwest hydropower resources and rapid battery storage expansion particularly in California collectively strengthen the western United States’ leadership in renewable energy generation and grid flexibility.
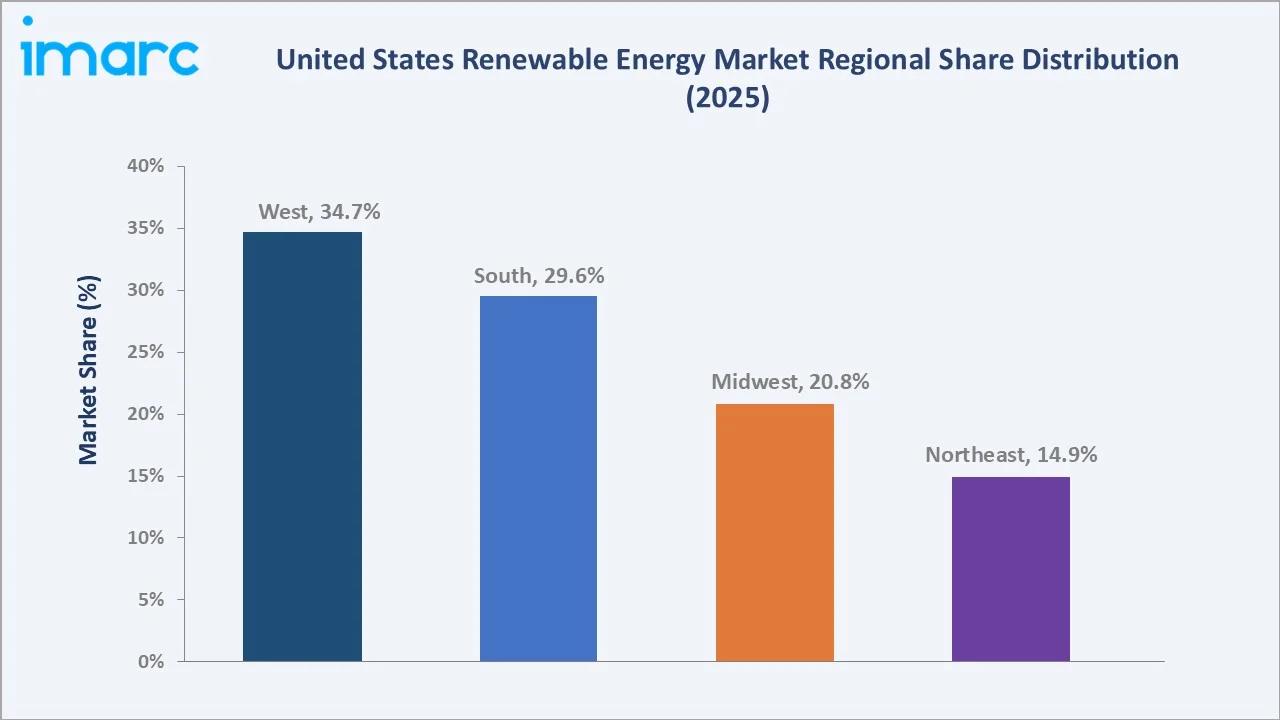
The South, at 29.6% in 2025, is the fastest-growing United States region, driven by Texas's ERCOT market adding 11.6 GW of utility-scale solar and leading national wind capacity. The Midwest (20.8%) is anchored by wind-rich plains states, while the Northeast (14.9%) is accelerating through offshore wind commissioning and aggressive state-level clean energy mandates that will compound regional growth through 2034.
Competitive Landscape
|
Company Name |
Key Brand |
Market Position |
Core Strength |
|
NextEra Energy, Inc. |
NextEra Energy Resources |
Leader |
Largest United States wind + solar + storage operator (~76 GW) |
|
Brookfield |
Brookfield Renewable N.A. |
Leader |
Hydro, wind, solar, storage across 34 states (~8.2 GW) |
|
Invenergy |
Invenergy |
Leader |
Largest private developer; 13.8 GW installed across wind, solar, storage |
|
Constellation |
Constellation |
Challenger |
90% carbon-free generation portfolio across nuclear + renewables |
|
Enel Green Power S.p.A. |
Enel Green Power |
Challenger |
Wind, solar, storage across 9 United States states |
The US renewable energy market is led by a small cohort of scaled operators alongside a long tail of regional developers, IPPs, and distributed solar installers. NextEra Energy, the largest renewables operator in North America, reported approximately 76 GW of operating renewable capacity as of September 2025 and commanded a market capitalization above USD 170 Billion, reinforcing its leadership position.
Key Company Profiles
NextEra Energy, Inc.
NextEra Energy, based in Juno Beach, Florida, is a leading U.S. clean energy company and the world’s largest generator of wind and solar power, operating through Florida Power & Light and NextEra Energy Resources, with extensive renewable and battery storage assets.
- Product & Service Portfolio: Develops and operates utility-scale wind, solar, and battery storage projects, provides energy marketing and transmission services, and delivers regulated electricity generation and distribution through Florida Power & Light.
- Recent Developments: In 2025, NextEra Energy, Inc. reported continued expansion of its renewable pipeline in 2025, adding significant new wind, solar, and battery storage projects to its development backlog, including approximately 3 GW of new renewable generation added in Q3, driven by strong demand from utilities and corporate buyers.
- Strategic Focus: Scale renewables-plus-storage buildouts, capture AI and data center-driven PPA demand, and execute its Real Zero plan to eliminate operational carbon emissions by 2045.
Brookfield
Brookfield, headquartered in Toronto, is a leading global renewable power platform with significant U.S. operations, operating a diversified portfolio of hydropower, wind, solar, and storage assets, supported by long-term contracts and a strong development and acquisition pipeline.
- Product & Service Portfolio: Hydroelectric power, onshore wind, utility-scale solar, battery storage, and distributed generation services for commercial and industrial customers.
- Recent Developments: In 2025, Brookfield expanded its U.S. clean energy pipeline in 2025 through a landmark hydroelectric PPA with Google worth over $3 billion. The agreement enables up to 3 GW capacity, including 670 MW in Pennsylvania, with expansion planned across PJM and MISO regions.
- Strategic Focus: Long-duration, contracted cash flow growth via hydro, wind, solar, and storage development, supported by disciplined capital recycling and selective acquisitions.
Invenergy
Invenergy, headquartered in Chicago, is the largest privately held renewable energy developer in the United States, with over 30 GW of projects developed globally across wind, solar, storage, and natural gas, supported by a growing transmission and clean energy infrastructure platform.
- Product & Service Portfolio: Develops, owns, and operates wind, solar, battery storage, natural gas, and emerging hydrogen projects, alongside transmission infrastructure and asset management services for utilities and commercial customers.
- Recent Developments: In 2025, Invenergy LLC expanded its U.S. renewable footprint in 2025 through multiple large-scale solar and storage projects, including 590 MW of solar projects across Ohio, Indiana, and Tennessee backed by $1.1 billion financing, while also signing major corporate PPAs such as a ~791 MW clean energy supply deal with Meta to support data center demand.
- Strategic Focus: Focuses on scaling integrated renewable generation and transmission infrastructure while expanding into hydrogen and clean fuels to support long-term grid decarbonization and industrial electrification.
Market Concentration Analysis
The US renewable energy market is moderately concentrated at the top, with NextEra Energy, Brookfield, and Invenergy collectively accounting for an estimated 15–20% of operating renewable capacity in 2025. Scale advantages in procurement, project finance, and transmission access reinforce leader positions.
Fragmentation increases sharply below the top tier, with hundreds of IPPs, distributed solar installers, community solar developers, and regional utilities competing across specific states and resource zones. This creates a bifurcated structure: a concentrated leader tier serving large corporate and utility offtakers, and a fragmented downstream segment serving commercial and residential users.
Consolidation continues through selective M&A, with major IPPs acquiring regional developers to secure permitted pipelines. Capital intensity, IRA domestic content compliance, and interconnection timelines are pressuring smaller, undercapitalized developers to partner, sell pipelines, or exit.
Investment & Growth Opportunities
Fastest-Growing Segments
Utility-scale solar plus battery storage is the fastest-growing United States renewable energy segment, with 2026 planned additions of 43.4 GW of solar and 24 GW of storage — together accounting for 79% of all new United States generating capacity, according to EIA. Offshore wind, industrial clean hydrogen, and community solar represent secondary high-growth segments through 2034.
Emerging Geographic Opportunities
Texas, California, and Arizona lead renewable capacity additions, with Texas dominating solar and battery storage growth. Additional expansion is occurring in the Southeast for solar, the Midwest for wind and transmission, and coastal regions for offshore wind development.
Venture and Strategic Investment Trends
Capital flows into United States clean energy reached record levels in 2025, with private equity, infrastructure funds, and strategic corporates targeting solar developers, battery storage platforms, grid-enhancing technology providers, and domestic manufacturing joint ventures. IRA-backed domestic content premiums are drawing billions in greenfield United States module, tracker, and battery cell plant investment.
Future Market Outlook (2026-2034)
The US renewable energy market is projected to expand from USD 260.4 Billion in 2025 to USD 406.3 Billion by 2030 and USD 579.9 Billion by 2034, at a CAGR of 9.30% — representing more than USD 319 Billion of incremental value creation. Growth will be anchored by sustained federal and state incentives, declining technology costs, expanded transmission buildout, and structural electricity demand from electrification, data centers, and onshoring of United States manufacturing.
Three transformational shifts will reshape the market through 2034. First, solar-plus-storage will become the default new-build resource for most utilities and corporate offtakers. Second, offshore wind will reach multi-gigawatt operational scale along the Atlantic Coast. Third, domestic clean energy manufacturing — modules, trackers, inverters, battery cells, and electrolyzers — will materially expand, supported by IRA credit structures.
By 2034, renewables are expected to supply close to half of total United States electricity generation, with integrated solar-plus-storage, offshore wind, and clean hydrogen redefining system planning. Operators combining scale, transmission access, storage integration, and digital asset optimization are positioned to capture disproportionate value across the forecast period.
Research Methodology
Primary Research
Primary research comprised structured interviews conducted during 2024–2025 with senior executives at United States independent power producers, investor-owned utility resource planners, corporate sustainability and procurement leaders, EPC contractors, component manufacturers, grid operators, and institutional investors focused on energy transition assets.
Secondary Research
Secondary sources include United States Energy Information Administration (EIA) Electric Power Monthly and Preliminary Monthly Electric Generator Inventory data, Federal Energy Regulatory Commission (FERC) filings, United States Department of Energy reports, Lawrence Berkeley National Laboratory market briefs, Solar Energy Industries Association data, American Clean Power Association publications, and public company 10-K and investor disclosures.
Forecasting Models
Market size estimates and forecasts were developed using combined top-down and bottom-up approaches, incorporating capacity additions, generation output, levelized costs, PPA pricing, tax credit assumptions, and macroeconomic indicators, stress-tested under base, upside, and downside regulatory scenarios.
US Renewable Energy Market Report Coverage
| Report Features | Details |
|---|---|
| Base Year of the Analysis | 2025 |
| Historical Period | 2020-2025 |
| Forecast Period | 2026-2034 |
| Units | Billion USD |
| Scope of the Report | Exploration of Historical and Forecast Trends, Industry Catalysts and Challenges, Segment-Wise Historical and Predictive Market Assessment:
|
| Types Covered | Hydro Power, Wind Power, Solar Power, Bioenergy, Others |
| End Users Covered | Industrial, Residential, Commercial |
| Regions Covered | Northeast, Midwest, South, West |
| Companies Covered | NextEra Energy, Inc., Brookfield, Invenergy, Constellation, Enel Green Power S.p.A., etc. |
| Customization Scope | 10% Free Customization |
| Post-Sale Analyst Support | 10-12 Weeks |
| Delivery Format | PDF and Excel through Email (We can also provide the editable version of the report in PPT/Word format on special request) |
Key Benefits for Stakeholders:
- IMARC’s industry report offers a comprehensive quantitative analysis of various market segments, historical and current market trends, market forecasts, and dynamics of the US renewable energy market from 2020-2034.
- The research report provides the latest information on the market drivers, challenges, and opportunities in the US renewable energy market.
- Porter's five forces analysis assist stakeholders in assessing the impact of new entrants, competitive rivalry, supplier power, buyer power, and the threat of substitution. It helps stakeholders to analyze the level of competition within the US renewable energy industry and its attractiveness.
- A competitive landscape allows stakeholders to understand their competitive environment and provides an insight into the current positions of key players in the market.
Frequently Asked Questions About the US Renewable Energy Market Report
The US renewable energy market was valued at USD 260.4 Billion in 2025, driven by IRA-backed tax credits, utility decarbonization, corporate PPAs, and rapidly falling solar-plus-storage costs nationwide.
The market is projected to reach USD 579.9 Billion by 2034, growing at a CAGR of 9.30% during 2026-2034, supported by utility-scale solar, offshore wind, storage integration, and data center clean power demand.
Solar Power leads with a 36.8% share in 2025, supported by 27.2 GW of utility-scale additions in 2025 and 43.4 GW planned for 2026, reinforced by IRA Investment Tax Credit extensions.
Industrial end users command a 46.2% share in 2025, driven by hyperscale data center PPAs, semiconductor fabs, EV supply chain facilities, and heavy-industry electrification commitments.
The West leads with a 34.7% share in 2025, anchored by California's RPS, Arizona and Nevada solar corridors, Pacific Northwest hydropower, and rapid battery storage deployment across the region.
Key drivers include IRA tax credits, corporate PPA demand, declining solar and storage costs, utility decarbonization plans, data center and AI load growth, and state Renewables Portfolio Standards.
The South is the fastest-growing region, led by Texas adding 11.6 GW of utility-scale solar in 2025 alongside leading national wind capacity and Gulf Coast green hydrogen development.
Leading companies include NextEra Energy, Inc., Brookfield, Invenergy, Constellation, and Enel Green Power S.p.A. Among Others.
Wind Power holds 28.9% of the market in 2025, generating 464,000 GWh — about three percent more than 2024 — and expanding with offshore additions like Vineyard Wind 1 and Revolution Wind.
Advanced PV modules, LFP and long-duration storage, AI-driven asset management, grid-enhancing technologies, and green hydrogen are raising efficiency and deliverability across the United States renewable fleet.
Wind Power is the second-largest segment at 28.9% in 2025, anchored by onshore fleets in Texas, Iowa, Oklahoma, Kansas, and Illinois and newly operational offshore wind off the Northeast Atlantic coast.
Need more help?
- Speak to our experienced analysts for insights on the current market scenarios.
- Include additional segments and countries to customize the report as per your requirement.
- Gain an unparalleled competitive advantage in your domain by understanding how to utilize the report and positively impacting your operations and revenue.
- For further assistance, please connect with our analysts.
 Request Customization
 Speak to an Analyst
 Request Brochure
 Inquire Before Buying
Benefits of Customization
- Personalize this research
- Triangulate with your data
- Get data as per your format and definition
- Gain a deeper dive into a specific application, geography, customer, or competitor
- Any level of personalization
Get in Touch With Us
UNITED STATES
Phone: +1-201-971-6302
INDIA
Phone: +91-120-433-0800
UNITED KINGDOM
Phone: +44-753-714-6104
Email: [email protected]
Client Testimonials


.webp)


