
United States Soda Ash Market Report by Application (Glass, Soaps and Detergents, Chemicals, Metallurgy, Pulp and Paper, and Others), and Region 2026-2034
Market Overview:
The United States soda ash market size reached 6.7 Million Tons in 2025. Looking forward, IMARC Group expects the market to reach 9.7 Million Tons by 2034, exhibiting a growth rate (CAGR) of 4.27% during 2034. The escalating product use in water treatment facilities, the growing need for purified water in various sectors, and the increasing number of federal and state-level initiatives aimed at supporting domestic industries are among the key factors driving the market growth.
|
Report Attribute
|
Key Statistics
|
|---|---|
|
Base Year
|
2025
|
|
Forecast Years
|
2026-2034
|
|
Historical Years
|
2020-2025
|
|
Market Size in 2025
|
6.7 Million Tons |
|
Market Forecast in 2034
|
9.7 Million Tons |
| Market Growth Rate 2026-2034 | 4.27% |
Access the full market insights report Request Sample
Soda ash, scientifically known as sodium carbonate, is a white, odorless powder that is soluble in water. It is an essential industrial chemical used in the production of various products like glass, detergents, and other cleaning products. It is obtained through mining of trona ore, a naturally occurring mineral, or through a synthetic process using limestone and sodium chloride. Its alkaline properties make it valuable in controlling pH levels in various industrial processes. Furthermore, it plays a crucial role in the manufacturing of textiles, paper, and food products. The global demand for soda ash continues to grow due to its wide range of applications across various industries, making it an integral component in today's industrial landscape.
The United States is rich in natural trona deposits majorly drives the market. This abundance offers a competitive advantage in terms of production costs and accessibility, leading to increased exports. The positioning of the U.S. as a key supplier to growing international markets is significantly drives the soda ash industry. Along with this, the use of soda ash in water treatment facilities is on the rise due to its effectiveness in controlling water pH levels. The escalating need for purified water in various sectors, including municipal water supply, industrial processes, and even agriculture, is driving this demand. In addition, changing consumer preferences towards eco-friendly and sustainably produced products also impact the soda ash industry. As consumers become more conscientious about the products they use and the ingredients in those products, companies are responding by providing transparency and using environmentally responsible ingredients. Apart from this, federal and state-level initiatives aimed at supporting domestic industries are contributing to the market. Moreover, the widespread adoption of new technologies and continuous innovation in the production process of soda ash is creating a positive market outlook.
United States Soda Ash Market Trends/Drivers:
Increased Product Demand in the Glass Manufacturing Industry
The United States soda ash industry has seen significant growth, largely driven by the increasing demand in the glass manufacturing sector. Soda ash is a vital ingredient in the production of glass. As the construction and automotive industries continue to flourish in the U.S., the demand for various types of glass, including flat glass, container glass, and fiberglass, has soared. Moreover, the push towards energy-efficient buildings and vehicles is promoting the use of advanced glass products, which require soda ash in their manufacturing. Moreover, technological advancements in glass production, coupled with government regulations encouraging sustainable construction practices, further augment this trend. The integration of this material in renewable energy technologies, such as solar panels, also underscores the market's potential for growth. As the economy continues to expand, this driver is anticipated to hold a significant influence over the domestic soda ash market for the foreseeable future.
Sustainability and Environmental Regulations
Environmental concerns and sustainability are becoming key factors in shaping the soda ash industry in the United States. The focus on reducing carbon emissions and the utilization of environmentally friendly materials are prompting companies to explore sustainable methods of soda ash production. Along with this, the implementation of regulations and guidelines by the Environmental Protection Agency (EPA) and other federal bodies are fostering the development of eco-friendly production processes, such as the Solvay process. Furthermore, the growing consumer awareness of environmental issues is leading to increased demand for products manufactured using sustainable practices, boosting the market for soda ash produced using green technologies. Furthermore, the emphasis on corporate social responsibility and sustainable sourcing by various industries also fuels this trend. This driver underscores a critical transition in the soda ash industry towards environmental stewardship, reflecting a broader shift in industrial manufacturing practices in the United States.
United States Soda Ash Industry Segmentation:
IMARC Group provides an analysis of the key trends in each segment of the United States soda ash market report, along with forecasts at the country and regional levels from 2026-2034. Our report has categorized the market based on application.
Breakup by Application:
To get detailed segment analysis of this market Request Sample
- Glass
- Soaps and Detergents
- Chemicals
- Metallurgy
- Pulp and Paper
- Others
Glass application dominates the market
The report has provided a detailed breakup and analysis of the market based on the application. This includes glass, soaps and detergents, chemicals, metallurgy, pulp and paper, and others. According to the report, glass application represented the largest segment.
The United States soda ash industry is experiencing a significant influx of market drivers that are shaping the application of glass. These drivers, rooted in factual trends, are instrumental in propelling growth and innovation within the industry. Along with this, the escalating demand for glass packaging across various sectors, including beverages, pharmaceuticals, and cosmetics, is a prime market driver. Additionally, the drive towards sustainable practices has prompted a shift towards glass packaging due to its recyclability and reduced environmental impact. The expanding construction and automotive industries further contribute to the demand for glass products, including windows and windshields. Furthermore, advancements in glass technology, such as tempered and laminated glass, have broadened its applications in architecture and safety applications. These collective market drivers underscore the pivotal role of glass in the United States soda ash industry, positioning it as a pivotal player in the market's growth trajectory.
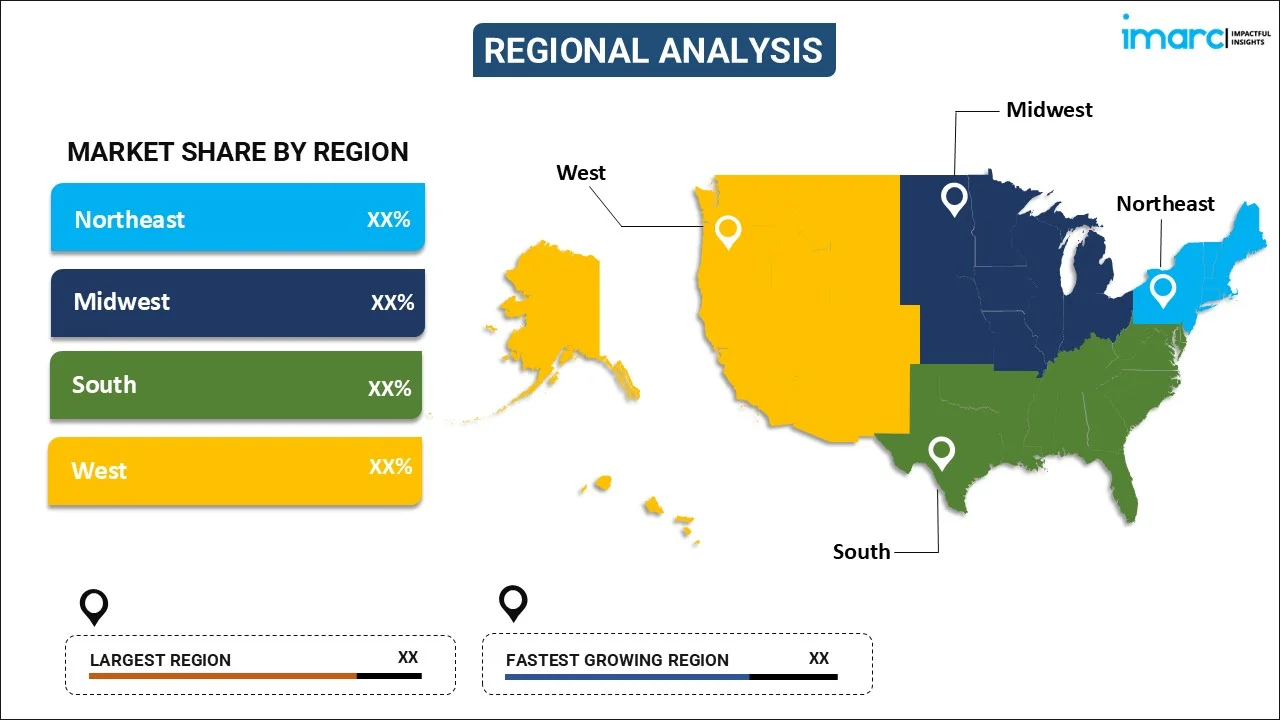
Breakup by Region:
To get detailed regional analysis of this market Request Sample
- Northeast
- Midwest
- South
- West
The report has also provided a comprehensive analysis of all the major regional markets, which include Northeast, Midwest, South, and West.
The Northwest United States soda ash industry is influenced by the escalating demand for soda ash in glass manufacturing, driven by the thriving construction and automotive sectors. Additionally, the increasing awareness of sustainable practices has led to a higher preference for soda ash in eco-friendly applications, such as water treatment and detergent production. The strategic geographical location of the Northwest region, offering access to transportation networks and key markets, further boosts the industry. These factual market drivers collectively shape the landscape of the Northwest United States soda ash industry, positioning it for sustained development and prominence in the market.
On the other hand, the Midwest United States soda ash industry is underpinned by several significant market drivers that play a pivotal role in its growth and dynamism. The rising demand for soda ash in the manufacturing of glass products, especially within the construction and automotive sectors, serves as a primary driver. In confluence with this, the industry benefits from the increasing adoption of soda ash in diverse applications, including detergents, chemicals, and water treatment, driven by its cost-effectiveness and versatile properties. The strategic geographic location of the Midwest region, coupled with well-established transportation networks, contributes to its competitive advantage.
Competitive Landscape:
The key players in the market are actively engaged in various strategies to maintain their competitiveness and capitalize on market trends. Additionally, these companies are focusing on enhancing their production capabilities and optimizing operational efficiencies to meet the growing demand for soda ash in sectors, such as glass manufacturing, detergents, and chemicals. Along with this, they are investing in research and development to innovate new applications and technologies that can expand the utility of soda ash. In addition, manufacturers are also addressing sustainability concerns by adopting eco-friendly practices, including improving energy efficiency and reducing carbon emissions in their production processes. Apart from this, key players are also participating in collaborations and partnerships to leverage synergies and broaden their market reach. Furthermore, customer-centric strategies such as providing tailored solutions and superior customer service contribute to their market positioning.
The competitive landscape of the industry has also been examined along with the profiles of the key players.
United States Soda Ash Market Report Scope:
| Report Features | Details |
|---|---|
| Base Year of the Analysis | 2025 |
| Historical Period | 2020-2025 |
| Forecast Period | 2026-2034 |
| Units | Million Tons |
| Scope of the Report | Exploration of Historical and Forecast Trends, Industry Catalysts and Challenges, Segment-Wise Historical and Predictive Market Assessment:
|
| Applications Covered | Glass, Soaps and Detergents, Chemicals, Metallurgy, Pulp and Paper, Others |
| Regions Covered | Northeast, Midwest, South, West |
| Customization Scope | 10% Free Customization |
| Post-Sale Analyst Support | 10-12 Weeks |
| Delivery Format | PDF and Excel through Email (We can also provide the editable version of the report in PPT/Word format on special request) |
Key Benefits for Stakeholders:
- IMARC’s report offers a comprehensive quantitative analysis of various market segments, historical and current market trends, market forecasts, and dynamics of the United States soda ash market from 2020-2034.
- The research study provides the latest information on the market drivers, challenges, and opportunities in the United States soda ash market.
- Porter's five forces analysis assist stakeholders in assessing the impact of new entrants, competitive rivalry, supplier power, buyer power, and the threat of substitution. It helps stakeholders to analyze the level of competition within the United States soda ash industry and its attractiveness.
- Competitive landscape allows stakeholders to understand their competitive environment and provides an insight into the current positions of key players in the market.
Frequently Asked Questions About the United States Soda Ash Market Report
The United States soda ash market reached a volume of 6.7 Million Tons in 2025.
The rising demand for soda ash in various home detergents and cleaning products, owing to its ability to remove alcohol and grease stain from clothing, is primarily driving the United States soda ash market.
The sudden outbreak of the COVID-19 pandemic had led to the implementation of stringent lockdown regulations across the nation, resulting in the temporary halt in numerous production activities for soda ash.
Based on the application, the United States soda ash market can be bifurcated into glass, soaps and detergents, chemicals, metallurgy, pulp and paper, and others. Currently, glass holds the largest market share.
On a regional level, the market has been classified into Northeast, Midwest, South, and West.
Need more help?
- Speak to our experienced analysts for insights on the current market scenarios.
- Include additional segments and countries to customize the report as per your requirement.
- Gain an unparalleled competitive advantage in your domain by understanding how to utilize the report and positively impacting your operations and revenue.
- For further assistance, please connect with our analysts.
 Request Customization
 Speak to an Analyst
 Request Brochure
 Inquire Before Buying
Benefits of Customization
- Personalize this research
- Triangulate with your data
- Get data as per your format and definition
- Gain a deeper dive into a specific application, geography, customer, or competitor
- Any level of personalization
Get in Touch With Us
UNITED STATES
Phone: +1-201-971-6302
INDIA
Phone: +91-120-433-0800
UNITED KINGDOM
Phone: +44-753-714-6104
Email: [email protected]
Client Testimonials


.webp)


