
Urea Market Size, Share, Trends and Forecast by Grade, Application, End-Use Industry, and Region, 2026-2034
Urea Market 2025, Size Share And Trends
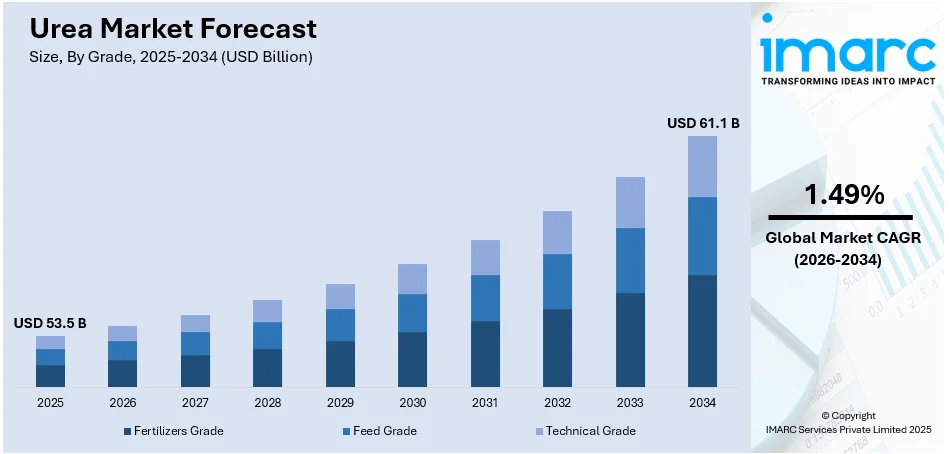
The global urea market size was valued at USD 53.5 Billion in 2025. Looking forward, IMARC Group estimates the market to reach USD 61.1 Billion by 2034, exhibiting a CAGR of 1.49% during 2026-2034. Asia-Pacific currently dominates the market, holding a significant market share of over 45.2% in 2025. The establishment of new urea production facilities and collaborations among industry players, are driving the market growth. The increasing agricultural demand for nitrogen-based fertilizers, growing food demand necessitating higher crop yields, ongoing advancements in urea production technology, steadily increasing product applications across industries, and favorable government policies is further driving the urea market share across the region.
|
Report Attribute
|
Key Statistics
|
|---|---|
|
Base Year
|
2025
|
|
Forecast Years
|
2026-2034
|
|
Historical Years
|
2020-2025
|
|
Market Size in 2025
|
USD 53.5 Billion |
|
Market Forecast in 2034
|
USD 61.1 Billion |
| Market Growth Rate (2026-2034) | 1.49% |
The worldwide urea market is influenced by various crucial elements, mainly the increasing need for fertilizers in agriculture. With the rising demand for food production globally driven by population growth, farmers depend on urea as an essential nitrogen-rich fertilizer to boost crop yields. Moreover, the industrial sector plays a vital role in market expansion, since urea is extensively utilized in making resins, adhesives, and plastics. The growing use of urea in automotive applications, especially in selective catalytic reduction (SCR) systems to lower nitrogen oxide emissions, enhances market demand. Recent innovations in urea production, such as energy-saving manufacturing methods and carbon capture technologies, are impacting market dynamics as well.
To get more information on this market Request Sample
The United States stands out as a key market disruptor, driven by the significant need for fertilizers within the agricultural sector, as farmers depend on urea to improve soil fertility and optimize crop production. The increasing focus on precision agriculture and sustainable farming methods additionally drives its usage. Moreover, the growing use of urea in industrial sectors, including resin and adhesive manufacturing, sustains market expansion. The automotive sector also has an important function, as urea is an essential ingredient in selective catalytic reduction (SCR) systems to comply with strict emissions standards, thereby creating a positive urea market outlook.
Urea Market Trends:
Rising demand for nitrogen-based fertilizers
The global urea market is majorly driven by the increasing demand for nitrogen-based fertilizers in agriculture. According to industry reports, global fertilizer consumption is expected to recover by 4% in 2023, reaching 192.5 Million Metric Tons (mmt), which is an increase from a low in previous years due to high prices. It further projects a 5% increase in 2024, with global nitrogen fertilizer consumption estimated at 108 mmt and production at 109 mmt. Urea is a key source of nitrogen, essential for plant growth and crop yield improvement. With the global population rising, the need for enhanced food production is escalating, leading to greater usage of urea in farming practices. This, in turn, is creating a positive urea market outlook across the globe. For instance, projections from FAO indicate that to feed a global population of 9.1 Billion by 2050, overall food production must increase by approximately 70%. In developing countries, production would need to nearly double to meet this demand. This demand is particularly high in regions with intensive agricultural activities, where maximizing crop output is crucial.
Significant advancements in urea production technology
Technological advancements in urea production have significantly boosted market growth. Innovations such as more efficient production processes, cost-effective methods, and environmentally friendly technologies have made urea manufacturing more viable and sustainable. These advancements not only reduce production costs but also improve the quality and consistency of urea, making it a more attractive option for agricultural and industrial applications, thereby driving urea market growth. For instance, in July 2024, NEXTCHEM, a division of MAIRE, was chosen by Linggu Chemical Co. Ltd. to enhance the energy efficiency of a 3,100 metric tons per day urea plant in China through its subsidiary Stamicarbon. NEXTCHEM will supply the necessary licensing and process design. The project will employ their Advanced MP Flash Design technology, part of the EVOLVE Energy™ series, aiming to reduce the plant's energy consumption by up to 20% by optimizing steam usage and feedstock utilization.
Government policies and support
Supportive government policies and subsidies for agricultural inputs play a crucial role in driving the urea market toward growth. Governments worldwide are implementing policies to promote agricultural productivity and ensure food security. Subsidies for fertilizers, including urea, make them more affordable for farmers, encouraging widespread use. Additionally, regulations supporting the use of nitrogen fertilizers in various regions further stimulate the product demand, as farmers seek to enhance crop yields and maintain soil fertility. For instance, according to industry reports, India plans to stop importing urea by the end of 2025. The government is implementing a two-pronged strategy, reviving closed urea plants and promoting alternative fertilizers like nano liquid urea. Domestic production capacity has increased to 310 Lakh Tons, aiming for 325 Lakh Tons annually. The government's initiatives include substantial subsidies to ensure affordable fertilizers for farmers and efforts to replace conventional urea with nano liquid variants, further propelling the urea market demand.
Urea Industry Segmentation:
IMARC Group provides an analysis of the key trends in each segment of the global urea market, along with forecasts at the global, regional, and country levels from 2026-2034. The market has been categorized based on grade, application, and end-use industry.

Analysis by Grade:
- Fertilizers Grade
- Feed Grade
- Technical Grade
Technical grade stand as the largest component in 2025, holding around 55.0% of the market. The urea market forecast predicts technical grade urea to hold the majority of the market share due to its diverse industrial applications beyond agriculture. It is a key component in the manufacturing of resins, adhesives, and coatings, which are widely used in industries such as automotive, construction, and furniture. Additionally, technical grade urea is crucial in the production of diesel exhaust fluid (DEF), which reduces nitrogen oxide emissions from vehicles, aligning with stringent environmental regulations. Its role in pharmaceuticals, cosmetics, and as a de-icing agent further boosts demand, making it indispensable across multiple sectors and increasing the urea market growth.
For instance, recent data indicates that the annual demand for technical-grade urea for industrial use is approximately 1.3 to 1.4 Million Tons, while domestic production is around 150,000 tons. The manufacturing sector imports only about 200,000 tons, falling significantly short of the required quantity, which exceeds one Million tons.
Analysis by Application:
- Nitrogenous Fertilizer
- Stabilizing Agent
- Keratolyte
- Resin
- Others
Nitrogenous fertilizer leads the market with around 53.8% of market share in 2025. Urea, a highly concentrated nitrogen source, is essential for promoting plant growth and increasing crop yields. Its efficiency, cost-effectiveness, and ease of application make it the preferred choice among farmers worldwide. Additionally, nitrogen is a vital nutrient for photosynthesis and protein synthesis in plants, further driving the demand for urea-based fertilizers. With the growing global population and the consequent need for enhanced agricultural productivity, the reliance on nitrogenous fertilizers, particularly urea, remains strong, ensuring its dominant market share. According to the industry reports, the world currently uses twice the amount of nitrogen fertilizer needed, yet production capacity is projected to increase by 6%, reaching 202 Million Tons by 2027.
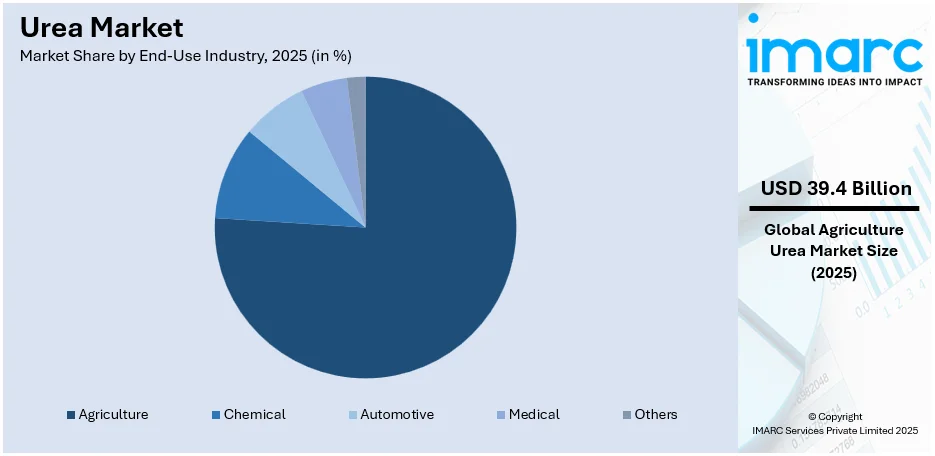
Analysis by End-Use Industry:
Access the comprehensive market breakdown Request Sample
- Agriculture
- Chemical
- Automotive
- Medical
- Others
Agriculture leads the market with around 74.7% of market share in 2025. Agriculture represents the leading urea market segment due to its crucial role as a nitrogen fertilizer, essential for promoting plant growth and increasing crop yields. Urea is widely used in various farming practices because it provides a high concentration of nitrogen, vital for healthy crop development. The growing global population and rising food demand drive the agricultural sector to enhance productivity, increasing urea demand. Additionally, its cost-effectiveness, ease of application, and suitability for diverse crops make urea a preferred choice among farmers, solidifying its market dominance.
For instance, in December 2023, Yara announced the acquisition of Agribios Italiana's organic-based fertilizer business, enhancing Yara's organic strategy in Europe. Agribios, with a market share of 10% in Italy, produces approximately 60,000 metric tons of organic-based fertilizers annually. This action is expected to increase Yara's sales in the organic fertilizer market of Italy and its neighboring countries by about 30% within the next three years.
Regional Analysis:
To get more information on the regional analysis of this market Request Sample
- North America
- United States
- Canada
- Asia Pacific
- China
- Japan
- India
- South Korea
- Australia
- Indonesia
- Others
- Europe
- Germany
- France
- United Kingdom
- Italy
- Spain
- Russia
- Others
- Latin America
- Brazil
- Mexico
- Others
- Middle East and Africa
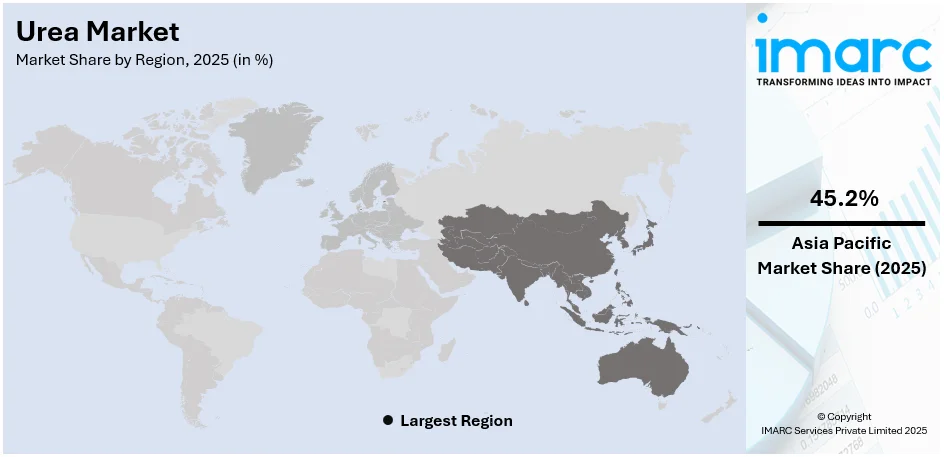
In 2025, Asia-Pacific accounted for the largest market share of over 45.2%. The Asia Pacific region leads the urea market due to several factors. High population density in countries like China and India drives significant demand for food, necessitating increased agricultural productivity. Urea, being a key nitrogen fertilizer, is crucial for enhancing crop yields to meet this demand. According to industry reports, India's domestic urea production increased by 13.4% in 2023, reaching 31.11 Million Tons, up from 27.43 Million Tons in 2022. The country currently operates four fertilizer plants, with plans to open a fifth, Talcher Fertilisers Ltd, in September 2024, which will have an annual production capacity of 3.85 Million Tons. Urea availability in 2023 rose by 3.65%, from 39.71 to 41.16 Million Tons, while sales increased by 3.25%, from 36.91 to 38.11 Million tonnes. This steady growth highlights the significance of domestic production in ensuring urea availability and meeting agricultural demand.
Additionally, government initiatives and subsidies in these countries support urea production and usage, making it more accessible to farmers. The region's rapid industrialization also contributes to the demand for urea in industrial applications. For instance, China's fertilizer industry, one of the largest globally, is undergoing a transformation towards sustainability and efficiency, driven by goals to peak carbon emissions by 2030 and achieve carbon neutrality by 2060. The Belt and Road Initiative (BRI) further supports China's fertilizer industry by expanding access to raw materials and new export markets, aligning with the urea market forecast for increased global trade and supply chain enhancements.
Key Regional Takeaways:
United States Urea Market Analysis
In 2025, the United States accounts for over 84.20% of the urea market in North America. In the United States, the rise in the consumption of urea is primarily driven by the changing chemical industry. According to various reports, total foreign direct investment in the U.S. chemical manufacturing industry totaled USD 766.7 billion in 2023. Since this industry is still growing rapidly, the requirement for urea, which serves as a primary feedstock for many chemical reactions, has gone up significantly. The rising demand for urea in the chemical industry for the production of fertilizers, resins, plastics, and various other products has led to its increased utilization. Additionally, improvements in chemical production technologies, coupled with an increased focus on sustainability and environmentally friendly practices, are promoting a broader use of urea in the sector. The growth of sectors like agrochemicals, plastics, and pharmaceuticals is anticipated to keep fueling urea demand, thereby enhancing its use in the United States.
Asia Pacific Urea Market Analysis
In the Asia-Pacific area, the increasing use of urea is associated with higher investments in agriculture. The agricultural industry in this area has been seeing considerable expansion, driven by a rising need for food production to cater to a swiftly increasing population. For example, in 2020, the Indian government plans to allocate around USD 4.32 Million to 346 agritech startups, with the goal of enhancing the agricultural sector's development. Urea, as an essential fertilizer, is crucial for boosting crop yields and increasing agricultural efficiency. The growth in agricultural investments, especially in nations prioritizing the modernization of farming techniques and the extension of arable land, has heightened the need for urea. Additionally, government incentives and agricultural subsidies in certain regions stimulate urea usage, fostering its integration into farming methods. Consequently, urea demand is expected to increase steadily in this area.
Europe Urea Market Analysis
In Europe, the increasing use of urea is primarily fueled by the expanding industrial sector, especially because of the advancement of the automotive industry. As the number of vehicles owned continues to rise, the necessity for urea as an essential element for reducing vehicle emissions is also expanding. The International Council on Clean Transportation reports that approximately 10.6 million new vehicles were registered in the 27 Member States in 2023, which is a 14% increase from 2022. Urea is widely utilized in Selective Catalytic Reduction (SCR) systems to decrease nitrogen oxide emissions from diesel engines, which is essential for complying with strict environmental regulations. As vehicle ownership increases, especially in urban regions, the use of urea in automotive emissions control systems is expected to keep growing. Moreover, the rising industrial need for urea in sectors like pharmaceuticals and manufacturing also enhances its usage in the area.
Latin America Urea Market Analysis
In Latin America, the rising use of urea is fueled by a boost in agricultural output. The Food and Agriculture Organization of the United Nations (FAO) reports that Brazil’s crop production hit a record 308 million metric tons in 2021. With the agricultural sector growing to fulfill domestic needs and export requirements, the need for urea, an essential fertilizer, increases. Urea plays a crucial role in boosting crop production, and its contribution to increasing soil fertility fosters the overall agricultural development of the region. As farming methods improve and emphasis is placed on enhancing productivity, there is an increasing demand for urea-based fertilizers to maximize agricultural yields. This need is additionally driven by governmental backing and strategies designed to enhance agricultural productivity.
Middle East and Africa Urea Market Analysis
In the Middle East and Africa, the increasing use of urea is driven by the flourishing construction industry. Reports indicate that Saudi Arabia's construction industry is thriving, featuring more than 5,200 active projects with a total value of USD 819 billion. With substantial infrastructure development underway in the region, including major construction initiatives, the need for urea has increased. Urea is utilized in multiple industrial applications, including the creation of resins, which are vital in the construction and building materials industry. The swift expansion of the construction sector, along with the necessity for higher-quality building materials, has increased the demand for urea. With construction continuing to flourish in this area, urea usage is anticipated to increase, fueled by its use in materials and products for infrastructure initiatives.
Competitive Landscape:
Major participants in the urea market are adopting different strategies to enhance their market stance and promote growth. Large corporations such as CF Industries, Nutrien, and Yara International are putting money into increasing production capabilities to satisfy growing demand, especially in agricultural and industrial sectors. Numerous players are concentrating on technological innovations, including energy-saving urea manufacturing methods and carbon capture technologies, to improve sustainability and lessen environmental effects. Strategic mergers, acquisitions, and collaborations are assisting companies in enhancing their supply chains and optimizing distribution networks.
The report provides a comprehensive analysis of the competitive landscape in the urea market with detailed profiles of all major companies, including:
- Acron Group
- BASF SE
- BIP (Oldbury) Limited
- EuroChem
- Jiangsu Sanmu Group Co. Ltd.
- Koch Fertilizer LLC
- OCI N.V
- Petrobras
- Qatar Fertiliser Company
- SABIC
- Yara International ASA
Latest News and Developments:
- November 2024: National Fertilizers (NFL) will begin manufacturing nano liquid urea at its Nangal plant, producing 1.5 lakh 500ml bottles daily. The new variant utilizes advanced nano technology for more efficient nutrient uptake and slower nitrogen release. NFL is conducting field research to assess its effectiveness and market acceptance.
- August 2024: Yara International ASA declared strategic divestitures from its fertilizer import and distribution operations in Ivory Coast, concentrating more on expanding African markets. The move will help Yara strengthen its position in regions where urea demand is increasing, aligning with their growth strategy for urea-based products.
- June 2024: Yara Brasil Fertilizantes S.A. and Petrobras established a nonbinding Master Agreement to investigate synergy prospects in the Brazilian fertilizer sector. The collaboration will aim to enhance efficiency in urea production, with decarbonization measures considered to reduce the carbon footprint of urea fertilizers.
- July 2024: BASF SE and ENGIE established a collaboration to utilize sustainable biomethane at their locations in Ludwigshafen and Antwerp. The initiative is designed to reduce emissions associated with chemical production, including the production of urea-based fertilizers, as part of efforts to meet sustainability goals.
- February 2024: Helwan, an Egyptian urea manufacturer, has entered into an agreement with SML-INNO UK to create 130,000 tons annually of black urea. The product is expected to boost crop development while requiring 25-30% less nitrogen compared to traditional urea. The initiative, aimed at European and UK markets, is anticipated to require USD 5 Million. Helwan also runs a granular urea facility with a capacity of 635,000 tons annually.
- February 2024: India introduced a USD 2 Billion nitrogenous fertilizer subsidy scheme aimed at ensuring affordable urea for farmers. The initiative focuses on improving nutrient efficiency through advancements in slow-release urea formulations. This move seeks to boost agricultural productivity while minimizing environmental impact.
Urea Market Report Scope:
| Report Features | Details |
|---|---|
| Base Year of the Analysis | 2025 |
| Historical Period | 2020-2025 |
| Forecast Period | 2026-2034 |
| Units | Billion USD |
| Scope of the Report |
Exploration of Historical Trends and Market Outlook, Industry Catalysts and Challenges, Segment-Wise Historical and Future Market Assessment:
|
| Grades Covered | Fertilizers Grade, Feed Grade, Technical Grade |
| Applications Covered | Nitrogenous Fertilizer, Stabilizing Agent, Keratolyte, Resin, Others |
| End-Use Industries Covered | Agriculture, Chemical, Automotive, Medical, Others |
| Regions Covered | Asia Pacific, Europe, North America, Latin America, Middle East and Africa |
| Countries Covered | United States, Canada, Germany, France, United Kingdom, Italy, Spain, Russia, China, Japan, India, South Korea, Australia, Indonesia, Brazil, Mexico |
| Companies Covered | Acron Group, BASF SE, BIP (Oldbury) Limited, EuroChem, Jiangsu Sanmu Group Co. Ltd., Koch Fertilizer LLC, OCI N.V, Petrobras, Qatar Fertiliser Company, SABIC, Yara International ASA, etc. |
| Customization Scope | 10% Free Customization |
| Post-Sale Analyst Support | 10-12 Weeks |
| Delivery Format | PDF and Excel through Email (We can also provide the editable version of the report in PPT/Word format on special request) |
Key Benefits for Stakeholders:
- IMARC’s report offers a comprehensive quantitative analysis of various market segments, historical and current market trends, market forecasts, and dynamics of the urea market from 2020-2034.
- The urea market research report provides the latest information on the market drivers, challenges, and opportunities in the global market.
- The study maps the leading, as well as the fastest-growing, regional markets. It further enables stakeholders to identify the key country-level markets within each region.
- Porter's five forces analysis assist stakeholders in assessing the impact of new entrants, competitive rivalry, supplier power, buyer power, and the threat of substitution. It helps stakeholders to analyze the level of competition within the urea industry and its attractiveness.
- Competitive landscape allows stakeholders to understand their competitive environment and provides an insight into the current positions of key players in the market.
Frequently Asked Questions About the Urea Market Report
The urea market was valued at USD 53.5 Billion in 2025.
The urea market is projected to exhibit a CAGR of 1.49% during 2026-2034, reaching a value of USD 61.1 Billion by 2034.
The urea market is driven by increasing demand for fertilizers in agriculture, rising industrial applications, growing use in automotive emissions control, technological advancements in production, and supportive government policies promoting sustainable farming and environmental regulations.
Asia Pacific currently dominates the urea market, accounting for a share of 45.2%. The market is driven by rising agricultural demand due to population growth, increasing industrial applications, government support for food security, expanding infrastructure projects, and the region’s strong fertilizer manufacturing base.
Some of the major players in the urea market include Acron Group, BASF SE, BIP (Oldbury) Limited, EuroChem, Jiangsu Sanmu Group Co. Ltd., Koch Fertilizer LLC, OCI N.V, Petrobras, Qatar Fertiliser Company, SABIC, Yara International ASA, etc.
Need more help?
- Speak to our experienced analysts for insights on the current market scenarios.
- Include additional segments and countries to customize the report as per your requirement.
- Gain an unparalleled competitive advantage in your domain by understanding how to utilize the report and positively impacting your operations and revenue.
- For further assistance, please connect with our analysts.
 Request Customization
 Speak to an Analyst
 Request Brochure
 Inquire Before Buying
Benefits of Customization
- Personalize this research
- Triangulate with your data
- Get data as per your format and definition
- Gain a deeper dive into a specific application, geography, customer, or competitor
- Any level of personalization
Get in Touch With Us
UNITED STATES
Phone: +1-201-971-6302
INDIA
Phone: +91-120-433-0800
UNITED KINGDOM
Phone: +44-753-714-6104
Email: [email protected]
Client Testimonials


.webp)


