
US Children’s Entertainment Centers Market Size, Share, Trends and Forecast by Visitor Demographics, Facility Size, Revenue Source, Activity Area, and Region, 2026-2034
US Children's Entertainment Centers Market Summary:
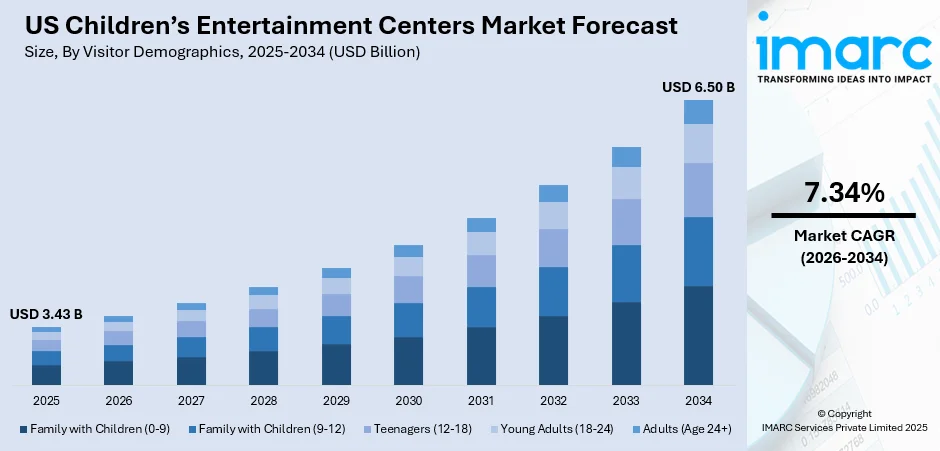
The US children's entertainment centers market size was valued at USD 3.43 Billion in 2025 and is projected to reach USD 6.50 Billion by 2034, growing at a compound annual growth rate of 7.34% during 2026-2034.
The US children's entertainment centers market is experiencing robust expansion as families increasingly prioritize interactive recreational activities that combine entertainment with developmental benefits. Rising household disposable incomes and growing urbanization are enabling greater spending on indoor entertainment destinations offering diverse attractions. Technological advancements in augmented reality and virtual reality gaming zones are enhancing visitor experiences and driving repeat visits. The integration of educational elements within play environments appeals to parents seeking enriching experiences for their children. Strategic industry consolidation and facility renovations are strengthening market competitiveness, positioning key operators to capture greater US children's entertainment centers market share.
Key Takeaways and Insights:
- By Visitor Demographics: Family with children (0-9) dominated the market with approximately 45% revenue share in 2025, driven by the significant demand for safe, age-appropriate play environments that foster early childhood development and social interaction among younger children.
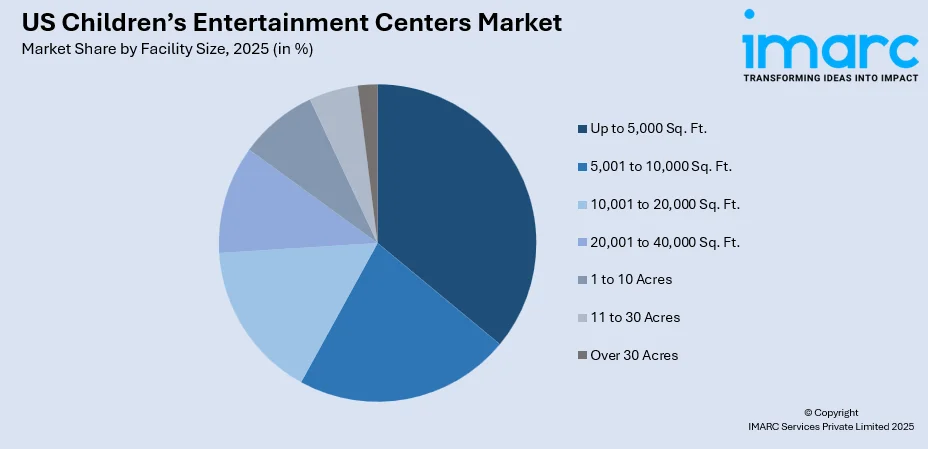
- By Facility Size: Up to 5,000 Sq. Ft. segment leads the market with a revenue share of 28% in 2025, owing to the growing popularity of compact entertainment venues in urban shopping centers and neighborhood locations offering accessible family entertainment.
- By Revenue Source: Entry fees and ticket sales dominated for the largest revenue share of approximately 46% in 2025. This dominance is driven by the primary business model of entertainment centers charging admission for access to attractions, games, and play zones.
- By Activity Area: Physical play activities leads the largest share at 34% in 2025, reflecting strong consumer preference for active entertainment options including climbing structures, trampolines, obstacle courses, and soft play areas that promote physical fitness among children.
- Key Players: The US children's entertainment centers market exhibits a moderately competitive landscape, with established operators expanding their footprints through strategic acquisitions, facility renovations, and the introduction of innovative attractions to strengthen brand presence and enhance customer engagement across diverse demographic segments.
To get more information on this market Request Sample
The US children's entertainment centers market is advancing as operators embrace technological innovations and experiential offerings to attract multigenerational visitors. Indoor entertainment facilities are increasingly incorporating immersive technologies such as virtual reality gaming zones and augmented reality-enhanced attractions to differentiate their offerings. The emphasis on STEAM-based educational entertainment is gaining momentum, exemplified by the June 2024 opening of Planet Playskool at Westfield Garden State Plaza in Paramus, New Jersey, a 20,000 square-foot interactive play destination featuring branded experiences from major toy manufacturers. Physical play activities remain paramount as health-conscious parents seek venues promoting active lifestyles. Birthday party hosting and group event bookings continue driving consistent traffic, while membership programs and loyalty initiatives are strengthening customer retention across the competitive landscape.
US Children's Entertainment Centers Market Trends:
Integration of Immersive AR and VR Technologies
Entertainment centers are increasingly adopting virtual reality gaming zones and augmented reality-enhanced attractions to deliver multi-sensory experiences that captivate visitors of all ages. Industry research indicates that many family entertainment centers are increasingly integrating VR attractions to enhance customer engagement and stand out from competitors. These technology-driven offerings provide immersive adventures impossible to replicate at home, driving repeat visits and supporting the growth of the US children's entertainment centers market. For instance, in July 2025, CBS Texas unveiled an advanced augmented and virtual reality studio, distinguishing itself as the sole broadcaster in the region to implement this cutting-edge technology.
Expansion of Active Play Zones and Adventure Attractions
Operators are moving beyond traditional arcade settings to integrate high-energy physical attractions that appeal to older children and teenagers. In November 2024, a major entertainment chain unveiled Adventure Zones, combining trampoline areas with ninja-style obstacle courses featuring climbing walls, balance beams, and interactive challenges. This concept is scheduled for rollout to more than 250 locations in 2025, emphasizing the industry shift toward active entertainment that promotes physical fitness while maintaining engaging play experiences.
Rise of STEAM-Based Educational Entertainment Concepts
Entertainment centers are increasingly blending educational elements with recreational activities to appeal to parents prioritizing developmental benefits. Science, technology, engineering, arts, and mathematics-focused attractions encourage critical thinking and creativity through hands-on play. This edutainment approach combines learning with entertainment, enabling children to explore real-world concepts through interactive exhibits, construction-based activities, and imaginative play zones that support cognitive and social development. For instance, in November 2025, Electronic Arts partnered with Ukie’s Digital Schoolhouse, introduced play-based learning programs designed to help young people unlock their potential and prepare for future career opportunities. Electronic Arts is strengthening its commitment to youth skills development by advancing the role of play in education. The company notes that play fosters creativity, builds confidence, and equips students with essential STEAM abilities, including problem-solving, collaboration, and design thinking.
Market Outlook 2026-2034:
The US children's entertainment centers market is positioned for sustained expansion throughout the forecast period, driven by continued urbanization, rising household incomes, and evolving consumer preferences favoring experiential spending over material purchases. Technology integration will remain central to market development as operators deploy increasingly sophisticated gaming platforms and interactive attractions. The consolidation trend is expected to continue as larger operators acquire regional facilities to expand geographic footprint and operational scale. The market generated a revenue of USD 3.43 Billion in 2025 and is projected to reach a revenue of USD 6.50 Billion by 2034, growing at a compound annual growth rate of 7.34% from 2026-2034.
US Children's Entertainment Centers Market Report Segmentation:
| Segment Category | Leading Segment | Market Share |
|---|---|---|
| Visitor Demographics | Families with Children (0-9) | 45% |
| Facility Size | Up to 5,000 Sq. Ft. | 28% |
| Revenue Source | Entry Fees and Ticket Sales | 46% |
| Activity Area | Physical Play Activities | 34% |
Visitor Demographics Insights:
- Family with Children (0-9)
- Family with Children (9-12)
- Teenagers (12-18)
- Young Adults (18-24)
- Adults (Age 24+)
Family with children (0-9) dominates the US children's entertainment centers market with 45% share, establishing itself as the leading visitor demographic segment in 2025.
Families with children aged 0–9 form the core audience for US children’s entertainment centers, largely because these venues are specifically designed to meet the developmental, recreational, and social needs of younger kids. Attractions such as soft-play zones, themed activity areas, and learning-based play environments strongly appeal to this age group. Parents also prioritize safe, interactive spaces where younger children can explore, socialize, and engage in physical activity, making this demographic the most frequent visitor segment.
This demographic dominance is reinforced by the spending patterns of parents who actively seek out engaging, family-friendly outings for early childhood enrichment. Entertainment centers often market heavily toward this group through birthday packages, seasonal events, and educational play offerings, further increasing visitation. Additionally, younger children typically require more indoor recreational options, especially in urban areas, prompting families to return regularly. These factors collectively position families with children aged 0–9 as the primary drivers of market activity.
Facility Size Insights:
Access the Comprehensive Market Breakdown Request Sample
- Up to 5,000 Sq. Ft.
- 5,001 to 10,000 Sq. Ft.
- 10,001 to 20,000 Sq. Ft.
- 20,001 to 40,000 Sq. Ft.
- 1 to 10 Acres
- 11 to 30 Acres
- Over 30 Acres
Up to 5,000 Sq. Ft. segment leads the US children's entertainment centers market, holding the largest share at 28% in 2025.
The up to 5,000 sq. ft. segment leads the US Children’s Entertainment Centers market because it offers an ideal balance of affordability, operational efficiency, and space optimization. These centers typically suit urban and suburban locations where real estate costs are high, making compact formats more financially viable. Operators can include key attractions such as soft play zones, arcade games, and birthday-party areas without requiring large capital investments, helping them attract families and maintain steady foot traffic.
Another factor driving the dominance of the up to 5,000 sq. ft. segment is its flexibility in adapting to shifting consumer preferences. Smaller centers can refresh layouts, rotate activities, and introduce themed zones more frequently, keeping the experience engaging for repeat visitors. They also require fewer staff and lower utility costs, making them easier to run sustainably. This format caters well to community-focused entertainment needs, enabling operators to achieve strong returns while offering accessible play options.
Revenue Source Insights:
- Entry Fees and Ticket Sales
- Food and Beverages
- Merchandising
- Advertising
- Others
Entry fees and ticket sales accounts for the highest revenue across the US children's entertainment centers market, representing 46% of market share in 2025.
Entry fees and ticket sales form the core revenue source for children’s entertainment centers, as the business model is built around charging admission for access to various attractions and play zones. This category includes general entry tickets, timed play passes, and fees for specific activities. To strengthen value perception and encourage repeat visits, many centers are adopting tiered pricing systems that feature unlimited play options and membership plans tailored to different family needs.
Operators are also refining their pricing strategies to capture additional revenue from group events, particularly birthday celebrations. The rollout of affordable birthday party packages by major brands illustrates a targeted effort to attract families seeking convenient, budget-friendly experiences. These packages not only boost booking volumes but also increase overall foot traffic, supporting food, merchandise, and add-on sales. By maintaining accessible price points, centers effectively balance profitability with broad customer appeal, reinforcing steady demand.
Activity Area Insights:
- Arcade Studios
- AR and VR Gaming Zone
- Physical Play Activities
- Skill/Competition Games
- Others
Physical play activities leads the US children's entertainment centers market, dominating the largest share at 34% in 2025.
Physical play activities dominate the activity area mix as parents favor entertainment options that encourage movement, coordination, and overall physical development. This category includes climbing structures, trampolines, obstacle courses, soft play environments, and other interactive attractions designed to keep children active. With families increasingly avoiding passive, screen-based entertainment, demand continues to grow for venues that offer high-energy, skill-building experiences across a wide range of age groups and developmental needs.
This shift is reinforced by new market developments, including an October 2024 announcement from a leading operator unveiling a major Slide Zone renovation featuring competitive racing slides, half-pipe drops, and airtime launch elements that maximize physical engagement. The rising popularity of adventure zones that blend trampolines with ninja-style obstacles further illustrates the growing appetite for challenging, high-intensity physical experiences that appeal to older children and mixed-age groups, extending beyond traditional soft play offerings.
Regional Insights:
- Northeast
- Midwest
- South
- West
The Northeast sees strong demand for children’s entertainment centers due to dense urban populations and high disposable incomes. Families seek convenient, safe indoor play options for children, especially in areas with limited outdoor recreation space. The region’s focus on education and enrichment activities also encourages centers to offer interactive, STEM-based, and themed play experiences, helping operators attract repeat visits and build a loyal customer base.
In the Midwest, the CEC market benefits from growing suburban communities and family-focused lifestyles. Centers are increasingly popular as safe, accessible destinations for recreation, birthday parties, and social interaction. Affordable real estate and community-oriented development allow operators to establish centers with diverse attractions, from arcade games to soft play zones, while catering to families looking for year-round indoor entertainment in areas with seasonal weather variations.
The Southern market is driven by rapid population growth, particularly among young families, and strong consumer spending on family entertainment. CECs in this region capitalize on demand for recreational and educational experiences that combine fun with skill development. The expansion of suburban housing and shopping complexes provides strategic locations for centers, while operators leverage themed attractions, party packages, and membership programs to attract loyal, repeat customers.
In the West, high-income urban and suburban populations support robust demand for innovative and experiential children’s entertainment centers. Families are drawn to centers offering interactive, technology-enhanced play, including VR/AR experiences and STEM-based learning zones. Strong tourism activity in coastal cities also contributes to foot traffic, while centers emphasize safety, premium amenities, and creative programming to meet the expectations of affluent parents seeking quality entertainment and enrichment for their children.
Market Dynamics:
Growth Drivers:
Why is the US Children's Entertainment Centers Market Growing?
Rising Disposable Income and Family Entertainment Spending
Increasing household disposable incomes across the United States are enabling families to allocate greater portions of their budgets toward recreational activities and entertainment experiences for their children. In 2024, the per capita disposable personal income in the US climbed to an all-time high of $64,423, reflecting an annual growth rate of 2.9%. The nation’s total disposable personal income reached around $21,917.657 billion. Monthly trends indicated steady gains, with increases of 0.6% in January followed by a 0.5% rise in March, highlighting continued growth in household spending capacity throughout the early part of the year. Economic prosperity supports discretionary spending on leisure destinations that provide quality family bonding opportunities. Industry data from the International Association of Amusement Parks and Attractions indicates that North American families typically visit family entertainment centers between three and five times annually, with average per-visit spending ranging from twelve to twenty-two dollars, depending on attraction offerings. This consistent visitation frequency demonstrates sustained demand for accessible entertainment options that deliver value for family budgets while providing engaging experiences for children of various ages.
Industry Consolidation and Strategic Facility Expansion
Major operators are accelerating market expansion through strategic acquisitions of established regional entertainment brands, strengthening competitive positioning and geographic reach. In May 2023, Five Star Parks and Attractions completed the acquisition of Scene75 Entertainment, adding five award-winning locations across Ohio and Illinois to expand its portfolio to twenty-five family entertainment centers in twelve states. Recent renovation efforts highlight a strong commitment to modernizing facilities, including the introduction of expanded play zones with multiple large slides and interactive sports areas at key locations. These upgrades help streamline operations, strengthen brand presence, and diversify the range of attractions, making centers more appealing to a wider variety of customers and enhancing the overall visitor experience.
Growing Emphasis on Experiential and Interactive Entertainment
Consumer preferences are increasingly favoring experiential entertainment that creates memorable and shareable moments over passive forms of recreation. For instance, in September 2023, Amazon launched a virtual shopping experience allowing fans to purchase merchandise from Prime Video shows. For Gen V, viewers can explore Godolkin University through an immersive Virtual Campus Tour and Store, creating interactive, culturally rich experiences that deepen engagement with the series. Families are seeking destinations that combine interactive attractions, immersive environments, and educational elements, providing meaningful value for their time and spending.
Market Restraints:
What Challenges the US Children's Entertainment Centers Market is Facing?
High Operational and Maintenance Costs
Entertainment center operators face substantial ongoing expenses related to staffing, equipment maintenance, and facility upkeep that impact profitability. Industry surveys indicate that fifty-nine percent of operators report high operational costs as a significant barrier to expanding entertainment offerings. Regular investment in attraction upgrades, safety compliance, and skilled personnel requirements contribute to elevated overhead that smaller operators may struggle to sustain competitively.
Competition from Digital Home Entertainment
The proliferation of mobile gaming applications, home video game consoles, and streaming entertainment platforms creates alternative entertainment options that compete for children's attention and family leisure time. Parents may perceive home-based digital entertainment as more convenient and cost-effective compared to venue-based experiences requiring travel and admission fees. This competition challenges entertainment centers to continuously innovate and deliver experiences impossible to replicate in home settings.
Customer Retention and Pricing Pressures
Entertainment centers encounter challenges in attracting repeat visitors due to limited ability to rapidly update and refresh attraction offerings. The considerable capital investment required for introducing new rides and experiences constrains frequency of venue enhancements. Additionally, ticket price escalation influenced by economic factors and operational cost increases may dampen demand among budget-conscious families, particularly affecting middle-income demographics sensitive to discretionary spending allocations.
Competitive Landscape:
The US children's entertainment centers market exhibits a moderately fragmented competitive structure characterized by national chain operators, regional brands, and independent facilities serving local communities. Major operators are pursuing growth through strategic acquisitions, facility modernization, and technology integration to strengthen market positioning. Competition intensifies as brands differentiate through themed environments, exclusive branded partnerships, and innovative attraction offerings. Operators are implementing membership programs and loyalty initiatives to enhance customer retention and drive repeat visitation. Investment in facility renovations and expansion of physical play attractions demonstrates a commitment to delivering engaging experiences that justify premium pricing while maintaining accessibility for family budgets.
Recent Developments:
- March 2025: CEC Entertainment, the parent company of a major entertainment chain, announced expansion plans for fiscal 2025 following the completion of its remodel program that reimagined more than 450 locations across the United States. The company plans to open six to eight new entertainment centers including corporate locations in Florida and California, while rolling out Adventure Zones combining trampoline areas and obstacle courses to more than 250 locations nationwide.
- October 2024: Five Star Parks unveiled major renovations at its Scene75 Chicagoland location in Romeoville, Illinois, debuting a fifteen thousand square foot Slide Zone featuring three mega-slides including Turbo Racer four-lane competitive racing, Half Pipe with steep drop experiences, and Mega-Launch high-speed slides with airtime. The renovation also introduced a five thousand square foot Play Scene soft play structure and interactive sports courts.
US Children’s Entertainment Centers Market Report Coverage:
| Report Features | Details |
|---|---|
| Base Year of the Analysis | 2025 |
| Historical Period | 2020-2025 |
| Forecast Period | 2026-2034 |
| Units | Billion USD |
| Scope of the Report |
Exploration of Historical Trends and Market Outlook, Industry Catalysts and Challenges, Segment-Wise Historical and Future Market Assessment:
|
| Visitor Demographics Covered | Family With Children (0-9), Family With Children (9-12), Teenagers (12-18), Young Adults (18-24), Adults (Age 24+) |
| Facility Sizes Covered | Up to 5,000 Sq. Ft., 5,001 to 10,000 Sq. Ft., 10,001 to 20,000 Sq. Ft., 20,001 to 40,000 Sq. Ft., 1 to 10 Acres, 11 to 30 Acres, Over 30 Acres |
| Revenue Sources Covered | Entry Fees and Ticket Sales, Food and Beverages, Merchandising, Advertising, Others |
| Activity Areas Covered | Arcade Studios, AR and VR Gaming Zone, Physical Play Activities, Skill/Competition Games, Others |
| Regions Covered | Northeast, Midwest, South, West |
| Customization Scope | 10% Free Customization |
| Post-Sale Analyst Support | 10-12 Weeks |
| Delivery Format | PDF and Excel through Email (We can also provide the editable version of the report in PPT/Word format on special request) |
Key Questions Answered in This Report
The US children's entertainment centers market size was valued at USD 3.43 Billion in 2025.
The US children's entertainment centers market is expected to grow at a compound annual growth rate of 7.34% during 2026-2034 to reach USD 6.50 Billion by 2034.
Physical play activities leads the largest share at 34%, driven by growing parental preference for active entertainment options that promote physical fitness and development among children through climbing structures, trampolines, and interactive movement-based attractions.
Key factors driving the US children's entertainment centers market include rising disposable incomes, growing demand for experiential family entertainment, strategic industry consolidation, technological advancements in AR and VR attractions, and increasing emphasis on educational entertainment concepts.
Major challenges include high operational and maintenance costs, competition from digital home entertainment options, customer retention difficulties, pricing pressures affecting budget-conscious families, and capital constraints limiting attraction refresh frequency.
Need more help?
- Speak to our experienced analysts for insights on the current market scenarios.
- Include additional segments and countries to customize the report as per your requirement.
- Gain an unparalleled competitive advantage in your domain by understanding how to utilize the report and positively impacting your operations and revenue.
- For further assistance, please connect with our analysts.
 Request Customization
 Speak to an Analyst
 Request Brochure
 Inquire Before Buying
Benefits of Customization
- Personalize this research
- Triangulate with your data
- Get data as per your format and definition
- Gain a deeper dive into a specific application, geography, customer, or competitor
- Any level of personalization
Get in Touch With Us
UNITED STATES
Phone: +1-201-971-6302
INDIA
Phone: +91-120-433-0800
UNITED KINGDOM
Phone: +44-753-714-6104
Email: sales@imarcgroup.com
Client Testimonials


.webp)


