
US Food Service Market Size, Share, Trends and Forecast by Sector, System, Type of Restaurant, and Region 2026-2034
US Food Service Market Size, Share, Trends & Forecast (2026-2034)
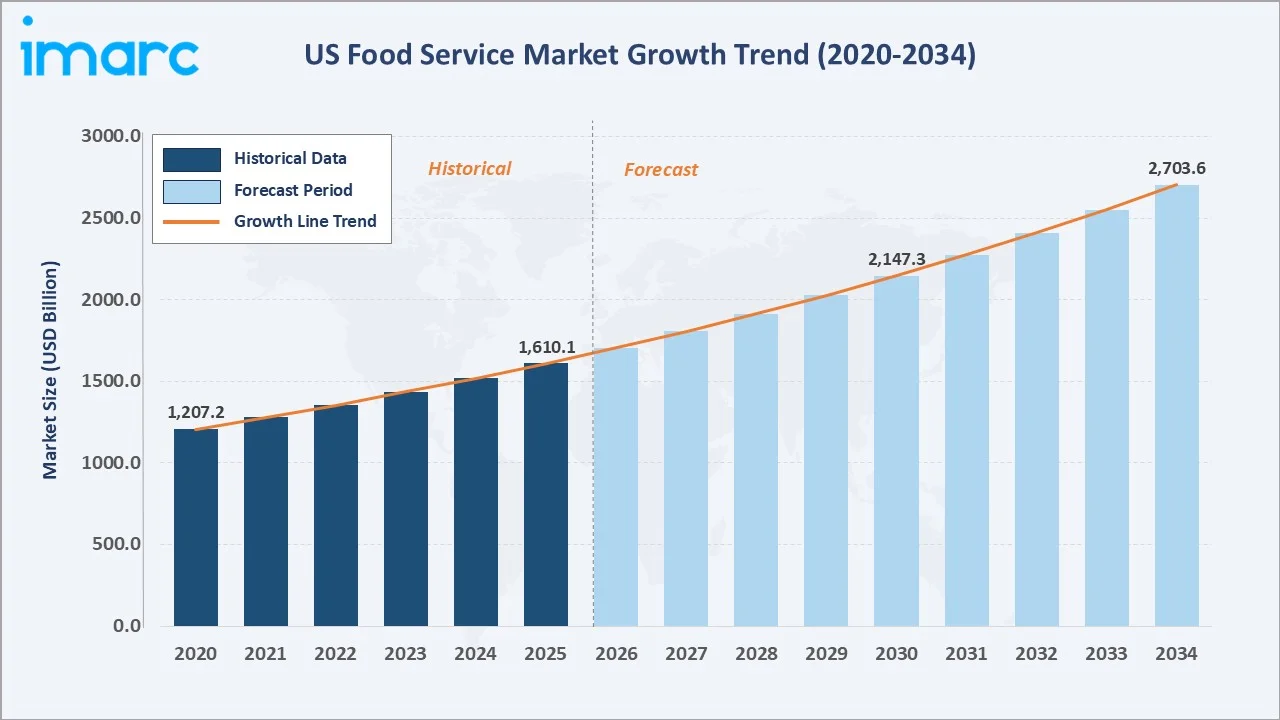
The US food service market size reached USD 1,610.1 Billion in 2025 and is projected to reach USD 2,703.6 Billion by 2034, exhibiting a CAGR of 5.93% during the forecast period 2026-2034. Rising urbanization, growing consumer preference for convenient dining, widespread adoption of digital ordering platforms, and expanding delivery and takeout services are the primary drivers of US food service market growth. The commercial sector leads with an 80% share in 2025, while fast food restaurants account for 45% of total revenue. The South region dominates with a 32% share, supported by high population density, strong tourism, and a well-established dining culture.
Market Snapshot
|
Metric |
Value |
|
Market Size (2025) |
USD 1,610.1 Billion |
|
Forecast Market Size (2034) |
USD 2,703.6 Billion |
|
CAGR (2026-2034) |
5.93% |
|
Base Year |
2025 |
|
Historical Period |
2020-2025 |
|
Forecast Period |
2026-2034 |
|
Largest Region |
South (32% share, 2025) |
|
Fastest Growing Region |
South (CAGR ~6.30%) |
|
Leading Sector |
Commercial (80% share, 2025) |
|
Leading Restaurant Type |
Fast Food Restaurants (45% share, 2025) |
To get more information on this market, Request Sample
The US food service market growth trajectory from 2020 through 2034, contrasting a consistent historical expansion base against a sustained forecast curve driven by rising urbanization, digital ordering adoption, and expanding delivery channel penetration.
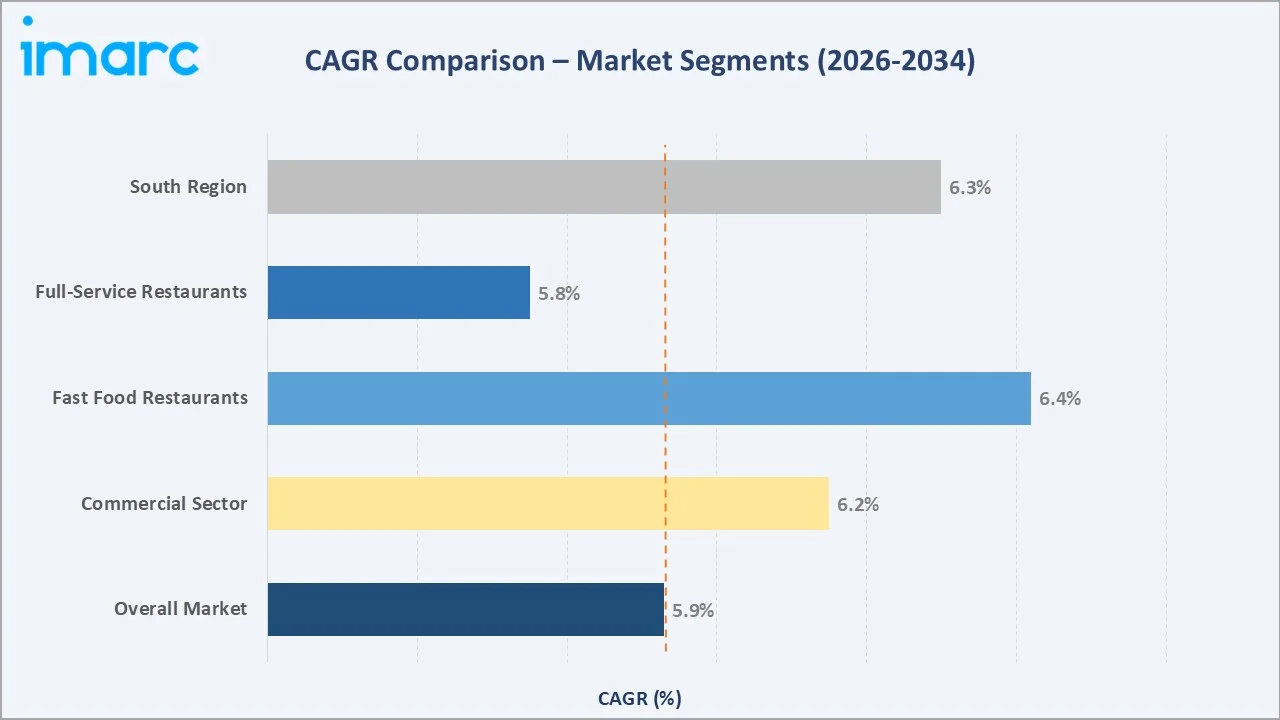
Segment-level CAGR comparisons highlighting fast food restaurants and the South region as the two fastest-growing sub-categories within the US food service industry analysis through 2034.
Executive Summary
The US food service market is one of the largest and most dynamic consumer-facing industries in the country. Valued at USD 1,610.1 Billion in 2025, the market is set to surpass USD 2,703.6 Billion by 2034, growing at a CAGR of 5.93% during 2026-2034.
Commercial establishments, encompassing fast food chains, full-service restaurants, cafes, and catering companies, account for 80% of total market revenue in 2025. Fast food restaurants alone hold a 45% share, reflecting robust consumer demand for affordability, speed, and convenience. Full-service restaurants at 28% continue to capture premium dining demand, supported by experiential consumption trends and food tourism. Limited service restaurants at 18% serve a hybrid audience seeking quality above fast food at accessible price points. The South region commands a 32% share, driven by a dense hospitality ecosystem and high tourism activity in states such as Texas, Florida, and Georgia.
Strategic investments in sustainability, ghost kitchens, and health-focused menus are defining the next wave of growth. Major operators, including McDonald's, Yum! Brands Inc., Starbucks Coffee Company, and Darden Restaurants Inc. continue to shape competitive dynamics through aggressive menu innovation, geographic expansion, and supply chain optimization.
Key Market Insights
|
Insight |
Data |
|
Largest Sector |
Commercial - 80% share (2025) |
|
Leading Restaurant Type |
Fast Food Restaurants - 45% share (2025) |
|
Leading Region |
South - 32% revenue share (2025) |
|
Second Region |
West - 26% revenue share (2025) |
|
Top Companies |
McDonald's, Yum! Brands Inc., Starbucks Coffee Company, Darden Restaurants Inc. |
Key Analytical Observations Supporting The Above Data:
- Commercial sector's 80% dominance in 2025 is underpinned by the US hosting over 1 million food service locations, with national QSR and casual dining chains generating the majority of total commercial segment revenues.
- Fast food restaurants hold a 45% share driven by value pricing, digital ordering, drive-through convenience, and loyalty programs that retain broad consumer bases across all income demographics.
- Full-service restaurants at 28% in 2025 benefit from rising experiential dining trends, with consumers increasingly seeking curated occasion-based experiences that cannot be replicated through delivery or takeout formats.
- The South region's 32% leadership reflects the highest concentration of food service locations relative to population in the US, supported by strong domestic tourism to Florida and Texas and rapid population inflows from northern states.
- Non-commercial food service at 20% is expanding as healthcare facilities, educational institutions, and corporate campuses accelerate outsourcing of food management to specialized operators like Compass Group and Aramark.
US Food Service Market Overview
Food service encompasses the professional preparation, presentation, and delivery of food and beverages to consumers across diverse institutional and commercial settings. The US food service ecosystem spans quick-service restaurants (QSRs), full-service dining, institutional catering, cafeteria operations, food trucks, ghost kitchens, and managed services. The industry is underpinned by a highly developed supply chain infrastructure spanning agricultural production, food processing, broadline distribution, and last-mile delivery.
Applications extend from everyday consumer dining and workplace cafeterias to hospital patient services, airline catering, and large-scale event management. Macroeconomic enablers include rising per-capita income, rapid urbanization, population growth, and shifting demographics - particularly millennial and Gen Z consumers who exhibit above-average frequency of eating out and higher willingness to pay for convenience and experience.
Inflationary pressures, labor cost dynamics, and evolving food safety regulations are key structural forces shaping the industry's operating environment through the forecast period.
Market Dynamics
To evaluate market opportunities, Request Sample
Market Drivers
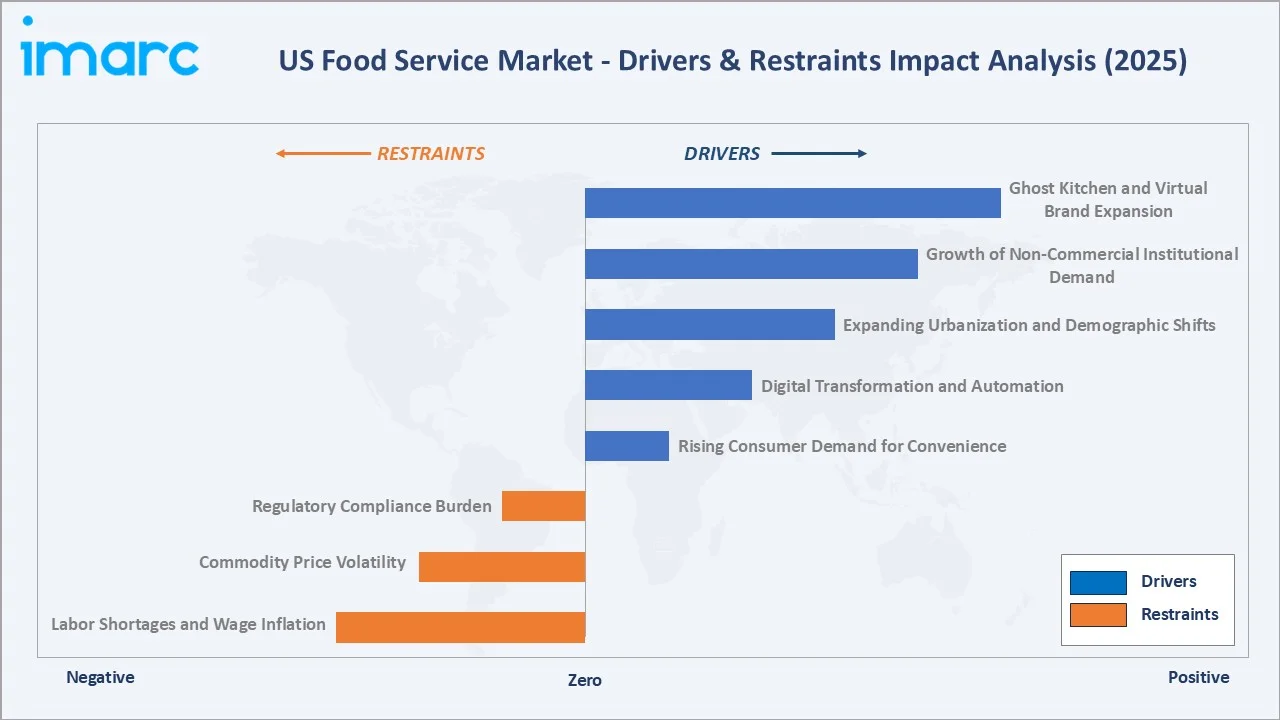
- Rising Consumer Demand for Convenience: Convenience-led consumption remains a structural growth driver. Around 60% of U.S. consumers order delivery or takeout at least once a week, reflecting a sustained behavioral shift toward off-premise dining.
- Digital Transformation and Automation: Digital ordering ecosystems—including mobile apps, kiosks, and AI-enabled ordering—are expanding rapidly. Online ordering typically drives ~15–20% higher ticket sizes versus traditional channels, reinforcing operator adoption and revenue uplift.
- Expanding Urbanization and Demographic Shifts: Urban lifestyles and younger cohorts (Millennials and Gen Z) continue to favor eating out and delivery formats. Increased dining frequency—averaging ~5 restaurant visits per month in 2024—signals structurally higher demand for food service consumption.
- Growth of Non-Commercial Institutional Demand: Healthcare, education, and corporate institutions are increasingly outsourcing food services, driven by operational efficiency and demographic factors such as an aging population, creating stable, long-term contract revenue streams.
Market Restraints
- Labor Shortages and Wage Inflation: Persistent staffing shortages and rising minimum wages are structurally increasing labor costs, pressuring margins and accelerating automation investments across QSR and fast-casual segments.
- Commodity Price Volatility: Fluctuations in key inputs (proteins, produce, oils) continue to compress margins and necessitate menu price increases, contributing to potential demand softening.
- Regulatory Compliance Burden: Evolving food safety standards, calorie labeling mandates, and sustainability regulations are increasing compliance complexity and disproportionately impacting smaller operators.
Market Opportunities
- Ghost Kitchen and Virtual Brand Expansion: Delivery-only kitchens significantly reduce capex requirements versus traditional formats, enabling rapid expansion and flexible market entry strategies.
- Plant-Based and Health-Focused Menu Innovation: Rising demand for healthier and alternative protein options continues to reshape menus, with plant-based categories expanding rapidly across both retail and food service channels.
- Technology-Driven Personalization: AI-led recommendation engines, loyalty ecosystems, and subscription models are enhancing customer retention and increasing lifetime value, with digital engagement becoming a key competitive differentiator.
Market Challenges
- Intensifying Competition from Retail and Meal Kits: Retail prepared foods and meal kits are increasingly capturing share from traditional food service, particularly among price-sensitive and health-conscious consumers.
- Sustainability and Waste Reduction Pressures: Heightened regulatory and consumer scrutiny around packaging waste and emissions is driving additional investment in sustainable materials and supply chains, increasing operating costs.
Emerging Market Trends
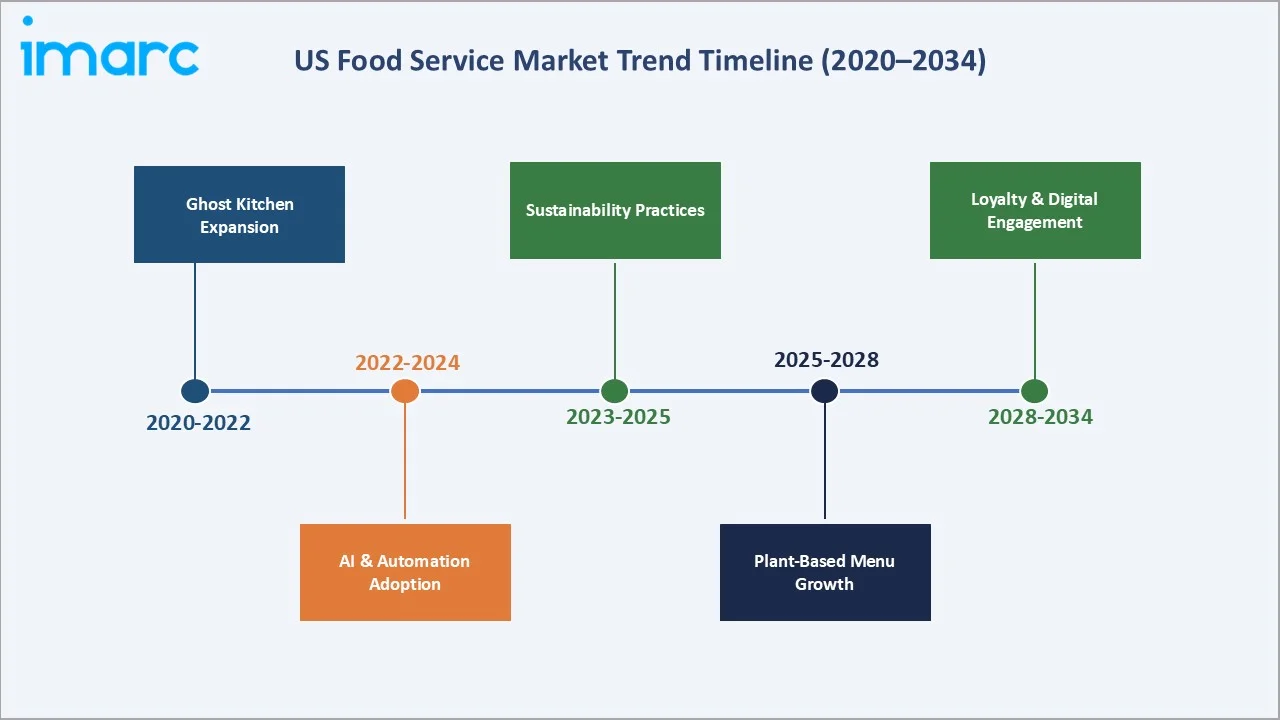
1. Rise of Ghost Kitchens and Virtual Brands
Ghost kitchens (delivery-only formats) are expanding as operators seek asset-light growth and market testing flexibility. Major QSRs use them to pilot menus and enter new locations without full store investments.
2. AI and Automation Integration
Artificial intelligence is being deployed across the food service value chain - from demand forecasting and automated ordering to robotics in food preparation. Several large QSR operators have introduced AI-driven drive-through voice ordering, while automated fry stations and burger-assembly robots are in active pilots.
3. Sustainability and Eco-Friendly Practices
Sustainability has moved from a differentiator to a baseline consumer expectation. Operators are reducing food waste through predictive inventory management, transitioning to compostable packaging, and sourcing locally to reduce food miles.
4. Plant-Based and Functional Menu Expansion
Menu innovation is shifting toward plant-based and health-oriented offerings, driven by consumer demand for wellness and dietary alternatives. Major chains continue to expand these options across core menus.
5. Loyalty Programs and Digital Customer Engagement
Digital ordering and loyalty programs are central to growth. Starbucks Corporation reports ~34M active U.S. rewards members, with loyalty users driving higher spend. Leading QSRs report ~30–40% of sales via digital channels.
Industry Value Chain Analysis
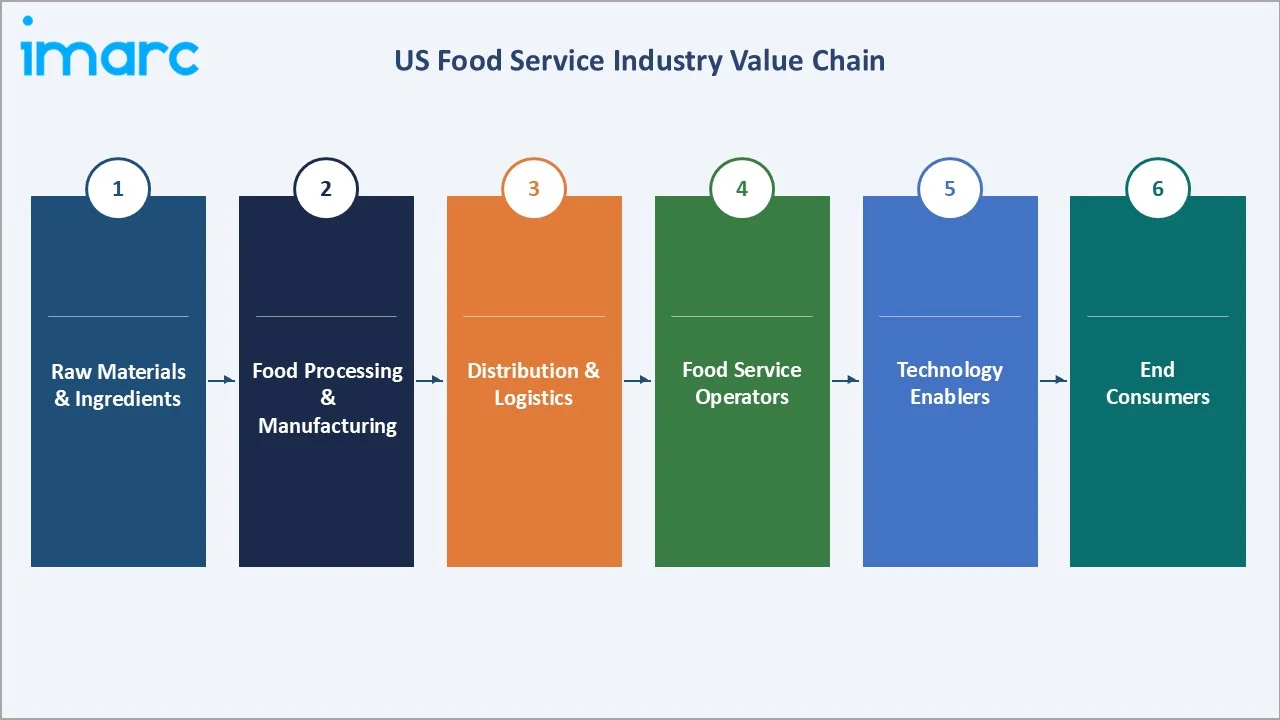
The US food service value chain spans six integrated stages from agricultural ingredient supply through to end consumer delivery. Each stage presents distinct competitive dynamics, margin profiles, and technology investment requirements. Technology intermediaries - particularly digital ordering platforms and last-mile delivery networks - have emerged as critical infrastructure players, reshaping margin distribution across the chain.
|
Stage |
Key Players / Examples |
|
Raw Materials & Ingredients |
Agricultural producers, commodity traders, protein processors |
|
Food Processing & Manufacturing |
Ready-to-use ingredient suppliers, frozen food manufacturers |
|
Distribution & Logistics |
Broadline distributors, cold chain logistics, and last-mile delivery |
|
Food Service Operators |
QSRs, full-service restaurants, institutional caterers, ghost kitchens |
|
Technology Enablers |
POS vendors, online ordering platforms, and kitchen automation providers |
|
End Consumers |
Individual diners, corporate employees, institutional beneficiaries (healthcare patients, students, airline passengers) |
Broadline distributors, particularly Sysco and US Foods, occupy the highest strategic value position in the upstream chain, integrating ingredient sourcing, cold chain logistics, and value-added processing into turnkey supply solutions. Digital ordering platforms are increasingly disrupting downstream margin distribution by capturing transaction fees and consumer data at the point of engagement.
Technology Landscape in the US Food Service Industry
Digital Ordering and Customer-Facing Technology
Digital ordering infrastructure - encompassing mobile apps, self-service kiosks, and AI voice ordering - has become standard across QSR and fast-casual formats. McDonald's has deployed self-service kiosks in thousands of US locations, with digital order values averaging 15-20% higher than counter orders. AI-powered drive-through voice ordering is in active pilots at major chains, including McDonald's, Taco Bell, and White Castle.
Kitchen Automation and Operational Technology
Kitchen automation is the next frontier. Robotic fry stations, automated drink dispensers, and computer vision-based quality control systems are being piloted and scaled by operators seeking to offset rising labor costs. AI-powered demand forecasting tools, integrated with POS data and weather patterns, allow operators to optimize ingredient ordering and reduce food waste. Cloud-based restaurant management platforms from vendors such as Toast and Oracle MICROS provide real-time analytics, enabling multi-unit operators to centralize oversight across hundreds of locations.
Delivery and Last-Mile Technology
Third-party delivery platforms DoorDash, Uber Eats, and Grubhub have collectively transformed the food service distribution model. Off-premise dining is a structural shift that has permanently altered store format requirements, kitchen design, and menu engineering across all restaurant categories.
Market Segmentation Analysis
The report covers the following segments:
|
Segment Category |
Leading Segment |
Market Share |
Year |
|
Sector |
Commercial |
80% |
2025 |
|
System |
🔒 |
🔒 |
2025 |
|
Type of Restaurant |
Fast Food Restaurants |
45% |
2025 |
|
Region |
South |
32% |
2025 |

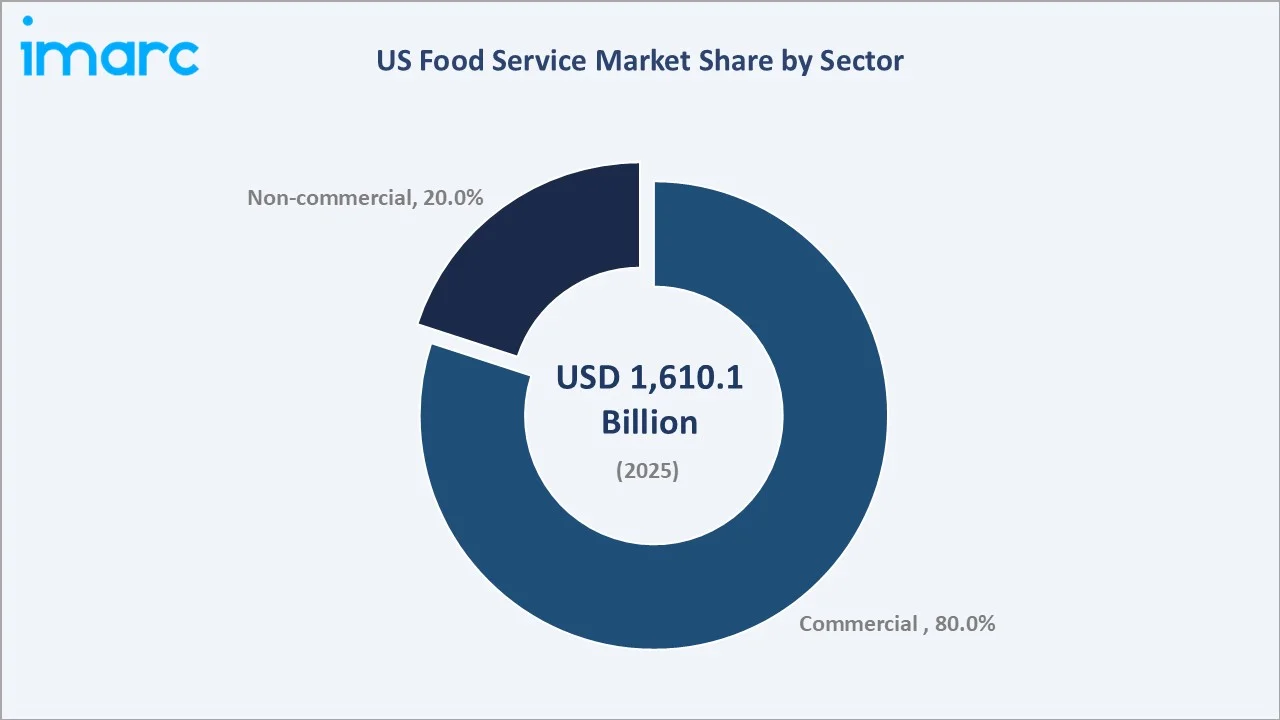
By Sector
To access detailed market analysis, Request Sample
The commercial sector dominates with an 80% share in 2025. This segment encompasses restaurants, cafes, bars, hotels, fast food chains, and catering companies operating for commercial profit. High foot traffic locations, urban density, and tourism activity continue to drive commercial segment expansion. National QSR chains and casual dining groups account for the majority of commercial sector revenues.
The non-commercial sector at 20% serves institutional mandates in healthcare, education, and corporate environments, growing steadily as organizations outsource food management to professional operators. The aging US population is driving healthcare facility dining expansion, while corporate dining modernization programs are creating new managed services contracts.
By Type of Restaurant
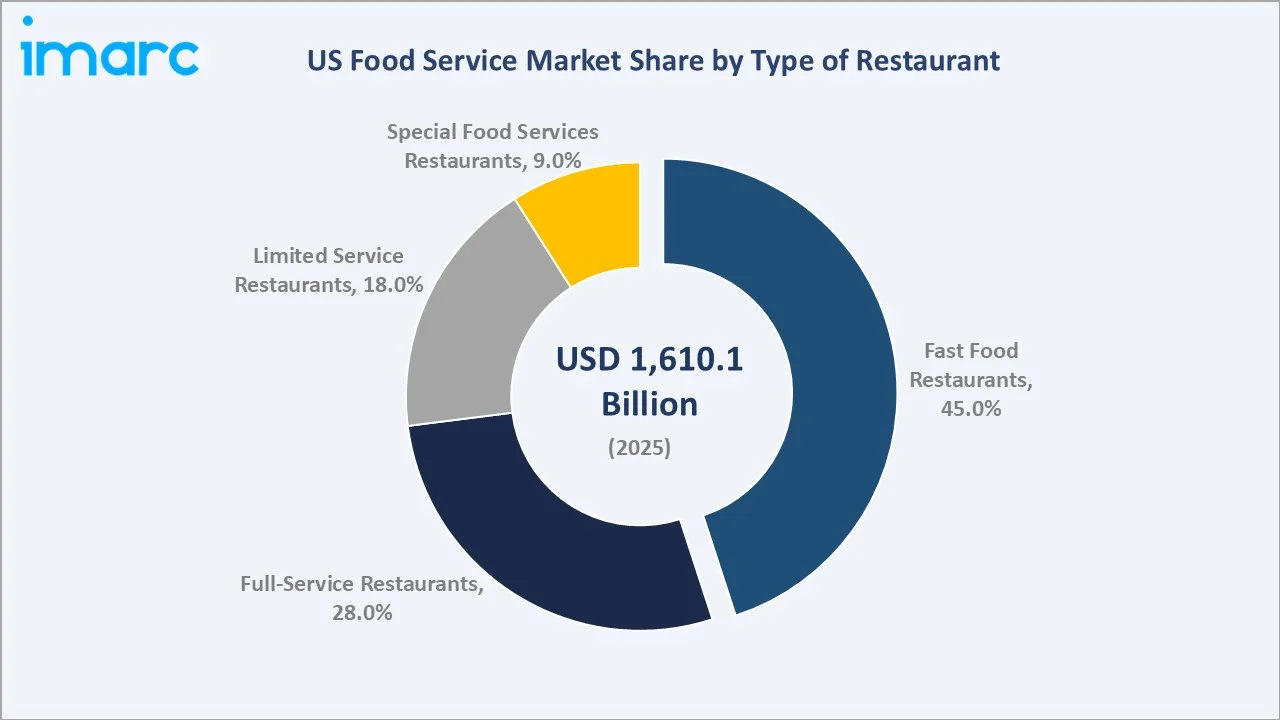
Fast food restaurants command the single largest share at 45%, driven by value pricing, speed, and ubiquitous geographic coverage. Full-service restaurants account for 28%, benefiting from recovery in experiential dining and corporate entertainment spending. Limited service restaurants at 18% serve a growing segment seeking quality above fast food at moderate price points. Special food services restaurants at 9% include catering and specialty venues serving niche but premium-priced occasions.
Fast food restaurants are expected to sustain dominance through 2034, with an estimated CAGR of 6.42% - the highest among all restaurant type sub-segments. Growth is supported by continued franchise network expansion, drive-through and delivery channel optimization, and aggressive loyalty program investment.
Regional Market Insights
|
Region |
Share (2025) |
Key Growth Drivers |
|
South |
32% |
High restaurant density, tourism, rapid population growth in TX, FL, GA; strong hospitality culture |
|
West |
26% |
Urban density, high-tech sector incomes, foodie culture, ghost kitchen innovation hub in CA and WA |
|
Midwest |
22% |
Institutional food service demand, manufacturing workforce dining, suburban restaurant network expansion |
|
Northeast |
20% |
Premium dining concentration, high-income demographics, tourism, dense urban restaurant ecosystem in NY, MA, PA |
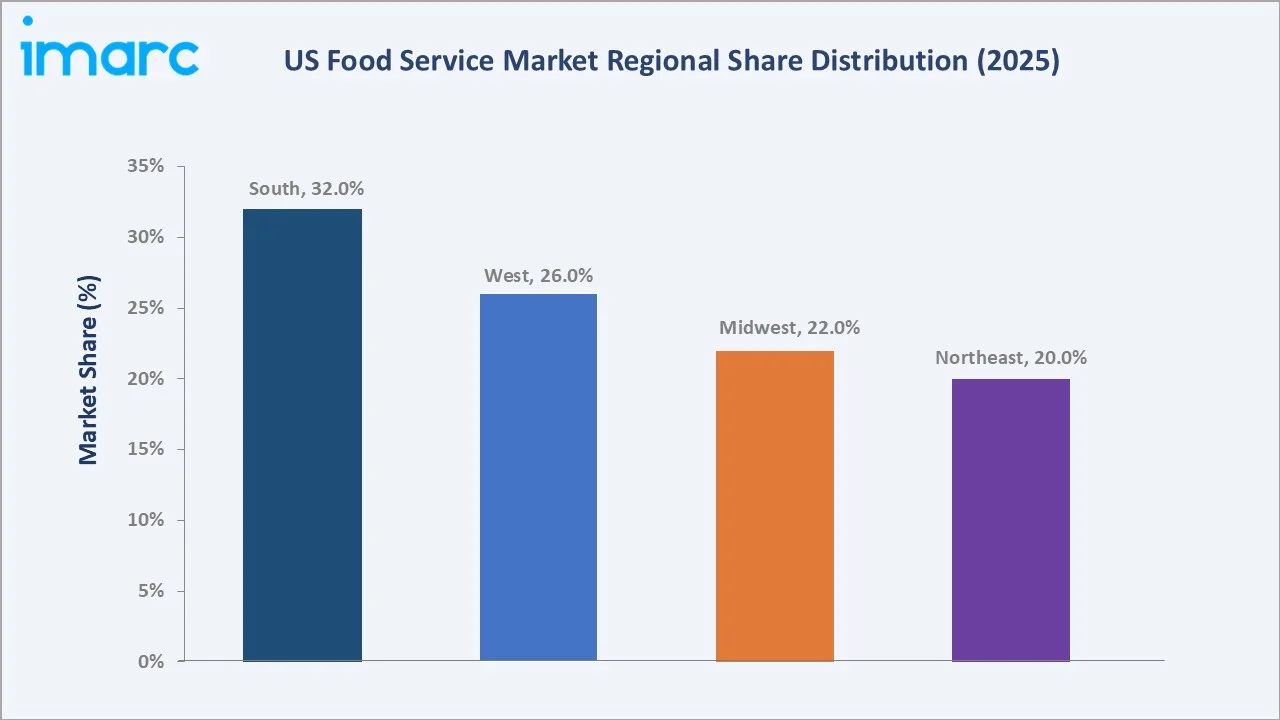
The South region commands a 32% US food service market share in 2025, driven by the highest concentration of food service locations relative to population. Texas and Florida alone account for a disproportionate share of Southern revenues, supported by strong domestic tourism, rapid population growth from domestic migration, and a culturally embedded tradition of dining out.
The West region at 26% is anchored by California, the US state with the single largest food service industry by revenue and the primary incubator for food service innovation, hosting the highest concentration of ghost kitchen operators and plant-based dining concepts. The Northeast at 20%, led by New York and Massachusetts, hosts the highest density of premium full-service restaurants. The Midwest, at 22%, is characterized by strong institutional and managed services demand from its large manufacturing and healthcare sectors.
Competitive Landscape
|
Company Name |
Key Brand(s) |
Market Position |
Core Strength |
|
McDonald's |
Happy Meal, McCafé Coffees |
Leader |
QSR scale, digital leadership, AI ordering |
|
Yum! Brands Inc. |
KFC, Taco Bell, Pizza Hut, The Habit Burger & Grill |
Leader |
Multi-brand QSR portfolio, 45M+ global loyalty members |
|
Starbucks Coffee Company |
Starbucks |
Leader |
Premium coffee & beverage, 34M Rewards members |
|
Darden Restaurants Inc. |
Olive Garden, LongHorn |
Leader |
Largest full-service operator, ~USD 11.4B FY2024 revenues |
|
Restaurant Brands International Inc. |
TIM HORTONS, BURGER KING, POPEYES |
Challenger |
Multi-brand QSR, ~18,000 Burger King US locations |
|
Compass Group PLC |
Eurest, Canteen, Chartwells |
Leader |
Largest managed services, dominant in B&I, healthcare & education |
|
Aramark Corporation |
Aramark |
Challenger |
Institutional food service, universities, hospitals, sports venues |
The US food service competitive landscape is characterized by a small number of nationally scaled chain operators commanding substantial brand recognition and consumer loyalty, alongside a highly fragmented base of independent and regional operators that collectively account for 60-65% of total market locations.
Key Company Profiles
McDonald's
McDonald's is the food service company by system-wide sales, operating over 14,000 company-owned and franchised locations in the US. The company's technology-first strategy - encompassing AI-powered drive-through ordering, dynamic pricing capability, and the MyMcDonald's Rewards app - positions it as the benchmark for QSR digital transformation.
- Product Portfolio: McCafe premium beverage line, McPlant (plant-based), Happy Meals, and seasonal limited-time offerings.
- Recent Developments: In December 2023, McDonald's announced new targets for development, loyalty membership, and cloud technology.
- Strategic Focus: McDonald's strategy centers on three pillars: digital & delivery, restaurant development, and menu innovation.
Yum! Brands
Yum! Brands operates three of the most recognized QSR brands in the US - Taco Bell, KFC, and Pizza Hut - across approximately 8,000 US locations combined. Taco Bell is the company's highest-growth brand, consistently delivering positive same-store sales driven by menu innovation, a late-night daypart strategy, and deep loyalty with millennial and Gen Z consumers.
- Product Portfolio: Taco Bell (Mexican-inspired fast food), KFC (chicken), Pizza Hut (pizza and pasta); all three brands offer delivery, dine-in, carryout, and drive-through formats.
- Recent Developments: In February 2026, Yum! Brands, Inc. introduced Byte by Yum!, a comprehensive collection of proprietary Software as a Service (SaaS) AI-driven products that will enable KFC, Taco Bell, Pizza Hut, and Habit Burger & Grill restaurants across the world to delight customers, streamline operations, and empower teams.
- Strategic Focus: Yum! Brands' strategy focuses on bold restaurant development (aggressively expanding Taco Bell internationally and domestically), unrivaled culture and talent, and unmatched operating capability through Byte by Yum! technology platform standardization.
Starbucks Coffee Company
Starbucks operates over 16,000 company-owned and licensed locations in the US, making it the country's largest coffee chain by a significant margin.
- Product Portfolio: Premium coffee beverages, Teavana teas, Refreshers, cold brew and nitro coffee, food items (bakery, sandwiches, protein boxes), and seasonal limited-time specialty drinks.
- Recent Developments: In January 2026, Starbucks Coffee Company hosted its 2026 Investor Day, highlighting progress in its “Back to Starbucks” transformation plan, showcasing new coffeehouse and menu innovation, and detailing a financial framework for delivering long-term, sustainable growth.
- Strategic Focus: Starbucks strategy prioritizes elevating the brand through premium positioning, energizing core US and China market recovery, and scaling the digital flywheel (Rewards membership, mobile ordering, digital payments).
Market Concentration Analysis
The US food service market remains highly fragmented despite the prominence of national chains. Independent operators and small regional chains account for approximately 60-65% of total market locations, though they represent a lower share of revenue due to lower average unit volumes. The top 5 QSR chains - McDonald's, Yum! Brands Inc., Starbucks Coffee Company, and Darden Restaurants Inc. collectively account for approximately 25-28% of total commercial sector revenues as of 2025.
Consolidation is ongoing, particularly in the institutional and managed services segments where Compass Group PLC and Aramark Corporation are expanding through contract wins and strategic acquisitions. In the QSR space, franchise model proliferation continues to accelerate growth for established brands with lower capital intensity than company-owned expansion. Private equity-backed roll-up strategies are active in the pizza delivery and sub-sandwich categories.
The competitive dynamics suggest that consolidation at the top end will continue, while the independent operator segment will remain large and structurally significant, particularly in full-service dining where local culinary differentiation commands premium pricing and consumer loyalty.
Investment & Growth Opportunities
Fastest-Growing Segments
QSRs are the fastest-growing format (~5–7% CAGR), driven by franchising, delivery, and digital ordering. Ghost kitchens offer the highest capital efficiency, with ~USD 30K–100K capex vs. USD 300K–500K+ for traditional formats, enabling faster scaling and higher ROI.
Emerging Market Expansion
Expansion is shifting to secondary and tertiary cities due to lower costs and rising demand. Healthcare dining remains the most resilient segment, supported by the U.S. 65+ population reaching ~73–78M by 2030.
Venture & Private Investment Trends
PE is active in multi-unit franchise platforms, while VC focuses on delivery tech, SaaS, and ghost kitchens. DoorDash and Uber Eats are investing in platform capabilities, while Miso Robotics and Hyphen are gaining traction in automation.
Future Market Outlook (2026-2034)
The US food service market is positioned for sustained, broad-based growth through 2034, with a CAGR estimated at 5.93%, projecting market value expansion from USD 1,610.1 Billion in 2025 to USD 2,703.6 Billion by 2034. Growth will be driven by a combination of volume expansion (net new restaurant openings, institutional contract growth, and delivery channel penetration) and value uplift from premiumization, price pass-through, and software service revenue additions.
Technology disruption will redefine the competitive landscape through the forecast horizon. AI-driven personalization, autonomous delivery vehicles, and fully automated commercial kitchens will progressively lower the cost-to-serve for volume operators. Regulatory change - including mandatory nutrition labelling expansions, evolving paid leave requirements, and tightening food safety standards - will accelerate further industry consolidation through the forecast period.
Sustainability imperatives will also shape the market. Consumer willingness to pay a premium for sustainably sourced, low-waste food service experiences is growing, and operators that embed ESG principles into operations will gain measurable competitive advantages with millennial and Gen Z consumer cohorts. By 2034, the US food service industry is forecast to have meaningfully increased the share of digital, delivery, and automated service formats relative to traditional dine-in formats.
Research Methodology
Primary Research
Primary research included structured interviews with U.S. food service stakeholders—operators, buyers, vendors, and consultants—to validate market sizing, segmentation, technology adoption, and competitive positioning across commercial and non-commercial segments.
Secondary Research
Secondary sources include the US Bureau of Labor Statistics (food service employment and wage data), US Census Bureau (population and urbanization data), USDA Economic Research Service (food consumption and pricing data), National Restaurant Association industry reports, company annual reports and earnings call transcripts, and trade publications including Nation's Restaurant News, Restaurant Business, and QSR Magazine.
Forecasting Models
Market size estimations and growth projections were derived using a combination of top-down and bottom-up forecasting models, incorporating GDP growth rates, consumer spending indices, urbanization rates, demographic projections, and historical market evolution patterns. Scenario analysis (base, optimistic, and conservative cases) was performed to account for macroeconomic uncertainty, including potential recessionary pressures and technology adoption pace variability.
US Food Service Market Report Coverage:
| Report Features | Details |
|---|---|
| Base Year of the Analysis | 2025 |
| Historical Period | 2020-2025 |
| Forecast Period | 2026-2034 |
| Units | Billion USD |
| Scope of the Report | Exploration of Historical Trends and Market Outlook, Industry Catalysts and Challenges, Segment-Wise Historical and Future Market Assessment:
|
| Sectors Covered | Commercial, Non-commercial |
| Systems Covered | Conventional Foodservice System, Centralized Foodservice System, Ready Prepared Foodservice System, Assembly-Serve Foodservice System |
| Types of Restaurant Covered | Fast Food Restaurants, Full-Service Restaurants, Limited Service Restaurants, Special Food Services Restaurants |
| Regions Covered | Northeast, Midwest, South, West |
| Companies Covered | McDonald's, Yum! Brands Inc., Starbucks Coffee Company, Darden Restaurants Inc., Restaurant Brands International Inc., Compass Group PLC, Aramark Corporation, etc. |
| Customization Scope | 10% Free Customization |
| Post-Sale Analyst Support | 10-12 Weeks |
| Delivery Format | PDF and Excel through Email (We can also provide the editable version of the report in PPT/Word format on special request) |
Key Benefits for Stakeholders:
- IMARC’s industry report offers a comprehensive quantitative analysis of various market segments, historical and current market trends, market forecasts, and dynamics of the US food service market from 2020-2034.
- The research report provides the latest information on the market drivers, challenges, and opportunities in the US food service market.
- Porter's five forces analysis assist stakeholders in assessing the impact of new entrants, competitive rivalry, supplier power, buyer power, and the threat of substitution. It helps stakeholders to analyze the level of competition within the US food service industry and its attractiveness.
- Competitive landscape allows stakeholders to understand their competitive environment and provides an insight into the current positions of key players in the market.
Frequently Asked Questions About the US Food Service Market Report
The US food service market reached USD 1,610.1 Billion in 2025, driven by rising urbanization, digital ordering adoption, and strong consumer demand for out-of-home dining.
The market is projected to reach USD 2,703.6 Billion by 2034, growing at a CAGR of 5.93% during 2026-2034, driven by digital ordering growth, ghost kitchen expansion, and rising institutional food service demand.
The commercial sector leads with an 80% share in 2025, encompassing restaurants, fast food chains, cafes, catering, and hospitality food service operations across the country.
Fast food restaurants hold the largest share at 45% in 2025, driven by consumer preference for affordability, speed, drive-through convenience, and loyalty-driven digital engagement.
The South region leads with 32% market share in 2025, driven by high restaurant density, strong domestic tourism, and rapid population growth in Texas, Florida, and Georgia.
Key drivers include rising urbanization, digital ordering and delivery platform adoption, increasing disposable incomes, kitchen automation and AI integration, and growing demand for convenient dining options.
Leading companies include McDonald's, Yum! Brands Inc., Starbucks Coffee Company, Darden Restaurants Inc., Restaurant Brands International Inc., Compass Group PLC, and Aramark Corporation.
Key trends include ghost kitchen and virtual brand expansion, AI and automation integration, plant-based menu growth, sustainability adoption, and digital loyalty platform investment.
AI-powered ordering, robotic kitchen equipment, cloud POS systems, and delivery platform integration are improving efficiency, reducing labor costs, and generating 30-40% of revenues through digital channels for leading operators.
Key challenges include persistent labor shortages, wage inflation, commodity price volatility, food safety compliance burdens, and rising competition from retail prepared food and meal kit services.
Need more help?
- Speak to our experienced analysts for insights on the current market scenarios.
- Include additional segments and countries to customize the report as per your requirement.
- Gain an unparalleled competitive advantage in your domain by understanding how to utilize the report and positively impacting your operations and revenue.
- For further assistance, please connect with our analysts.
 Request Customization
 Speak to an Analyst
 Request Brochure
 Inquire Before Buying
Benefits of Customization
- Personalize this research
- Triangulate with your data
- Get data as per your format and definition
- Gain a deeper dive into a specific application, geography, customer, or competitor
- Any level of personalization
Get in Touch With Us
UNITED STATES
Phone: +1-201-971-6302
INDIA
Phone: +91-120-433-0800
UNITED KINGDOM
Phone: +44-753-714-6104
Email: [email protected]
Client Testimonials


.webp)


