
Yellow Phosphorus Prices, Trend, Chart, Demand, Market Analysis, News, Historical and Forecast Data Report 2026 Edition
Yellow Phosphorus Price Trend, Index and Forecast
Track real-time and historical yellow phosphorus prices across global regions. Updated monthly with market insights, drivers, and forecasts.
Yellow Phosphorus Prices December 2025
| Region | Price (USD/KG) | Latest Movement |
|---|---|---|
| Northeast Asia | 3.44 | 1.5% ↑ Up |
| Europe | 5.10 | 0.8% ↑ Up |
| Southeast Asia | 5.46 | 2.1% ↑ Up |
| North America | 5.62 | 0.5% ↑ Up |
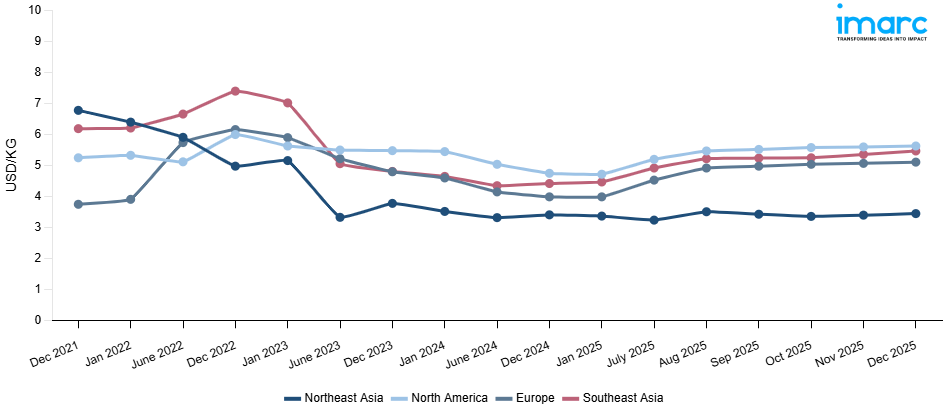
Yellow Phosphorus Price Index (USD/KG):
The chart below highlights monthly yellow phosphorus prices across different regions.
Get Access to Monthly/Quarterly/Yearly Prices, Request Sample
Market Overview Q3 Ending September 2025
Northeast Asia: In Northeast Asia, yellow phosphorus prices declined amid subdued demand from phosphoric acid and fertilizer producers. The yellow phosphorus price index reflected weakening purchasing activity as downstream sectors operated at reduced capacity. Ample supply from major Chinese producers, combined with lower electricity costs in some regions, contributed to the overall price correction. Additionally, export competitiveness was restrained due to limited orders from international buyers, adding downward pressure to regional prices during this quarter.
Europe: In Europe, yellow phosphorus prices rose modestly supported by firm demand from the specialty chemicals and flame retardants sectors. The yellow phosphorus price index increased slightly as stable feedstock imports and tight domestic availability balanced regional supply. Improved consumption in electronics and metallurgical applications also contributed to the positive pricing trend. Despite energy cost volatility, higher procurement activity from industrial end-users helped sustain the market’s upward trajectory through the quarter.
Southeast Asia: Yellow phosphorus prices in Southeast Asia inched up marginally, with the yellow phosphorus price index showing stability amid balanced market fundamentals. Regional demand from fertilizers and specialty phosphates remained consistent, while limited supply inflow from Northeast Asia prevented price declines. Although production costs stayed manageable, increased shipping and logistics expenses added mild upward pressure to prices, resulting in a largely steady but slightly firmer market sentiment across the region.
North America: In North America, yellow phosphorus prices recorded a moderate increase, driven by steady industrial activity and rising raw material costs. The yellow phosphorus price index trended upward as consistent demand from metallurgical and electronics sectors supported procurement. Supply constraints due to maintenance at a few regional facilities also contributed to the bullish tone. Additionally, higher import costs from Asian suppliers and logistical challenges maintained a tight supply-demand balance, sustaining firm price levels through this quarter.
Yellow Phosphorus Price Trend, Market Analysis, and News
IMARC's latest publication, “Yellow Phosphorus Prices, Trend, Chart, Demand, Market Analysis, News, Historical and Forecast Data Report 2026 Edition,” presents a detailed examination of the yellow phosphorus market, providing insights into both global and regional trends that are shaping prices. This report delves into the spot price of yellow phosphorus at major ports and analyzes the composition of prices, including FOB and CIF terms. It also presents detailed yellow phosphorus prices trend analysis by region, covering North America, Europe, Asia Pacific, Latin America, and Middle East and Africa. The factors affecting yellow phosphorus pricing, such as the dynamics of supply and demand, geopolitical influences, and sector-specific developments, are thoroughly explored. This comprehensive report helps stakeholders stay informed with the latest market news, regulatory updates, and technological progress, facilitating informed strategic decision-making and forecasting.
.webp)
Yellow Phosphorus Industry Analysis
The global yellow phosphorus industry size reached USD 4.4 Billion in 2025. By 2034, IMARC Group expects the market to reach USD 5.9 Billion, at a projected CAGR of 3.40% during 2026-2034. Market growth is driven by increasing demand for yellow phosphorus in fertilizers, flame retardants, and specialty chemicals. Expanding use in metallurgical processes and the electronics industry, alongside advancements in phosphorus-based derivative production, continues to support global market development.
Latest developments in the Yellow Phosphorus Industry:
- July 2025: Chatham Rock Phosphate Limited supplied lump phosphate samples to a Malaysian yellow phosphorus producer, Cahya Mata Phosphates, as part of early-stage negotiations for a possible offtake agreement. The Malaysian firm operates electric arc furnaces to produce yellow phosphorus, technical grade phosphoric acid, and food grade phosphoric acid, and has a demand of ~440,000 tons/year of lump phosphate.
- December 2023: Avenira Limited secured a USD 2 million strategic equity investment from Sichuan Hebang Biotechnology Corporation, a Shanghai Stock Exchange–listed company. The two firms also signed a non-binding memorandum of understanding to collaborate in phosphate mining and yellow phosphorus production.
- October 2023: Sumitomo Corporation entered a joint research agreement with Tohoku University to develop new production technology for recycled yellow phosphorus, an essential material for semiconductors. Supported in part by Japan’s Ministry of Economy, Trade and Industry (METI), the initiative aims to meet roughly 30 % of Japan’s domestic yellow phosphorus demand by the latter half of the 2020s.
Product Description
Yellow phosphorus (P₄) is a soft, waxy, and highly reactive allotrope of phosphorus that appears yellow to colorless and emits a faint glow in the dark due to slow oxidation. It is produced industrially by heating phosphate rock in an electric furnace with carbon and silica. Known for its high reactivity and volatility, yellow phosphorus must be stored underwater or in inert conditions to prevent spontaneous ignition. It serves as a crucial feedstock for the production of phosphoric acid, phosphorus trichloride, and other phosphorus compounds used in fertilizers, flame retardants, and chemicals. Additionally, it finds applications in metallurgy, semiconductors, and pyrotechnics due to its chemical versatility. Its broad utility across industrial and agricultural sectors makes yellow phosphorus a critical raw material in global supply chains.
Report Coverage
| Key Attributes | Details |
|---|---|
| Product Name | Yellow Phosphorus |
| Report Features | Exploration of Historical Trends and Market Outlook, Industry Demand, Industry Supply, Gap Analysis, Challenges, Yellow Phosphorus Price Analysis, and Segment-Wise Assessment. |
| Currency/Units | US$ (Data can also be provided in local currency) or Metric Tons |
| Region/Countries Covered | The current coverage includes analysis at the global and regional levels only. Based on your requirements, we can also customize the report and provide specific information for the following countries: Asia Pacific: China, India, Indonesia, Pakistan, Bangladesh, Japan, Philippines, Vietnam, Thailand, South Korea, Malaysia, Nepal, Taiwan, Sri Lanka, Hongkong, Singapore, Australia, and New Zealand* Europe: Germany, France, United Kingdom, Italy, Spain, Russia, Turkey, Netherlands, Poland, Sweden, Belgium, Austria, Ireland, Switzerland, Norway, Denmark, Romania, Finland, Czech Republic, Portugal and Greece* North America: United States and Canada Latin America: Brazil, Mexico, Argentina, Columbia, Chile, Ecuador, and Peru* Middle East & Africa: Saudi Arabia, UAE, Israel, Iran, South Africa, Nigeria, Oman, Kuwait, Qatar, Iraq, Egypt, Algeria, and Morocco* *The list of countries presented is not exhaustive. Information on additional countries can be provided if required by the client. |
| Information Covered for Key Suppliers |
|
| Customization Scope | The report can be customized as per the requirements of the customer |
| Report Price and Purchase Option |
Plan A: Monthly Updates - Annual Subscription
Plan B: Quarterly Updates - Annual Subscription
Plan C: Biannually Updates - Annual Subscription
|
| Post-Sale Analyst Support | 360-degree analyst support after report delivery |
| Delivery Format | PDF and Excel through email (We can also provide the editable version of the report in PPT/Word format on special request) |
Key Benefits for Stakeholders:
- IMARC’s report presents a detailed analysis of yellow phosphorus pricing, covering global and regional trends, spot prices at key ports, and a breakdown of FOB and CIF prices.
- The study examines factors affecting yellow phosphorus price trend, including input costs, supply-demand shifts, and geopolitical impacts, offering insights for informed decision-making.
- The competitive landscape review equips stakeholders with crucial insights into the latest market news, regulatory changes, and technological advancements, ensuring a well-rounded, strategic overview for forecasting and planning.
- IMARC offers various subscription options, including monthly, quarterly, and biannual updates, allowing clients to stay informed with the latest market trends, ongoing developments, and comprehensive market insights. The yellow phosphorus price charts ensure our clients remain at the forefront of the industry.
Frequently Asked Questions About the Yellow Phosphorus Prices Report
The yellow phosphorus prices in December 2025 were 3.44 USD/KG in Northeast Asia, 5.10 USD/KG in Europe, 5.46 USD/KG in Southeast Asia, and 5.62 USD/KG in North America.
The yellow phosphorus pricing data is updated on a monthly basis.
We provide the pricing data primarily in the form of an Excel sheet and a PDF.
Yes, our report includes a forecast for yellow phosphorus prices.
The regions covered include North America, Europe, Asia Pacific, Middle East, and Latin America. Countries can be customized based on the request (additional charges may be applicable).
Yes, we provide both FOB and CIF prices in our report.
Need more help?
- Speak to our experienced analysts for insights on the current market scenarios.
- Include additional segments and countries to customize the report as per your requirement.
- Gain an unparalleled competitive advantage in your domain by understanding how to utilize the report and positively impacting your operations and revenue.
- For further assistance, please connect with our analysts.
 Request Customization
 Inquire Before Buying
 Speak to an Analyst
 Request Brochure
Benefits of Customization
- Personalize this research
- Triangulate with your data
- Get data as per your format and definition
- Gain a deeper dive into a specific application, geography, customer, or competitor
- Any level of personalization
Get in Touch With Us
UNITED STATES
Phone: +1-201-971-6302
INDIA
Phone: +91-120-433-0800
UNITED KINGDOM
Phone: +44-753-714-6104
Email: [email protected]
Client Testimonials


.webp)


Related Reports
Why Choose Us
IMARC offers trustworthy, data-centric insights into commodity pricing and evolving market trends, enabling businesses to make well-informed decisions in areas such as procurement, strategic planning, and investments. With in-depth knowledge spanning more than 1000 commodities and a vast global presence in over 150 countries, we provide tailored, actionable intelligence designed to meet the specific needs of diverse industries and markets.
1000
+Commodities
150
+Countries Covered
3000
+Clients
20
+Industry
Robust Methodologies & Extensive Resources
IMARC delivers precise commodity pricing insights using proven methodologies and a wealth of data to support strategic decision-making.
Subscription-Based Databases
Our extensive databases provide detailed commodity pricing, import-export trade statistics, and shipment-level tracking for comprehensive market analysis.
Primary Research-Driven Insights
Through direct supplier surveys and expert interviews, we gather real-time market data to enhance pricing accuracy and trend forecasting.
Extensive Secondary Research
We analyze industry reports, trade publications, and market studies to offer tailored intelligence and actionable commodity market insights.
Trusted by 3000+ industry leaders worldwide to drive data-backed decisions. From global manufacturers to government agencies, our clients rely on us for accurate pricing, deep market intelligence, and forward-looking insights.