
Zinc Chloride Prices, Trend, Chart, Demand, Market Analysis, News, Historical and Forecast Data Report 2026 Edition
Zinc Chloride Price Trend, Index and Forecast
Track the latest insights on zinc chloride price trend and forecast with detailed analysis of regional fluctuations and market dynamics across North America, Latin America, Central Europe, Western Europe, Eastern Europe, Middle East, North Africa, West Africa, Central and Southern Africa, Central Asia, Southeast Asia, South Asia, East Asia, and Oceania.
Zinc Chloride Prices Outlook Q1 2026
- USA: USD 1238/MT
- Germany: USD 1053/MT
- Russia: USD 1326/MT
- Brazil: USD 1143/MT
- South Africa: USD 957/MT
Zinc Chloride Price Chart

Get real-time access to monthly/quarterly/yearly prices Request Sample
During the first quarter of 2026, the zinc chloride prices in the USA reached 1238 USD/MT in March. The market experienced a downward trend driven by sufficient supply and moderated demand from chemical processing and industrial applications. Domestic production remained stable, ensuring the consistent availability of material. Demand from galvanizing and battery sectors remained steady but lacked strong growth, limiting price support. Buyers maintained cautious procurement strategies, avoiding large inventory accumulation.
During the first quarter of 2026, the zinc chloride prices in Germany reached 1053 USD/MT in March. The German market observed a slight decline influenced by balanced supply conditions and subdued demand from manufacturing sectors. Production levels remained stable, while import availability ensured sufficient supply. Consumption from chemical and industrial applications remained consistent but did not expand significantly. Buyers followed conservative purchasing patterns, limiting procurement volumes.
During the first quarter of 2026, the zinc chloride prices in Russia reached 1326 USD/MT in March. The market recorded a mild decline supported by steady production and moderated domestic demand. Supply remained sufficient due to consistent output and stable export activity. Consumption from industrial and chemical sectors remained stable but lacked strong momentum. Market participants adopted cautious procurement strategies, maintaining balanced inventory levels.
During the first quarter of 2026, the zinc chloride prices in Brazil reached 1143 USD/MT in March. The Brazilian market experienced a decline driven by sufficient supply and moderated demand from industrial applications. Domestic production remained stable, ensuring steady material availability. Demand from chemical processing and galvanizing sectors remained consistent but did not show strong growth. Buyers maintained cautious procurement strategies, limiting bulk purchases.
During the first quarter of 2026, the zinc chloride prices in South Africa reached 957 USD/MT in March. The market observed a slight downward trend influenced by stable supply and subdued demand from industrial sectors. Import availability remained consistent, ensuring sufficient inventory levels. Consumption from the chemical and manufacturing industries remained steady but limited in growth.
Zinc Chloride Prices Outlook Q3 2025
- USA: USD 1296/MT
- Germany: USD 1084/MT
- Russia: USD 1357/MT
- Brazil: USD 1200/MT
- South Africa: USD 983/MT
During the third quarter of 2025, the zinc chloride prices in the USA reached 1296 USD/MT in September. Prices firmed as downstream users increased scheduled procurement tied to sustained industrial activity. Distributors coordinated intake around predictable logistics, enabling smoother alignment between supply flows and operating requirements. Warehousing and transport planning supported balanced stock positions across purchasing cycles.
During the third quarter of 2025, the zinc chloride prices in Germany reached 1084 USD/MT in September. Prices advanced as industrial consumers raised intake to support consistent usage across galvanizing and specialty chemical applications. Buyers coordinated sourcing with established documentation processes and maintained regular rotation of inventories. Stable transport networks also allowed for timely distribution across key processing regions.
During the third quarter of 2025, the zinc chloride prices in Russia reached 1357 USD/MT in September. Prices moved lower as domestic distributors moderated procurement in response to steady supply availability. Buyers aligned intake with planned manufacturing cycles, reducing near-term urgency for replenishment. Transport corridors linking industrial centers facilitated predictable routing, allowing intake to remain structured and controlled.
During the third quarter of 2025, the zinc chloride prices in Brazil reached 1200 USD/MT in September. Prices strengthened as buyers arranged additional intake to support manufacturing activity in metallurgical and chemical applications. Import pathways operated smoothly under established clearance and documentation procedures, enabling predictable scheduling. Coordinated distribution contributed to orderly purchasing across regional supply chains.
During the third quarter of 2025, the zinc chloride prices in South Africa reached 983 USD/MT in September. Prices edged lower as distributors benefited from reliable import availability, allowing purchasers to stagger intake. Inland logistics networks enabled organized distribution into local industrial hubs. Buyers emphasized pacing replenishment according to operating requirements, helping maintain consistent supply without increased stock pressure.
Zinc Chloride Prices Outlook Q2 2025
- USA: USD 1268/MT
- Germany: USD 1035/MT
- Russia: USD 1387/MT
- Brazil: USD 1182/MT
- South Africa: USD 998/MT
During the second quarter of 2025, the zinc chloride prices in the USA reached 1268 USD/MT in June. In the USA, zinc chloride prices were influenced by fluctuations in domestic zinc mining output and the availability of refining capacities. Operational constraints in some metallurgical plants impacted supply consistency. The demand from the battery manufacturing and chemical processing sectors remained firm, while freight rates and inland transportation costs contributed to overall pricing trends. Additionally, environmental compliance costs and shifts in labor availability affected production economics across select facilities.
During the second quarter of 2025, zinc chloride prices in Germany reached 1035 USD/MT in June. In Germany, the prices of zinc chloride were impacted by energy-intensive production conditions, combined with high electricity and natural gas costs. The availability of feedstock zinc from domestic and European sources fluctuated due to scheduled maintenance in upstream smelters. Demand from the galvanizing and textile sectors remained steady, but logistics disruptions and stricter environmental controls on waste handling and emissions contributed to elevated production and distribution expenses.
During the second quarter of 2025, the zinc chloride prices in Russia reached 1387 USD/MT in June. In Russia, zinc chloride pricing was shaped by shifts in raw material extraction volumes and domestic refinery output. The country’s mining sector faced periodic interruptions linked to equipment availability and regulatory inspections. Demand from the metallurgy and rubber processing industries stayed active. Export restrictions and currency fluctuations also affected pricing structures, while transport limitations in remote mining regions added to delivery timelines and operating costs.
During the second quarter of 2025, the zinc chloride prices in Brazil reached 1182 USD/MT in June. In Brazil, prices of zinc chloride were influenced by variability in zinc ore supply due to climatic disruptions affecting mining operations. The chemical and agriculture sectors continued to drive demand, while processing facilities faced challenges with infrastructure reliability and energy supply. Changes in import policies and inland logistics constraints in major industrial hubs affected material flows. Currency depreciation and inflationary pressures also influenced the cost structure for domestic manufacturers.
During the second quarter of 2025, the zinc chloride prices in South Africa reached 998 USD/MT in June. In South Africa, zinc chloride prices were impacted by constrained mining output, primarily due to periodic power outages and infrastructure limitations. Domestic smelting capacity remained under pressure from operational inefficiencies and input material scarcity. Demand from the textile and chemical sectors contributed to consistent offtake, while inland freight costs and port congestion influenced logistics timelines. Regulatory shifts in environmental management also contributed to production cost adjustments.
Zinc Chloride Prices Outlook Q1 2025
- USA: USD 1287/MT
- China: USD 1075/MT
- Russia: USD 1487/MT
- Brazil: USD 1215/MT
- South Africa: USD 1045/MT
During the first quarter of 2025, the zinc chloride prices in the USA reached 1287 USD/MT in March. As per the zinc chloride price chart, due to stable industrial demand and optimistic projections for zinc production, prices skyrocketed. Seasonal activity led to a rise in agricultural purchases at the end of the quarter. Price levels remained high due to freight and distribution delays, even with improvements in mining rules.
During the first quarter of 2025, zinc chloride prices in China reached 1075 USD/MT in March. The market saw modest price hikes, mostly due to cost increases associated with production interruptions at large zinc mines. As downstream businesses implemented constrained procurement, consumption improved after the Lunar New Year.
During the first quarter of 2025, the zinc chloride prices in Russia reached 1487 USD/MT in March. Due to constrained domestic zinc availability and growing input costs, prices in Russia increased. Import restrictions brought on by sanctions and disruptions in logistics put additional pressure on prices. Despite stable downstream consumption levels in the nation's major industrial sectors, these variables, taken together, maintained high pricing trends.
During the first quarter of 2025, the zinc chloride prices in Brazil reached 1215 USD/MT in March. Brazil's chemical industry faced challenges like currency fluctuations and fiscal deficits, which affected chemical prices, including zinc chloride. Besides, energy prices, and shipping constraints also affected zinc chloride prices.
During the first quarter of 2025, the zinc chloride prices in South Africa reached 1045 USD/MT in March. Transport bottlenecks, including delays at ports and overland routes influenced supply and prices. Besides, demand, particularly from the construction and automotive sectors also played a significant role.
Regional Coverage
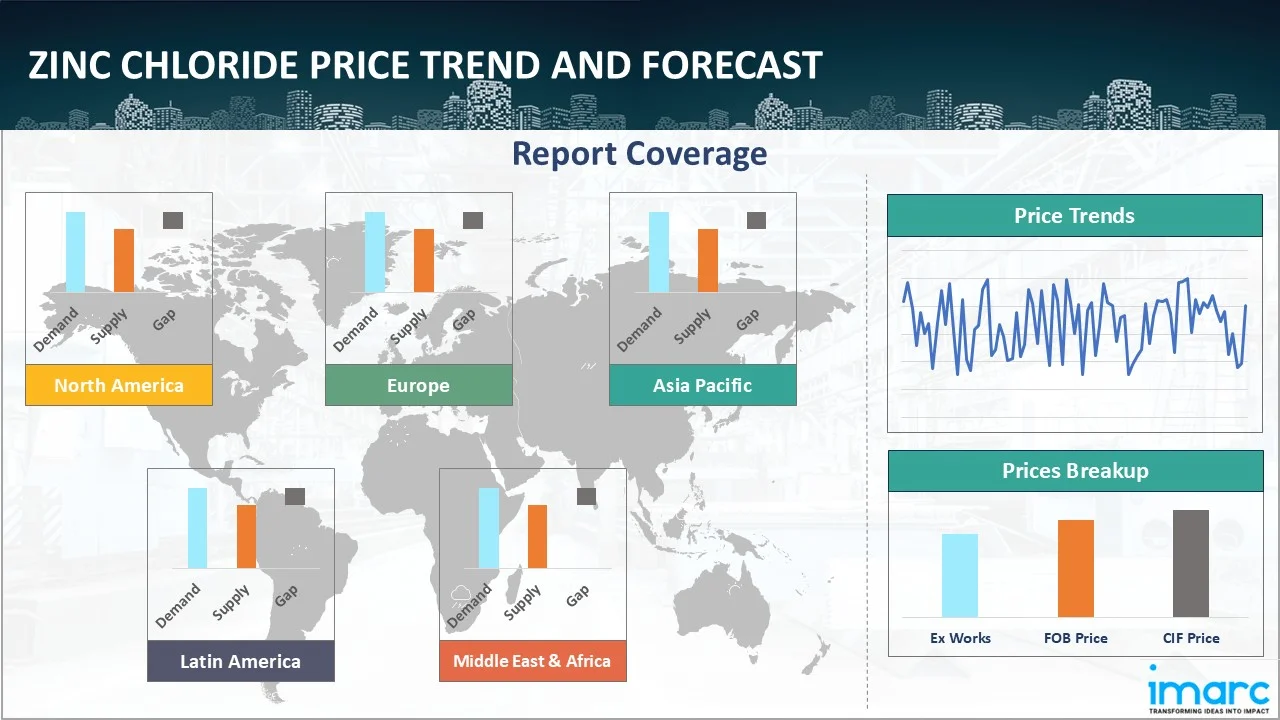
The report provides a detailed analysis of the market across different regions, each with unique pricing dynamics influenced by localized market conditions, supply chain intricacies, and geopolitical factors. This includes price trends, price forecast and supply and demand trends for each region, along with spot prices by major ports. The report also provides coverage of FOB and CIF prices, as well as the key factors influencing zinc chloride prices.
Europe Zinc Chloride Price Trend
Q1 2026:
The zinc chloride price index in Europe showed a consistent downward trend driven by sufficient supply and moderated demand from industrial and chemical sectors. Production across key countries remained stable, ensuring a steady availability of material. Import flows further supported supply levels, preventing shortages. Demand from manufacturing and galvanizing industries remained stable but lacked strong expansion. Buyers adopted cautious procurement strategies, maintaining balanced inventory levels. Additionally, stable operational and logistics costs provided limited upward support.
Q3 2025:
As per the zinc chloride price index, Europe exhibited mixed movements, reflecting Germany’s upward trend alongside easing conditions in Russia. Regional procurement moved through harmonized technical and regulatory frameworks that govern chemical handling, shaping intake rhythms for distributors. Reliable transport corridors provided steady connections between ports and processing zones, supporting predictable distribution planning. Buyers aligned replenishment cycles with downstream manufacturing needs, relying on structured sourcing patterns that allowed markets across the region to operate with consistent visibility.
Q2 2025:
European prices were influenced by high energy input costs, particularly electricity and gas, which impacted the operating margins of zinc smelters and chemical processors. Supply remained constrained due to maintenance shutdowns in key refining facilities across Central and Eastern Europe. Demand from the electronics and textile treatment sectors remained stable, while logistics expenses increased due to elevated shipping insurance rates and limited availability of road freight capacity across cross-border routes.
Q1 2025:
As per the zinc chloride price index, the market was in a dynamic environment, with values rising despite limited zinc supplies. Producers gradually passed cost constraints on to buyers. Despite early indications of a recovery in demand from the galvanizing chemical industry, price hikes were increased in March by rising utility rates. Moreover, even with tight supply conditions, industrial chemical consumption stayed steady throughout the quarter, indicating stable activity in downstream industries.
This analysis can be extended to include detailed zinc chloride price information for a comprehensive list of countries.
| Region | Countries Covered |
|---|---|
| Europe | Germany, France, United Kingdom, Italy, Spain, Russia, Turkey, Netherlands, Poland, Sweden, Belgium, Austria, Ireland, Switzerland, Norway, Denmark, Romania, Finland, Czech Republic, Portugal, and Greece, among other European countries. |
North America Zinc Chloride Price Trend
Q1 2026:
The zinc chloride price index in North America reflected a gradual decline influenced by balanced supply and steady demand from industrial applications. Domestic production remained consistent, while import levels ensured sufficient availability. Consumption from the chemical processing and battery sectors remained stable but did not show strong growth. Buyers maintained cautious purchasing strategies, avoiding large volume procurement. Stable logistics and operational costs provided limited support, resulting in a gradual decrease in prices across the region.
Q3 2025:
As per the zinc chloride price index, North America recorded an upward trend, consistent with the strengthening observed in the United States. Regional sourcing proceeded through established compliance-driven import procedures that guide chemical intake across principal entry points. Inland freight corridors linking ports with major industrial hubs supported dependable delivery cycles. Buyers coordinated procurement with operational schedules, integrating warehouse readiness and transport dependability into sourcing plans that reflected steady downstream requirements.
Q2 2025:
In North America, prices were shaped by variations in domestic zinc ore production and refinery throughput. The demand from the battery manufacturing, chemical synthesis, and galvanizing sectors exerted consistent pressure on available supply. Rising labor costs and intermittent bottlenecks in rail freight and trucking added to delivery times and cost overheads. Moreover, certain environmental compliance measures raised the operational expenses of downstream processors, particularly in states with stricter emission control regulations.
Q1 2025:
Due to strong downstream demand and optimistic forecasts for domestic zinc extraction, zinc chloride prices in North America saw the most significant regional increases. Improvements in mining regulations sped up permits, but persistent inefficiencies in transportation led to higher premiums throughout the industry. While industrial consumption remained steady, seasonal usage caused agricultural demand to elevate late in the quarter.
Specific zinc chloride prices and historical data within the United States and Canada can also be provided.
| Region | Countries Covered |
|---|---|
| North America | United States and Canada |
Middle East and Africa Zinc Chloride Price Trend
Q1 2026:
In the Middle East and Africa, zinc chloride prices experienced varied trends due to reliance on imports and moderated demand. Supply conditions remained consistent with steady import volumes. Consumption from industrial and chemical sectors showed limited growth, reducing upward price momentum. Buyers followed conservative procurement practices, maintaining necessary inventory levels. Logistics costs influenced pricing but did not significantly alter market direction, resulting in a soft pricing trend.
Q3 2025:
The Middle East and Africa saw a downward trend, aligned with the softening recorded in South Africa. Buyers across the region worked within structured administrative and documentation routines that regulate chemical imports, shaping shipment timing for industrial users. North African ports handled material through regulated clearance processes, influencing availability for local consumption. Sub-Saharan distributors considered inland transport capacity and storage conditions when scheduling replenishment, ensuring that intake remained aligned with manufacturing needs in a context of easing overall pricing sentiment.
Q2 2025:
In the Middle East and Africa, zinc chloride prices were affected by limited domestic production capacity and a heavy reliance on imported material. In South Africa specifically, power outages, labor disruptions in mining zones, and logistical inefficiencies at ports affected zinc ore availability and processing schedules. Demand from the chemical and textile sectors remained relatively constant. Rising inland transport costs and currency devaluation in several economies contributed to elevated landed costs across the region.
Q1 2025:
As per the zinc chloride price chart, regional conflicts or trade policies can affected the cost of raw materials and production, influencing prices. Besides, changes in energy costs, transportation expenses, and other production-related costs also affected the final price.
In addition to region-wise data, information on zinc chloride prices for countries can also be provided.
| Region | Countries Covered |
|---|---|
| Middle East & Africa | Saudi Arabia, UAE, Israel, Iran, South Africa, Nigeria, Oman, Kuwait, Qatar, Iraq, Egypt, Algeria, and Morocco, among other Middle Eastern and African countries. |
Asia Pacific Zinc Chloride Price Trend
Q1 2026:
In the Asia Pacific region, zinc chloride prices showed a gradual decline driven by sufficient supply and subdued demand from manufacturing and chemical sectors. Production levels remained stable, ensuring consistent availability. Export demand remained limited, reducing pressure on supply. Market participants maintained cautious inventory management strategies, avoiding excess procurement. Additionally, stable processing and transportation costs contributed to the overall downward pricing trend.
Q3 2025:
Asia Pacific’s zinc chloride market conditions were guided by underlying logistical and structural factors. Procurement cycles were shaped by established maritime pathways, documentation routines, and distribution relationships that support industrial chemical flows. Buyers coordinated shipments to coincide with internal usage schedules, emphasizing predictability of supply. Routine verification processes and transport connectivity allowed material to be positioned consistently, contributing to stable sourcing behavior across regional markets.
Q2 2025:
In the Asia Pacific region, prices were primarily influenced by fluctuations in feedstock zinc availability, particularly in China and India, due to weather disruptions and refinery maintenance activities. High demand from the agricultural, rubber, and chemical sectors added stress to supply chains, while currency volatility in several markets affected import dynamics. Export restrictions and increased inspection regimes in key producer countries further complicated trade flows. Ocean freight delays and container imbalances also impacted regional pricing.
Q1 2025:
Due to the zinc sector's balanced but constrained supply fundamentals, prices in Asia saw a modest rise. Operational difficulties at important mines in China, raised production costs and caused gradual price changes. Besides, demand somewhat increased after the Lunar New Year but stayed muted due to downstream users' cautious procurement practices. Pricing in Southeast Asia saw modest hikes, mostly due to high import costs and weak local use, while pricing in India was sustained by a steady offtake from the water purification and battery industries.
This zinc chloride price analysis can be expanded to include a comprehensive list of countries within the region.
| Region | Countries Covered |
|---|---|
| Asia Pacific | China, India, Indonesia, Pakistan, Bangladesh, Japan, Philippines, Vietnam, Thailand, South Korea, Malaysia, Nepal, Taiwan, Sri Lanka, Hongkong, Singapore, Australia, and New Zealand, among other Asian countries. |
Latin America Zinc Chloride Price Trend
Q1 2026:
In Latin America, zinc chloride prices experienced a slight decline due to balanced supply and moderated demand. Regional production remained steady, supported by consistent industrial activity. Export demand showed limited growth, allowing sufficient supply within domestic markets. Buyers maintained cautious procurement strategies, focusing on immediate requirements. Stable logistics and operational costs provided limited support, resulting in a stable but weak pricing environment.
Q3 2025:
Latin America experienced an upward trend, aligned with Brazil’s pricing increase. Regional procurement benefited from dependable maritime connections that support delivery into industrial and chemical-processing destinations. Buyers coordinated intake via documented port-handling and logistics routines that ensure compliant movement of materials into downstream channels. Southern markets incorporated warehousing, transport planning, and demand expectations into procurement cycles, enabling steady repositioning of cargo and reinforcing firmer regional pricing conditions.
Q2 2025:
In Latin America, pricing trends were driven by uneven zinc mining output and limited refining infrastructure. In Brazil, adverse weather impacted ore extraction volumes, while chemical-grade zinc chloride production was constrained by capacity limitations. Demand from the agricultural and industrial sectors remained active. Regulatory delays, high inland freight charges, and volatility in raw material procurement added to pricing pressure. Additionally, foreign exchange fluctuations increased import costs for key inputs in regional production.
Q1 2025:
As per the zinc chloride price index, factors like energy costs, labor costs, and environmental regulations impacted production costs and, consequently, prices. Besides, disruptions to the supply chain, such as transportation issues and raw material supply, caused price volatility.
This comprehensive review can be extended to include specific countries within the region.
| Region | Countries Covered |
|---|---|
| Latin America | Brazil, Mexico, Argentina, Columbia, Chile, Ecuador, and Peru, among other Latin American countries. |
Zinc Chloride Pricing Report, Market Analysis, and News
IMARC's latest publication, “Zinc Chloride Prices, Trend, Chart, Demand, Market Analysis, News, Historical and Forecast Data Report 2026 Edition,” presents a detailed examination of the zinc chloride market, providing insights into both global and regional trends that are shaping prices. This report delves into the spot price of zinc chloride at major ports and analyzes the composition of prices, including FOB and CIF terms. It also presents detailed zinc chloride prices trend analysis by region, covering North America, Europe, Asia Pacific, Latin America, and Middle East and Africa. The factors affecting zinc chloride pricing, such as the dynamics of supply and demand, geopolitical influences, and sector specific developments, are thoroughly explored. This comprehensive report helps stakeholders stay informed with the latest market news, regulatory updates, and technological progress, facilitating informed strategic decision-making and forecasting.
Zinc Chloride Industry Analysis
The global zinc chloride industry size reached USD 243.0 Million in 2025. By 2034, IMARC Group expects the market to reach USD 372.0 Million, at a projected CAGR of 4.85% during 2026-2034. Growth is supported by expanding utilization in galvanizing, textile treatment, battery production, and specialty chemical synthesis, along with consistent sourcing structures and established industrial consumption across multiple global regions.
Latest News and Developments:
- May 2025: A team of scientists from the US Department of Energy’s Brookhaven National Laboratory and Stony Brook University used artificial intelligence to visualize the internal chemistry of zinc-ion batteries with far greater clarity than previously possible. Using high-resolution operando X-ray techniques and machine learning-based image analysis, the team showed that incorporating electrolyte components such as zinc chloride alters interfacial chemistry in ways that can influence dendrite morphology and stability, offering pathways to improve next-generation aqueous zinc battery performance.
Product Description
Zinc chloride is a white, crystalline chemical compound composed of zinc and chlorine, represented by the formula ZnCl₂. It is highly soluble in water and hygroscopic, meaning it readily absorbs moisture from the air. This inorganic salt exists in several hydrated forms, but the anhydrous version is most commonly used in industrial applications due to its strong dehydrating properties.
Zinc chloride is widely used as a catalyst, fluxing agent, and dehydrating compound in various chemical processes. It plays a crucial role in galvanizing steel, where it helps to clean and prepare metal surfaces before coating. In textile processing, it is utilized for fabric treatment and in the synthesis of certain dyes. Additionally, it serves as an important component in soldering fluxes, batteries (particularly dry cell batteries), and wood preservatives, helping to prevent decay and insect damage.
In the pharmaceutical and cosmetic industries, zinc chloride is occasionally used in antiseptic solutions and dental products due to its antimicrobial properties. However, it is corrosive and toxic in concentrated forms, requiring careful handling. Its reactivity with water and organic materials makes it a versatile compound for both laboratory and commercial applications. Owing to these diverse utilities, zinc chloride remains a valuable substance in multiple industrial sectors.
Report Coverage
| Key Attributes | Details |
|---|---|
| Product Name | Zinc Chloride |
| Report Features | Exploration of Historical Trends and Market Outlook, Industry Demand, Industry Supply, Gap Analysis, Challenges, Ammonia Price Analysis, and Segment-Wise Assessment. |
| Currency/Units | US$ (Data can also be provided in local currency) or Metric Tons |
| Region/Countries Covered | The current coverage includes analysis at the global and regional levels only. Based on your requirements, we can also customize the report and provide specific information for the following countries: Asia Pacific: China, India, Indonesia, Pakistan, Bangladesh, Japan, Philippines, Vietnam, Thailand, South Korea, Malaysia, Nepal, Taiwan, Sri Lanka, Hongkong, Singapore, Australia, and New Zealand Europe: Germany, France, United Kingdom, Italy, Spain, Russia, Turkey, Netherlands, Poland, Sweden, Belgium, Austria, Ireland, Switzerland, Norway, Denmark, Romania, Finland, Czech Republic, Portugal and Greece North America: United States and Canada Middle East & Africa: Saudi Arabia, UAE, Israel, Iran, South Africa, Nigeria, Oman, Kuwait, Qatar, Iraq, Egypt, Algeria, and Morocco Latin America: Brazil, Mexico, Argentina, Columbia, Chile, Ecuador, Peru The list of countries presented is not exhaustive. Information on additional countries can be provided if required by the client. |
| Information Covered for Key Suppliers |
|
| Customization Scope | The report can be customized as per the requirements of the customer |
| Report Price and Purchase Option |
Plan A: Monthly Updates - Annual Subscription
Plan B: Quarterly Updates - Annual Subscription
Plan C: Biannually Updates - Annual Subscription
|
| Post-Sale Analyst Support | 360-degree analyst support after report delivery |
| Delivery Format | PDF and Excel through email (We can also provide the editable version of the report in PPT/Word format on special request) |
Key Benefits for Stakeholders:
- IMARC’s report presents a detailed analysis of zinc chloride pricing, covering global and regional trends, spot prices at key ports, and a breakdown of FOB and CIF prices.
- The study examines factors affecting zinc chloride price trend, including input costs, supply-demand shifts, and geopolitical impacts, offering insights for informed decision-making.
- The competitive landscape review equips stakeholders with crucial insights into the latest market news, regulatory changes, and technological advancements, ensuring a well-rounded, strategic overview for forecasting and planning.
- IMARC offers various subscription options, including monthly, quarterly, and biannual updates, allowing clients to stay informed with the latest market trends, ongoing developments, and comprehensive market insights. The zinc chloride price charts ensure our clients remain at the forefront of the industry.
Need more help?
- Speak to our experienced analysts for insights on the current market scenarios.
- Include additional segments and countries to customize the report as per your requirement.
- Gain an unparalleled competitive advantage in your domain by understanding how to utilize the report and positively impacting your operations and revenue.
- For further assistance, please connect with our analysts.
 Request Customization
 Inquire Before Buying
 Speak to an Analyst
 Request Brochure
Benefits of Customization
- Personalize this research
- Triangulate with your data
- Get data as per your format and definition
- Gain a deeper dive into a specific application, geography, customer, or competitor
- Any level of personalization
Get in Touch With Us
UNITED STATES
Phone: +1-201-971-6302
INDIA
Phone: +91-120-433-0800
UNITED KINGDOM
Phone: +44-753-714-6104
Email: [email protected]
Client Testimonials


.webp)


Why Choose Us
IMARC offers trustworthy, data-centric insights into commodity pricing and evolving market trends, enabling businesses to make well-informed decisions in areas such as procurement, strategic planning, and investments. With in-depth knowledge spanning more than 1000 commodities and a vast global presence in over 150 countries, we provide tailored, actionable intelligence designed to meet the specific needs of diverse industries and markets.
1000
+Commodities
150
+Countries Covered
3000
+Clients
20
+Industry
Robust Methodologies & Extensive Resources
IMARC delivers precise commodity pricing insights using proven methodologies and a wealth of data to support strategic decision-making.
Subscription-Based Databases
Our extensive databases provide detailed commodity pricing, import-export trade statistics, and shipment-level tracking for comprehensive market analysis.
Primary Research-Driven Insights
Through direct supplier surveys and expert interviews, we gather real-time market data to enhance pricing accuracy and trend forecasting.
Extensive Secondary Research
We analyze industry reports, trade publications, and market studies to offer tailored intelligence and actionable commodity market insights.
Trusted by 3000+ industry leaders worldwide to drive data-backed decisions. From global manufacturers to government agencies, our clients rely on us for accurate pricing, deep market intelligence, and forward-looking insights.