
2-Methylpropan-1-ol Prices, Trend, Chart, Demand, Market Analysis, News, Historical and Forecast Data Report 2026 Edition
2-Methylpropan-1-ol Price Trend, Index and Forecast
Explore the latest insights on 2-methylpropan-1-ol price trends and forecasts with thorough analysis of regional fluctuations and market dynamics across North America, Latin America, Central Europe, Western Europe, Eastern Europe, Middle East, North Africa, West Africa, Central and Southern Africa, Central Asia, Southeast Asia, South Asia, East Asia, and Oceania.
2-Methylpropan-1-ol Prices Outlook Q2 2026
- USA: USD 767/MT
- Germany: USD 1711/MT
- Japan: USD 1280/MT
- Brazil: USD 1492/MT
- Canada: USD 828/MT
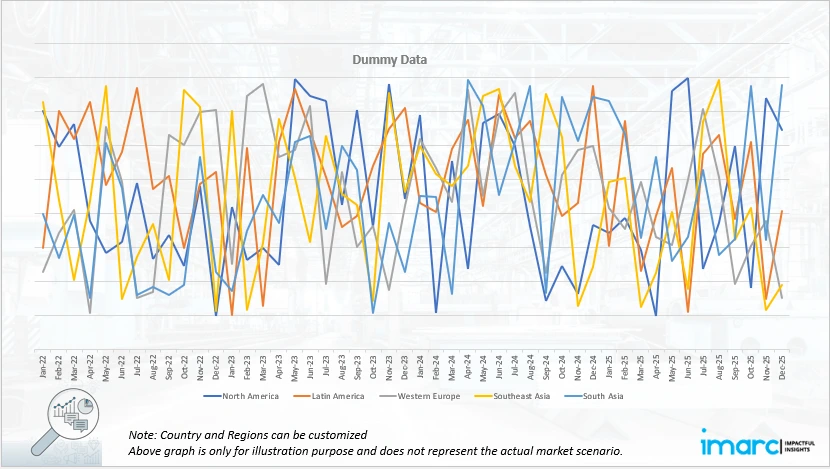
2-Methylpropan-1-ol Price Chart
Get real-time access to monthly/quarterly/yearly prices Request Sample
During the second quarter of 2026, the 2-methylpropan-1-ol prices in the USA reached 767 USD/MT in June. Prices increased as demand from downstream chemical applications remained supportive. Market sentiment strengthened due to steady consumption from solvents, coatings, and industrial manufacturing sectors. Supply availability remained balanced, but firm procurement activity contributed to upward price movement. Feedstock cost conditions also influenced pricing as producers adjusted offers based on production expenses.
During the second quarter of 2026, the 2-methylpropan-1-ol prices in Germany reached 1711 USD/MT in June. Prices recorded a moderate increase due to stable industrial demand and improved buying activity from chemical processing sectors. The market experienced support from consistent requirements in solvent manufacturing and specialty chemical applications. Production costs remained a major factor influencing supplier pricing strategies, while balanced availability prevented significant market disruptions.
During the second quarter of 2026, the 2-methylpropan-1-ol prices in Japan reached 1280 USD/MT in June. Prices increased as demand from industrial users and specialty chemical manufacturers remained steady. Market participants observed firm purchasing interest from sectors using 2-methylpropan-1-ol as a solvent and chemical intermediate. Supply conditions remained manageable, allowing producers to maintain stable pricing structures. Changes in production expenses and raw material availability influenced supplier quotations.
During the second quarter of 2026, the 2-methylpropan-1-ol prices in Brazil reached 1492 USD/MT in June. Prices moved upward due to stable demand from industrial applications and chemical processing industries. Market conditions were supported by regular consumption from coatings, adhesives, and solvent related sectors. Producers adjusted pricing in response to production costs and supply chain conditions. Import dynamics also influenced market sentiment as buyers assessed availability and procurement requirements.
During the second quarter of 2026, the 2-methylpropan-1-ol prices in Canada reached 828 USD/MT in June. Prices increased as industrial demand remained stable and buyers maintained regular procurement activities. The market received support from consumption across solvent and chemical manufacturing applications. Supply availability remained adequate, although production expenses influenced supplier pricing decisions. Market participants focused on maintaining inventory balance and securing material availability.
2-Methylpropan-1-ol Prices Outlook Q2 2025
- USA: USD 695/MT
- Germany: USD 1560/MT
- Japan: USD 1175/MT
- Brazil: USD 1400/MT
Regional Coverage
This report provides a detailed analysis of the market across various regions, each with distinctive pricing dynamics influenced by localized market conditions, supply chain intricacies, and geopolitical factors. It includes price trends, forecasts, and supply and demand trends for each region, along with spot prices by major ports. The report also covers FOB and CIF prices, as well as the key factors influencing 2-methylpropan-1-ol prices.
Europe 2-Methylpropan-1-ol Price Trend
Q2 2026:
The 2-methylpropan-1-ol price index in Europe showed an upward movement, supported by stable industrial demand and consistent consumption from chemical manufacturing sectors. Market conditions remained favorable as solvent and intermediate applications maintained regular requirements. Producers adjusted pricing based on production costs and supply conditions, which influenced regional quotations. Balanced availability prevented sharp fluctuations, while steady procurement activity from industrial users supported market firmness. European buyers continued to monitor supplier offers and inventory levels, resulting in gradual price strengthening across the region.
This analysis can be extended to include detailed 2-methylpropan-1-ol price information for a comprehensive list of countries.
| Region | Countries Covered |
|---|---|
| Europe | Germany, France, United Kingdom, Italy, Spain, Russia, Turkey, Netherlands, Poland, Sweden, Belgium, Austria, Ireland, Switzerland, Norway, Denmark, Romania, Finland, Czech Republic, Portugal, and Greece, among other European countries. |
North America 2-Methylpropan-1-ol Price Trend
Q2 2026:
The 2-methylpropan-1-ol price index in North America increased as demand from industrial and chemical processing sectors remained stable. Market participants observed improved purchasing interest from applications involving solvents and specialty chemicals. Supply conditions remained controlled, supporting firm pricing sentiment among suppliers. Production cost movements influenced pricing strategies, while balanced inventories helped maintain market stability. The region experienced steady consumption patterns, allowing prices to rise gradually during the quarter without significant supply pressure.
Specific 2-methylpropan-1-ol historical data within the United States and Canada can also be provided.
| Region | Countries Covered |
|---|---|
| North America | United States and Canada |
Middle East and Africa 2-Methylpropan-1-ol Price Trend
Q2 2026:
According to the 2-methylpropan-1-ol price chart, supply chain issues, seasonal shifts in demand, and rising costs of production influenced price variability in the Middle East and Africa.
In addition to region-wise data, information on 2-methylpropan-1-ol prices for countries can also be provided.
| Region | Countries Covered |
|---|---|
| Middle East & Africa | Saudi Arabia, UAE, Israel, Iran, South Africa, Nigeria, Oman, Kuwait, Qatar, Iraq, Egypt, Algeria, and Morocco, among other Middle Eastern and African countries. |
Asia Pacific 2-Methylpropan-1-ol Price Trend
Q2 2026:
In Asia Pacific, 2-methylpropan-1-ol prices increased as industrial demand remained supported by solvent and chemical intermediate applications. Regional producers maintained balanced supply conditions, while buyers continued regular purchasing activities. Manufacturing activity across key consuming industries influenced market sentiment and supported price adjustments. Raw material cost movements and operational expenses contributed to supplier pricing decisions. The region experienced steady market conditions, with demand strength supporting gradual upward movement in prices.
This 2-methylpropan-1-ol price analysis can be expanded to include a comprehensive list of countries within the region.
| Region | Countries Covered |
|---|---|
| Asia Pacific | China, India, Indonesia, Pakistan, Bangladesh, Japan, Philippines, Vietnam, Thailand, South Korea, Malaysia, Nepal, Taiwan, Sri Lanka, Hongkong, Singapore, Australia, and New Zealand, among other Asian countries. |
Latin America 2-Methylpropan-1-ol Price Trend
Q2 2026:
In Latin America, 2-methylpropan-1-ol prices recorded an increase as downstream industries maintained consistent consumption. Demand from coatings, adhesives, and chemical processing applications supported market activity. Suppliers adjusted offers based on production expenses and availability conditions. Import requirements influenced buyer strategies, particularly where domestic supply flexibility was limited. The regional market remained stable, with balanced supply and demand conditions contributing to moderate price growth during the quarter.
This comprehensive review can be extended to include specific countries within the region.
| Region | Countries Covered |
|---|---|
| Latin America | Brazil, Mexico, Argentina, Columbia, Chile, Ecuador, and Peru, among other Latin American countries. |
2-Methylpropan-1-ol Pricing Report, Market Analysis, and News
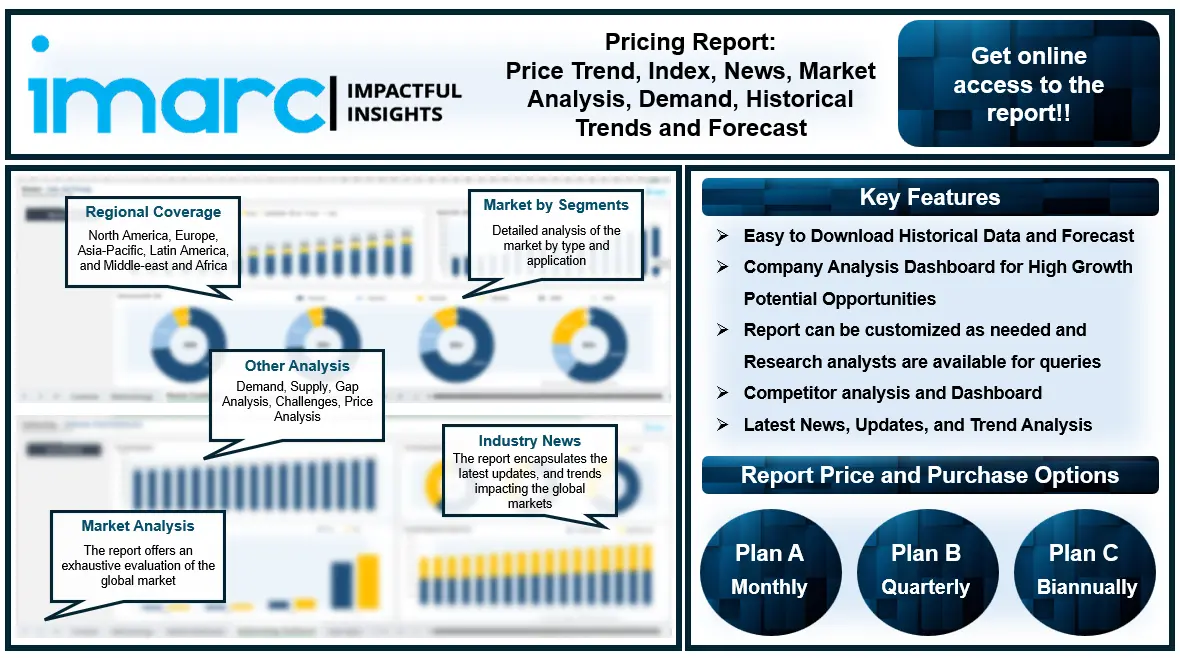
IMARC's latest publication, “2-Methylpropan-1-ol Prices, Trend, Chart, Demand, Market Analysis, News, Historical and Forecast Data Report 2026 Edition,” presents a detailed examination of the 2-methylpropan-1-ol market, providing insights into both global and regional trends that are shaping prices. This report delves into the spot price of 2-methylpropan-1-ol at major ports and analyzes the composition of prices, including FOB and CIF terms. It also presents detailed 2-methylpropan-1-ol price trend analysis by region, covering North America, Europe, Asia Pacific, Latin America, and Middle East and Africa. The factors affecting 2-methylpropan-1-ol pricing, such as the dynamics of supply and demand, regulatory developments, and industry-specific innovations, are thoroughly explored. This comprehensive report helps stakeholders stay informed with the latest market news, regulatory updates, and technological progress, facilitating informed strategic decision-making and forecasting.
2-Methylpropan-1-ol Industry Analysis
The global 2-methylpropan-1-ol market size reached USD 1,025.4 Million in 2025. By 2034, IMARC Group expects the market to reach USD 1694.0 Million, with a projected CAGR of 5.56% during 2026-2034. The market is primarily driven by the growing demand from solvent applications, the increasing requirements from coatings, adhesives, and specialty chemicals contribute to consumption growth. Stable industrial production and continued development of chemical processing industries.
Latest News and Developments:
- September 2023: Invizyne, a company based in Monrovia, California, received $3.77 million in funding from the U.S. Department of Energy to further advance its cell-free production system for the biofuel isobutanol (2-methylpropan-1-ol price). The project aims to develop an optimized cell-free process that utilizes yellow dent corn starch coupled with energy-efficient in situ separation and isolation of the product, enabling sustained production of isobutanol at high productivity over many days. The successful completion of this project will demonstrate the potential for economic and energy-efficient cell-free production of isobutanol.
- February 2023: Axens and Praj Industries Limited have signed a Memorandum of Understanding (MoU) to collaborate on Sustainable Aviation Fuel (SAF) projects in India. The partnership focuses on utilizing the ASTM-approved Alcohol-to-Jet (ATJ) pathway, which converts low-carbon ethanol and isobutanol (2-methylpropan-1-ol price) into SAF. Praj will leverage its expertise in bio-sourced feedstock production, while Axens will provide its Jetanol™ technology for the conversion process. This initiative aims to support India's decarbonization efforts in the aviation sector and promote cleaner fuels.
- January 2023: Researchers in Queensland have made significant progress in converting sugar cane into sustainable aviation fuel, enhancing the speed and efficiency of the process. This breakthrough involves creating isobutanol (2-methylpropan-1-ol price), a versatile chemical used in fuels and other products. The Queensland government is expanding a pilot plant in Mackay to support this initiative, which aims to reduce reliance on imported fuels.
Product Description
2-methylpropan-1-ol, also known as isobutanol, is a four carbon alcohol with the chemical formula C4H10O. It is a colorless liquid with a mild odor and properties including low water solubility, good solvency, and volatility. The compound is produced through chemical synthesis routes and is widely used as a solvent and chemical intermediate. It finds applications in coatings, paints, adhesives, inks, cleaning formulations, and plasticizer production. 2 methylpropan 1 ol is also used in the manufacturing of esters, which serve as ingredients in industrial and specialty chemical formulations. Its compatibility with various organic compounds makes it valuable across multiple industrial processes requiring effective solvent performance and chemical reactivity.
Report Coverage
| Key Attributes | Details |
|---|---|
| Product Name | 2-Methylpropan-1-ol |
| Report Features | Exploration of Historical Trends and Market Outlook, Industry Demand, Industry Supply, Gap Analysis, Challenges, 2-Methylpropan-1-ol Price Analysis, and Segment-Wise Assessment. |
| Currency/Units | US$ (Data can also be provided in local currency) or Metric Tons |
| Region/Countries Covered | The current coverage includes analysis at the global and regional levels only. Based on your requirements, we can also customize the report and provide specific information for the following countries: Asia Pacific: China, India, Indonesia, Pakistan, Bangladesh, Japan, Philippines, Vietnam, Thailand, South Korea, Malaysia, Nepal, Taiwan, Sri Lanka, Hongkong, Singapore, Australia, and New Zealand Europe: Germany, France, United Kingdom, Italy, Spain, Russia, Turkey, Netherlands, Poland, Sweden, Belgium, Austria, Ireland, Switzerland, Norway, Denmark, Romania, Finland, Czech Republic, Portugal and Greece North America: United States and Canada Latin America: Brazil, Mexico, Argentina, Columbia, Chile, Ecuador, and Peru Middle East & Africa: Saudi Arabia, UAE, Israel, Iran, South Africa, Nigeria, Oman, Kuwait, Qatar, Iraq, Egypt, Algeria, and Morocco The list of countries presented is not exhaustive. Information on additional countries can be provided if required by the client. |
| Information Covered for Key Suppliers |
|
| Customization Scope | The report can be customized as per the requirements of the customer |
| Report Price and Purchase Option |
Plan A: Monthly Updates - Annual Subscription
Plan B: Quarterly Updates - Annual Subscription
Plan C: Biannually Updates - Annual Subscription
|
| Post-Sale Analyst Support | 360-degree analyst support after report delivery |
| Delivery Format | PDF and Excel through email (We can also provide the editable version of the report in PPT/Word format on special request) |
Key Benefits for Stakeholders:
- IMARC’s report presents a detailed analysis of 2-methylpropan-1-ol pricing, covering global and regional trends, spot prices at key ports, and a breakdown of Ex Works, FOB, and CIF prices.
- The study examines factors affecting 2-methylpropan-1-ol price trend, including raw material costs, supply-demand shifts, geopolitical impacts, and industry developments, offering insights for informed decision-making.
- The competitive landscape review equips stakeholders with crucial insights into the latest market news, regulatory changes, and technological advancements, ensuring a well-rounded, strategic overview for forecasting and planning.
- IMARC offers various subscription options, including monthly, quarterly, and biannual updates, allowing clients to stay informed with the latest market trends, ongoing developments, and comprehensive market insights. The 2-methylpropan-1-ol price charts ensure our clients remain at the forefront of the industry.
Need more help?
- Speak to our experienced analysts for insights on the current market scenarios.
- Include additional segments and countries to customize the report as per your requirement.
- Gain an unparalleled competitive advantage in your domain by understanding how to utilize the report and positively impacting your operations and revenue.
- For further assistance, please connect with our analysts.
 Request Customization
 Inquire Before Buying
 Speak to an Analyst
 Request Brochure
Benefits of Customization
- Personalize this research
- Triangulate with your data
- Get data as per your format and definition
- Gain a deeper dive into a specific application, geography, customer, or competitor
- Any level of personalization
Get in Touch With Us
UNITED STATES
Phone: +1-201-971-6302
INDIA
Phone: +91-120-433-0800
UNITED KINGDOM
Phone: +44-753-714-6104
Email: [email protected]
Client Testimonials




.webp)




.webp)













Related Reports

Why Choose Us
IMARC offers trustworthy, data-centric insights into commodity pricing and evolving market trends, enabling businesses to make well-informed decisions in areas such as procurement, strategic planning, and investments. With in-depth knowledge spanning more than 1000 commodities and a vast global presence in over 150 countries, we provide tailored, actionable intelligence designed to meet the specific needs of diverse industries and markets.
1000
+Commodities
150
+Countries Covered
3000
+Clients
20
+Industry

Robust Methodologies & Extensive Resources
IMARC delivers precise commodity pricing insights using proven methodologies and a wealth of data to support strategic decision-making.

Subscription-Based Databases
Our extensive databases provide detailed commodity pricing, import-export trade statistics, and shipment-level tracking for comprehensive market analysis.

Primary Research-Driven Insights
Through direct supplier surveys and expert interviews, we gather real-time market data to enhance pricing accuracy and trend forecasting.

Extensive Secondary Research
We analyze industry reports, trade publications, and market studies to offer tailored intelligence and actionable commodity market insights.
Trusted by 3000+ industry leaders worldwide to drive data-backed decisions. From global manufacturers to government agencies, our clients rely on us for accurate pricing, deep market intelligence, and forward-looking insights.