
Air Quality Monitoring Market Size, Share, Trends and Forecast by Product Type, Pollutant, Sampling Method, End-User, and Region 2026-2034
Global Air Quality Monitoring Market Size, Share, Trends & Forecast (2026-2034)
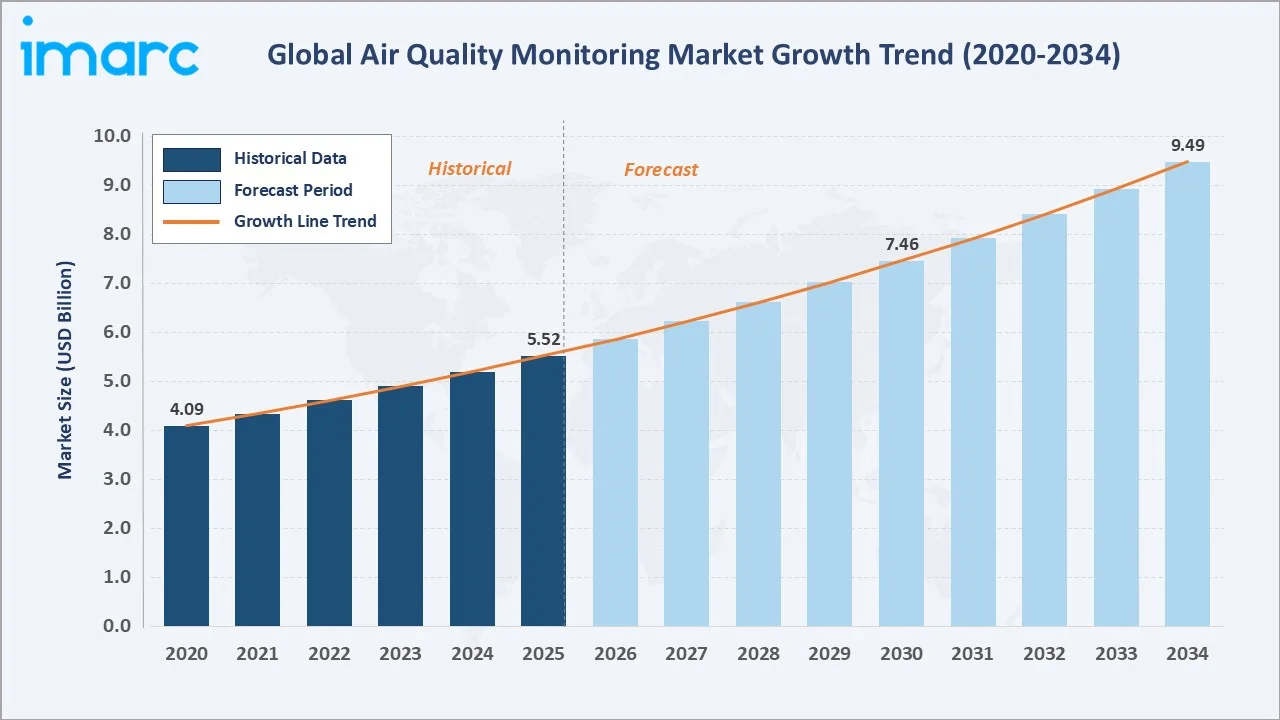
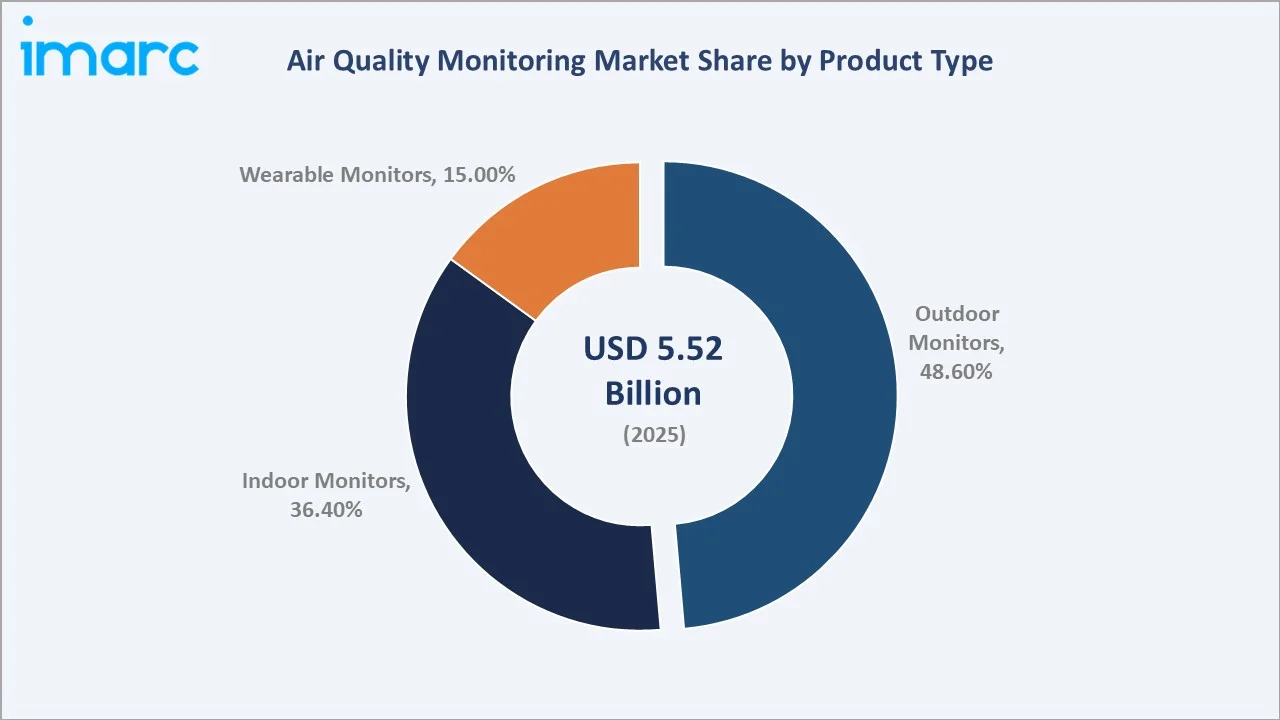
The global air quality monitoring market was valued at USD 5.52 Billion in 2025 and is projected to reach USD 9.49 Billion by 2034, expanding at a CAGR of 6.20% during the forecast period (2026-2034). The market is driven by tightening environmental regulations, surging industrial pollution concerns, and rapid IoT-enabled sensor adoption.
Market Snapshot
|
Metric |
Value |
|
Market Size (2025) |
USD 5.52 Billion |
|
Forecast Market Size (2034) |
USD 9.49 Billion |
|
CAGR (2026-2034) |
6.20% |
|
Base Year |
2025 |
|
Historical Period |
2020-2025 |
|
Largest Region |
North America (34.6% share, 2025) |
|
Fastest Growing Region |
Asia Pacific (est. CAGR ~8.1%) |
|
Largest Segment (Product) |
Outdoor Monitors (48.6% share, 2025) |
|
Dominant Pollutant Segment |
Chemical Pollutant (52.4% share, 2025) |
Outdoor monitors lead product segments with a 48.6% share (2025), while chemical pollutant monitoring dominates the pollutant segment at 52.4%. North America holds the largest regional share at 34.6%, anchored by the U.S. EPA’s stringent National Ambient Air Quality Standards (NAAQS).
To get more information on this market, Request Sample
The market has expanded from USD 4.09 Billion in 2020 to USD 5.52 Billion in 2025, driven by post-pandemic indoor air quality awareness and smart-city investments. The forecast trajectory through 2034 reflects accelerating regulatory mandates, wearable monitor adoption, and AI-driven data analytics integration.
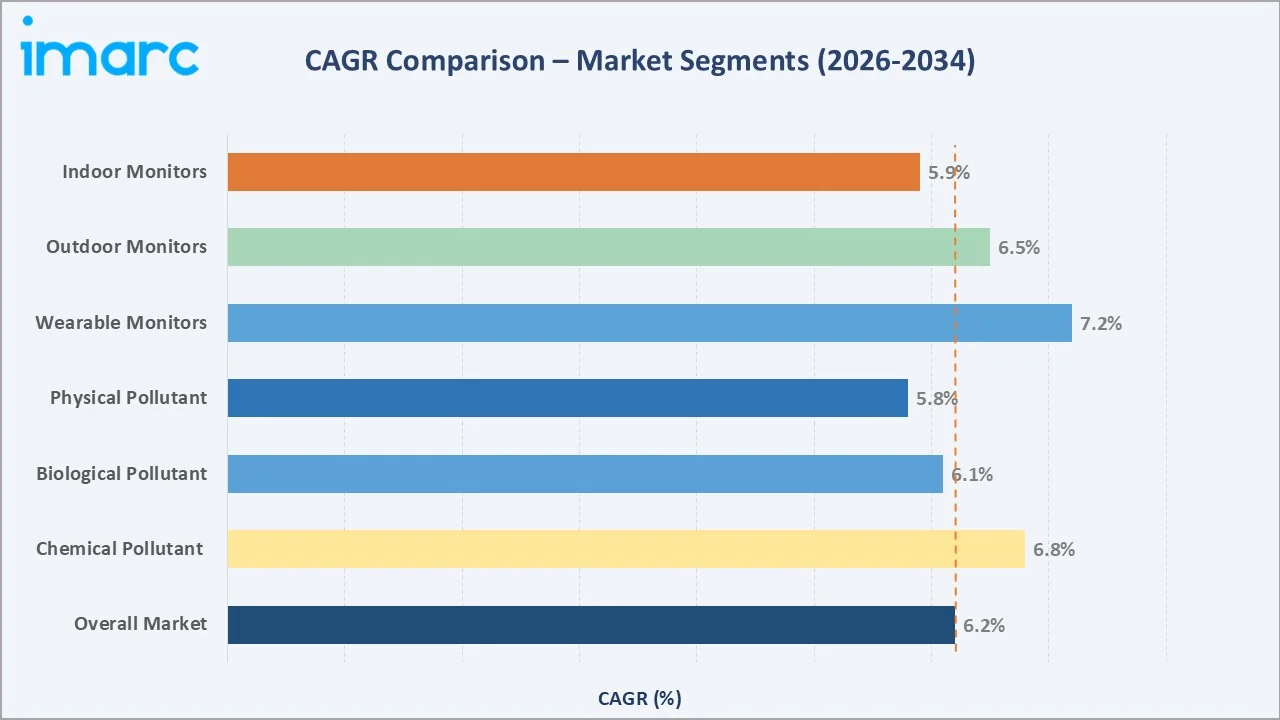
Wearable monitors lead segment growth at an estimated 7.2% CAGR, while Chemical Pollutant monitoring grows at 6.8, reflecting personal health monitoring trends and chemical emission compliance needs.
Executive Summary
The global air quality monitoring market is undergoing a transformative growth phase driven by stricter regulatory frameworks, heightened public health awareness, and rapid technological advances. Valued at USD 5.52 Billion in 2025, the market is forecast to reach USD 9.49 Billion by 2034 at a CAGR of 6.20%.
Outdoor monitors command the largest product share at 48.6% (2025), essential for regulatory compliance and urban air quality networks. Indoor monitors at 36.4% are experiencing accelerating adoption in commercial buildings and healthcare facilities following heightened post-COVID-19 awareness of indoor air quality.
Wearable monitors, though still the smallest segment at 15.0%, exhibit the fastest growth trajectory, driven by personal health consciousness and athlete performance monitoring. Chemical pollutant monitoring leads at 52.4%, reflecting industrial emission compliance needs for gases such as NO₂, SO₂, CO, and volatile organic compounds.
North America dominates with 34.6% of global revenues (2025), supported by rigorous EPA compliance requirements and advanced smart-city infrastructure. Asia Pacific emerges as the fastest-growing region at an estimated CAGR of ~8.1% through 2034, propelled by China and India’s massive pollution control investments and rapid industrialization.
Key Market Insights
|
Insight |
Data |
|
Largest Product Segment |
Outdoor Monitors – 48.6% share (2025) |
|
Fastest Growing Product |
Wearable Monitors – est. CAGR ~7.2% (2026-2034) |
|
Dominant Pollutant Segment |
Chemical Pollutant – 52.4% share (2025) |
|
Leading Region |
North America – 34.6% revenue share (2025) |
|
Fastest Growing Region |
Asia Pacific – est. CAGR ~8.1% (2026-2034) |
|
Top Companies |
Thermo Fisher Scientific, Honeywell International Inc., Siemens Aktiengesellschaft, Emerson Electric, and Teledyne Technologies |
Key Analytical Observations:
- Outdoor Monitor dominance: The 48.6% share (2025) reflects government-mandated ambient air quality networks. The California Ambient Air Monitoring Network includes over 250 monitoring stations managed by federal, state, and local agencies. Municipal and national agencies drive recurring capital and maintenance expenditure.
- Chemical Pollutant leadership: The 52.4% share reflects industrial compliance requirements for PM₂.₅, PM₁₀, NO₂, SO₂, CO, and VOC detection. Petrochemical and power generation industries are the primary demand drivers, operating under mandatory continuous emission monitoring systems (CEMS).
- Wearable Monitor acceleration: Data from the Rock Health Digital Health Consumer Adoption Survey stated that out of 23,974 respondents, 10,679 (44.5%) owned wearables. Ownership was more common among younger individuals, those with higher incomes and education levels, and those living in urban areas.
- North America market maturity: The 34.6% regional share (2025) is underpinned by the U.S. Clean Air Act, EPA’s NAAQS program, and over USD 1.8 Billion in federal environmental monitoring expenditure annually. The region maintains the highest per-capita density of monitoring infrastructure globally.
- Asia Pacific momentum: Launched in January 2019, the National Clean Air Programme (NCAP) aims to improve air quality in 131 cities across 24 states and UTs, focusing on non-attainment and Million Plus Cities.
Global Air Quality Monitoring Market Overview
Air quality monitoring encompasses the systematic measurement, analysis, and reporting of atmospheric pollutants, including particulate matter (PM₂.₅, PM₁₀), gaseous pollutants (NO₂, SO₂, CO, O₃), volatile organic compounds (VOCs), heavy metals, and biological agents. The industry spans sensor manufacturing, system integration, data analytics platforms, and compliance reporting services, serving government agencies, industrial operators, healthcare facilities, research institutions, and increasingly, individual consumers through wearable devices.
Approximately 99% of the global population breathes air exceeding WHO air quality guidelines (2024 WHO data), creating an immense unmet need for monitoring infrastructure. The economic cost of air pollution is estimated at USD 8.1 trillion annually in health-related losses (OECD, 2024). Smart-city programs in over 120 countries are embedding AQM infrastructure into urban planning frameworks, generating multi-year procurement programs for hardware, software, and maintenance services.
Market Dynamics
To evaluate market opportunities, Request Sample
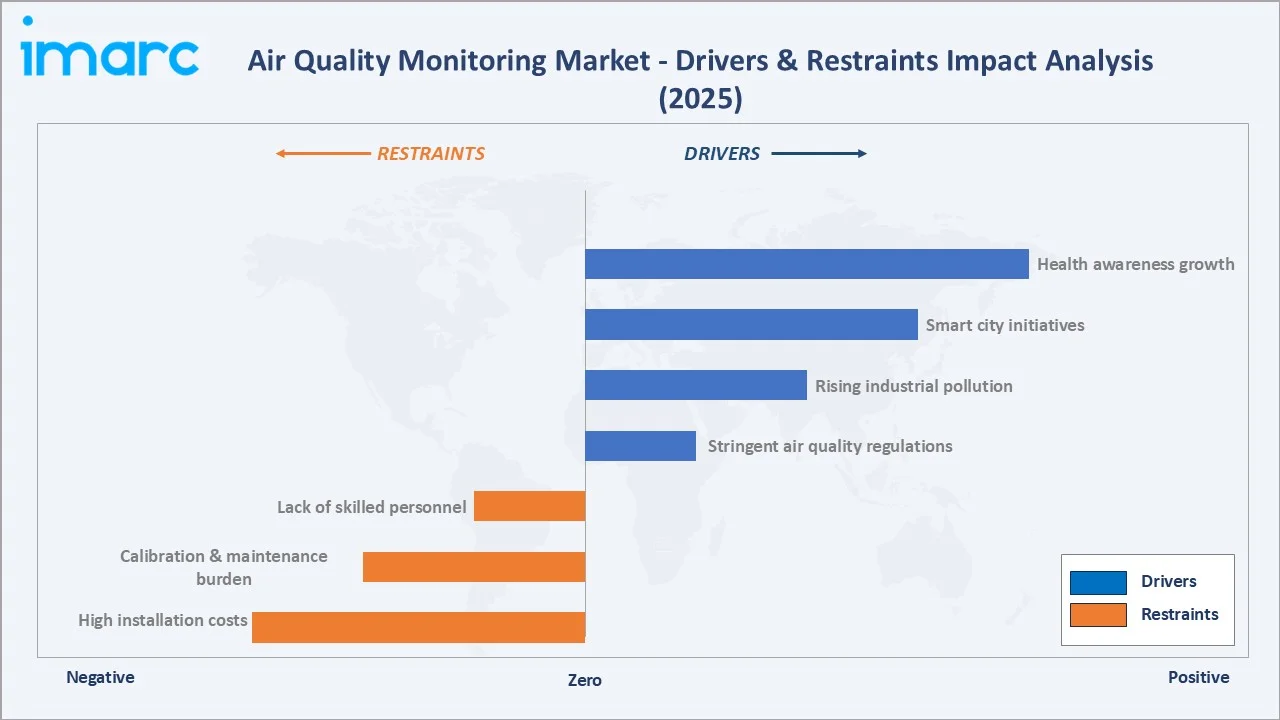
Market Drivers
- Stringent Air Quality Regulations: The U.S. EPA’s 2024 established the primary (health-based) annual PM2.5 standard at 9.0 micrograms per cubic meter to enhance public health protection, in line with the latest health science. The EU’s Zero Pollution Action Plan targets 55% reduction in premature deaths from air pollution by 2030, driving new monitor procurement across all 27 member states.
- Rising Industrial Pollution and Compliance Mandates: Continuous Emission Monitoring Systems (CEMS) are legally required in power plants, cement factories, steel mills, and petrochemical facilities across 65+ countries, generating baseline recurring equipment demand independent of market cycles.
- Smart City and IoT Integration: Cities around the world invest more than USD 124 billion each year in AI dashboards and sensor infrastructure. AQM sensor networks represent a key node in digital-twin urban management platforms, with 43 cities globally having deployed city-wide real-time AQM mesh networks as of 2025.
These drivers collectively create a structurally expanding market with both regulatory-pull and consumer-push demand vectors operating simultaneously, ensuring market resilience across economic cycles.
Market Restraints
- High Capital and Maintenance Costs: Each reference-grade continuous monitoring station costs around Rs 1 crore (approximately $120,000) to install and maintain. This limits adoption in low-income regions and creates procurement barriers for smaller municipalities and developing economies.
- Calibration Complexity and Data Quality: Low-cost electrochemical sensors exhibit significant cross-sensitivity to temperature, humidity, and interfering gases. Field performance can deviate 30–50% from laboratory specifications, requiring co-location studies and correction algorithms. Data reliability concerns slow regulatory acceptance of lower-cost monitoring solutions.
- Skilled Workforce Shortage: The operation of advanced mass spectrometry, gas chromatography, and optical monitoring systems requires specialized technical expertise. U.S. faces a shortage of more than 110,000 qualified HVAC technicians, constraining the network expansion pace.
Market Opportunities
- AI and Machine Learning Integration: According to a study published, an automated machine‑learning air quality forecasting system developed can effectively predict daily concentrations of six major pollutants and often outperforms traditional numerical models, demonstrating strong potential for application in environmental meteorology.
- Wearable AQM and Personal Health Monitoring: The global wearables technology market accounted for USD 82.3 billion in 2025, providing an established distribution channel for integrated AQM functionality. Partnerships between AQM specialists and major wearable device OEMs represent a high-growth opportunity.
- Emerging Markets Infrastructure Build-Out: The union government of India launched the National Clean Air Programme (NCAP) to improve air quality in 131 'non-attainment cities'. In 2022, the target was revised to a 40% reduction or meeting the national standards (annual average of 60 µg/m³) by 2025-26.
Market Challenges
- Sensor Drift and Field Calibration: Electrochemical and optical sensors experience performance degradation over time, requiring regular field calibration. In large networks, calibration logistics represent a significant operational burden, with calibration-related downtime averaging 8–12% of annual monitoring hours in major urban networks.
- Data Standardization and Interoperability: Multiple competing data formats, communication protocols (LoRaWAN, NB-IoT, Zigbee, cellular), and software platforms reduce interoperability between monitoring networks. The absence of universal AQM data standards complicates multi-city and cross-border data aggregation and comparison.
Emerging Market Trends
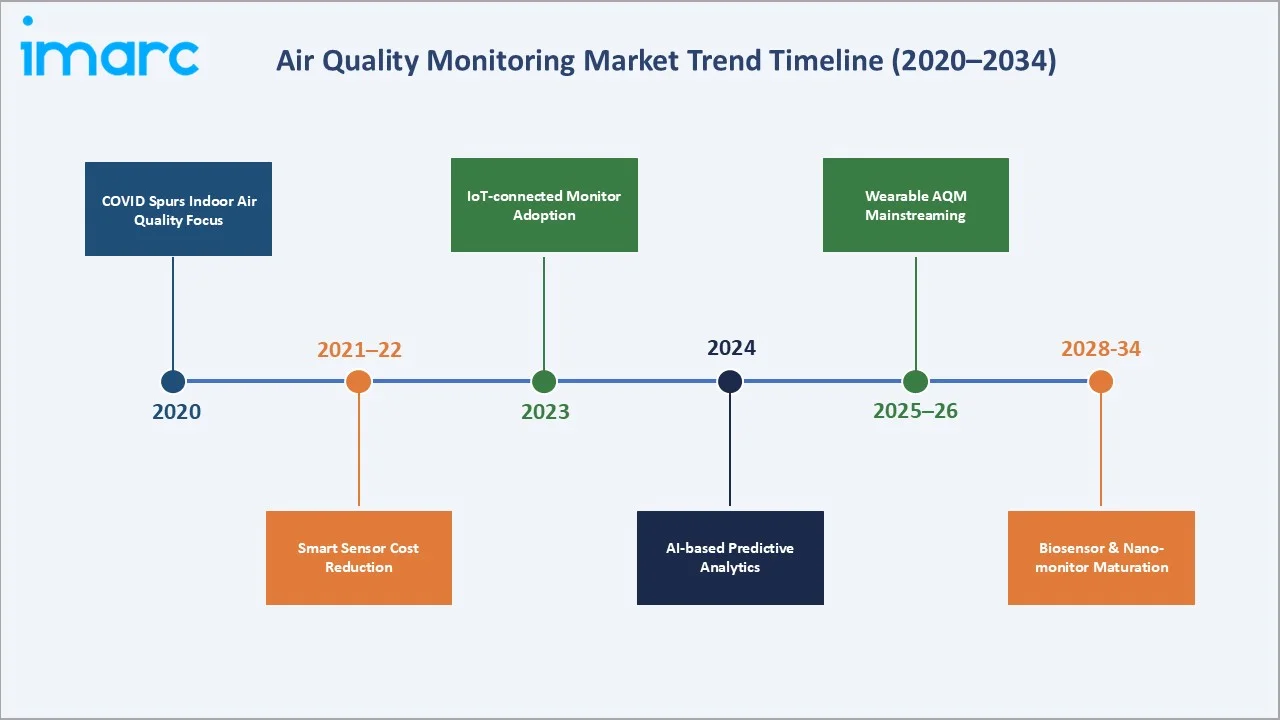
1. Satellite Remote Sensing Integration
The launch of Sentinel-5P and subsequent ESA Copernicus missions have enabled near-real-time tropospheric NO₂, SO₂, and aerosol optical depth monitoring at 3.5–7 km resolution globally. Ground-station networks are increasingly being fused with satellite data to create multi-scale AQM systems, improving spatial coverage and model validation. This hybrid approach is being adopted by the EU, U.S. EPA, and China MEE by 2025.
2. AI-Powered Predictive Analytics
Machine learning models trained on multi-year AQM time-series data are achieving 24-hour PM₂.₅ forecasting accuracy of 88–92% in urban environments. Several AQM vendors have embedded AI forecast engines into their cloud platforms, with Thermo Fisher Scientific and Honeywell International both launching AI-enhanced AQM data analytics products in 2024–2025.
3. Wearable and Personal AQM Devices
Consumer-grade wearable AQM monitors entered the mainstream in 2023–2025. Devices capable of measuring PM₂.₅, VOCs, CO₂, temperature, and humidity are available at USD 100–400 retail price points. The integration of AQM data into health app ecosystems (Apple Health, Google Fit, Samsung Health) is accelerating adoption, with an estimated 8 million personal AQM devices sold globally in 2024.
4. Green Building and Indoor Air Quality Standards
LEED v4.1, WELL Building Standard v2, and RESET Air certification programs now require continuous indoor AQM monitoring. These standards influence over 2 billion sq ft of commercial real estate globally, with mandatory continuous AQM creating persistent equipment demand across the commercial construction and renovation sectors.
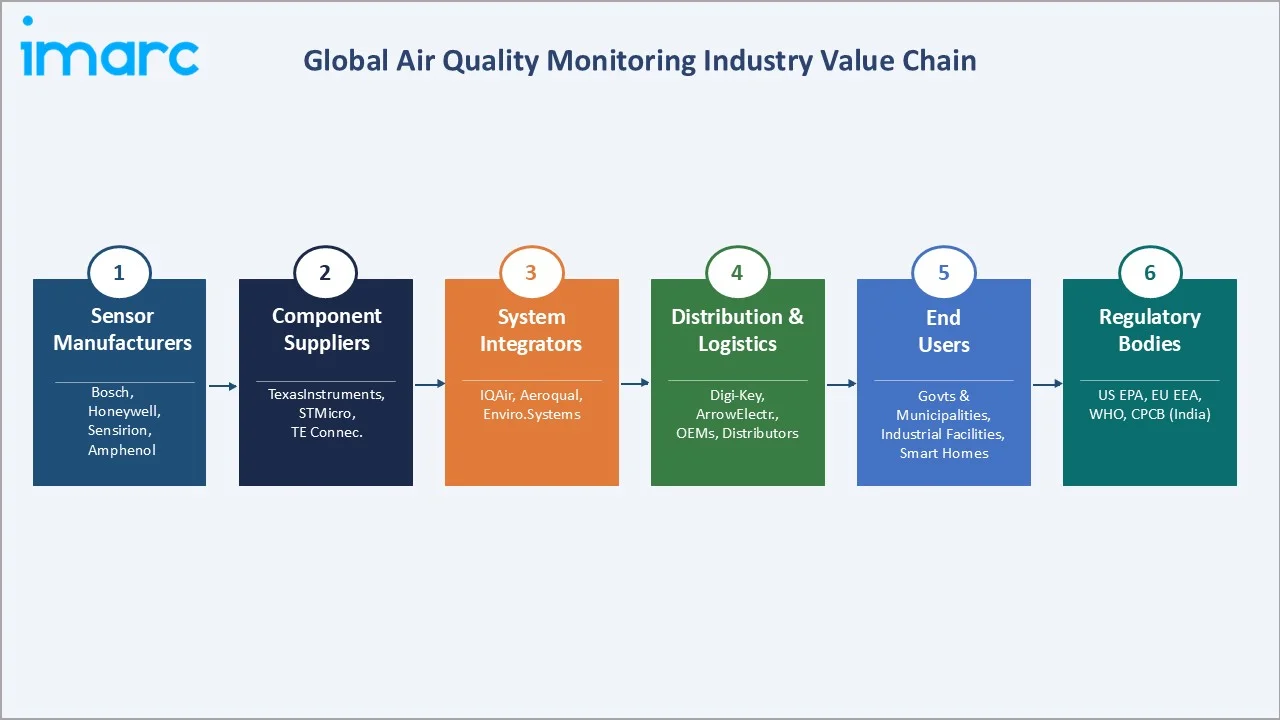
Industry Value Chain Analysis
|
Stage |
Key Players / Examples |
Role |
|
Raw Materials & Components |
Sensirion, Figaro Engineering, Zhengzhou Winsen Electronics Technology Co., Ltd. |
Electrochemical cells, optical components, MEMS sensors, signal conditioning ICs |
|
Sensor & Instrument Manufacturing |
Thermo Fisher Scientific, Horiba, Teledyne Technologies, TSI Incorporated, Aeroqual |
Precision analytical instruments, reference monitors, and low-cost sensor modules |
|
System Integration & Assembly |
Siemens AG, Emerson Electric, Honeywell International |
CEMS, multi-parameter monitoring stations, data acquisition systems, network design |
|
Software & Data Analytics |
Envirosuite, Clarity Movement |
Cloud AQM platforms, AI analytics, regulatory reporting dashboards, mobile apps |
|
Distribution & Logistics |
Distributor networks, direct sales, OEM channels, and environmental consultancies |
Channel management, project delivery, site survey, system commissioning |
|
Deployment & Installation |
EPC contractors, environmental engineering firms, and government agencies |
Site preparation, equipment installation, network commissioning, calibration |
|
Operations & End Users |
Government agencies, petrochemical/power plants, commercial buildings, and individuals |
Continuous monitoring, compliance reporting, public health management, and research |
The industry is witnessing a shift from hardware-centric to data-and-services-centric value creation. Leading vendors are investing in proprietary cloud AQM analytics platforms that generate recurring revenue through multi-year software subscriptions, significantly improving business model predictability and margin profiles versus one-time hardware sales.
Technology Landscape in the Air Quality Monitoring Industry
Sensing Technologies
The industry deploys multiple parallel sensing technologies optimized for different pollutants, accuracy requirements, and cost profiles. Optical particle counters (OPCs) using laser scattering are the standard for particulate matter (PM₂.₅, PM₁₀) detection. Fluorescence UV analyzers are the reference standard for SO₂, while chemiluminescence detectors are the regulatory standard for NO₂ across North America and Europe.
IoT and Connectivity Infrastructure
Next-generation AQM networks leverage multi-protocol connectivity, including LoRaWAN (low-power wide-area), NB-IoT (narrowband IoT), cellular (4G/5G), and Wi-Fi, depending on deployment context. Edge computing modules embedded in monitoring stations enable local pre-processing, reducing data transmission costs by 40–70% while enabling near-real-time alerting.
Miniaturization and Nano-Sensor Development
MEMS-based gas sensors are reducing AQM module sizes by 80% compared to 2015 benchmarks while maintaining analytical performance suitable for wearable applications. Carbon nanotube and graphene-based chemiresistive sensors under development promise ppb-level VOC sensitivity at room temperature without heating elements, potentially enabling sub-USD 20 disposable AQM modules by 2030.
Digital Twin and AI Analytics
Digital-twin air quality models integrate real-time sensor data with computational fluid dynamics (CFD) simulations to map pollutant concentration fields at 10–50 meter spatial resolution within urban environments. Honeywell International’s Forge platform and Siemens’ Xcelerator ecosystem both incorporate digital-twin AQM capabilities, enabling predictive pollution forecasting and source apportionment at the district scale.
Market Segmentation Analysis
The report covers the following segments:
|
Segment Category |
Leading Segment |
Market Share |
Year |
|
Product Type |
Outdoor Monitors |
48.6% |
2025 |
|
Pollutant |
Chemical Pollutant |
52.4% |
2025 |
|
Sampling Method |
Active/Continuous Monitoring |
🔒 |
2025 |
|
End-User |
🔒 |
🔒 |
2025 |
|
Region |
North America |
34.6% |
2025 |

By Product Type
The air quality monitoring market by product type is segmented into outdoor monitors, indoor monitors, and wearable monitors. Outdoor monitors hold the dominant position with a 48.6% share (2025), driven by mandatory regulatory ambient air quality networks, smart-city deployments, and industrial fence-line monitoring requirements.
To access detailed market analysis, Request Sample
Indoor monitors (36.4%, 2025) are gaining significant momentum following COVID-19-driven awareness of indoor air quality’s impact on health and productivity. LEED v5 introduces a major shift toward proactive indoor air management, placing greater emphasis on continuous testing, monitoring, and performance‑based verification of indoor air quality rather than one‑time compliance checks.
By Pollutant
The pollutant segmentation reflects the relative abundance, regulatory priority, and commercial monitoring requirements for different categories of airborne contaminants. Chemical pollutants command the largest share at 52.4% (2025), driven by the primacy of gaseous and particulate chemical monitoring in both regulatory and industrial compliance applications.
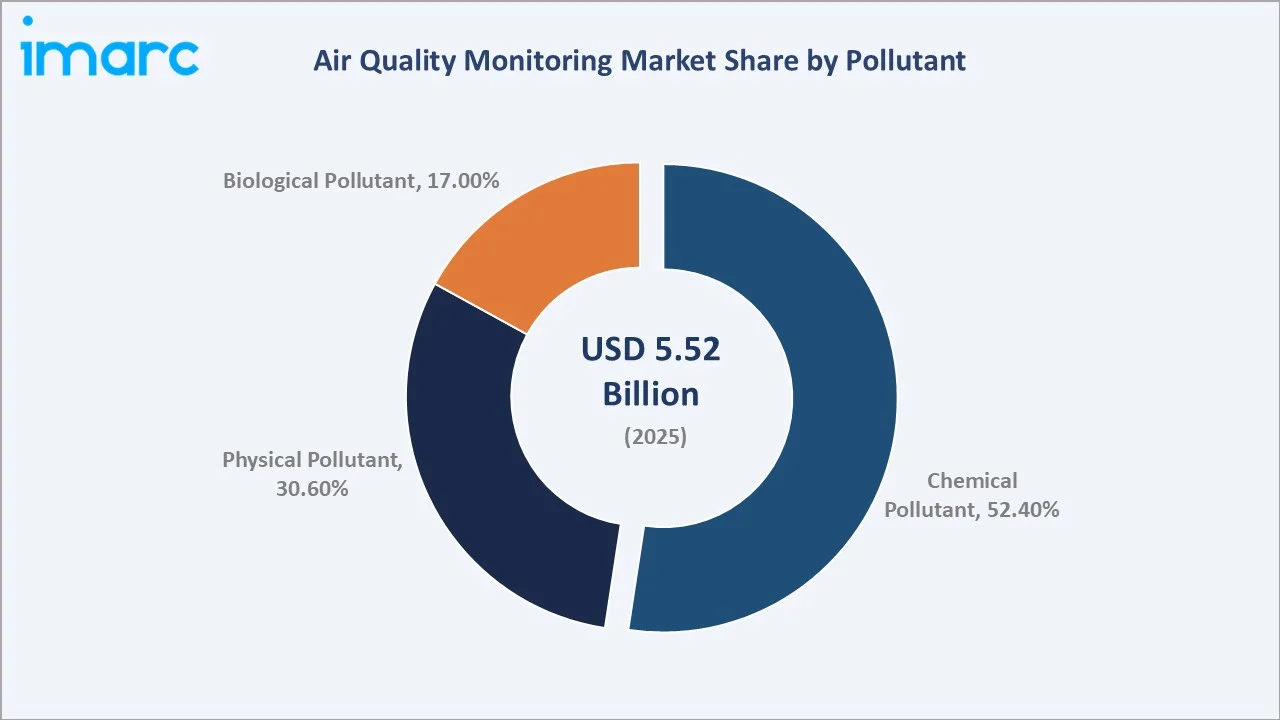
Physical pollutant (30.6%, 2025) monitoring covers noise pollution, electromagnetic radiation, thermal pollution, and radioactive particulates. While smaller than chemical monitoring, this segment benefits from urban noise-combined-with-air-quality monitoring networks, particularly in European cities complying with the EU Environmental Noise Directive.
Regional Market Insights
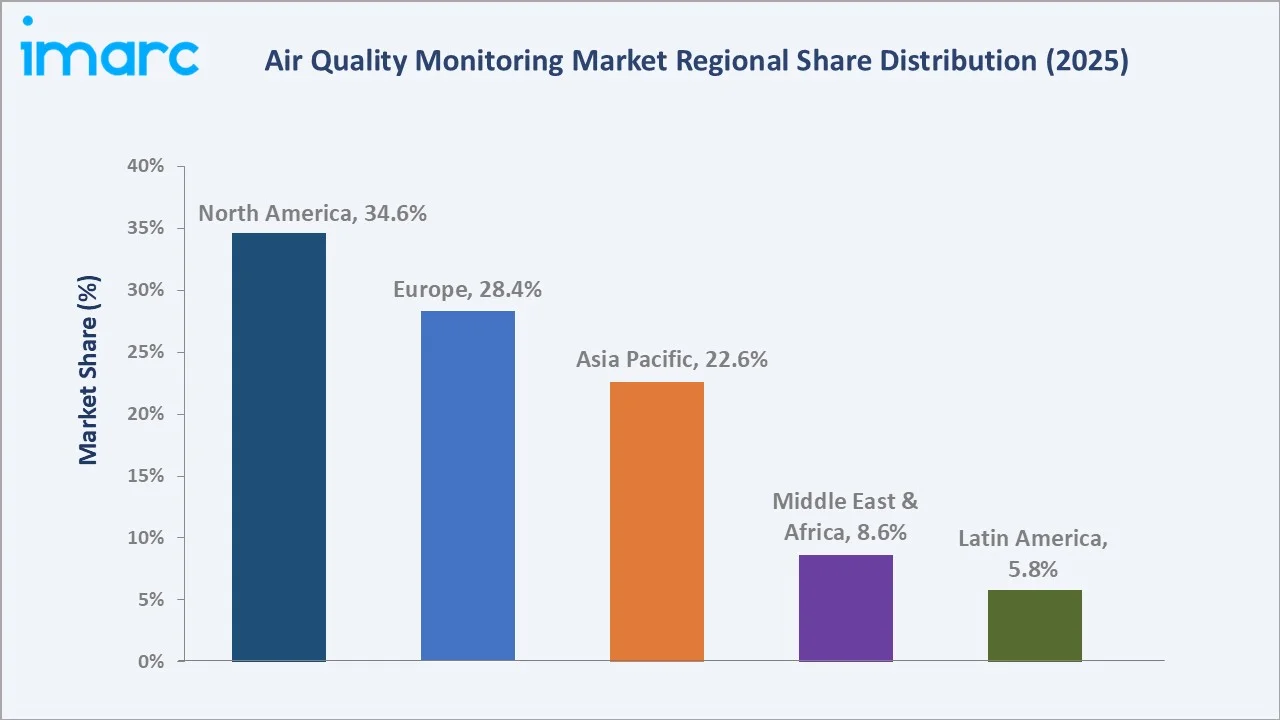
North America’s 34.6% share (2025) is underpinned by one of the world’s most comprehensive AQM regulatory infrastructures. The U.S. EPA’s 2024 lowering of the PM₂.₅ annual standard to 9 μg/m³ will require an estimated 300+ additional regulatory monitor sites, generating USD 150–250 Million in incremental equipment procurement through 2028.
|
Region |
Share (2025) |
Key Drivers |
Regulatory Impact |
|
North America |
34.6% |
EPA NAAQS compliance, smart-city programs, industrial CEMS requirements, and high per-capita AQM infrastructure investment |
U.S. Clean Air Act, EPA 2024 PM₂.₅ revision, Canada’s AQHI framework |
|
Europe |
28.4% |
EU Zero Pollution Action Plan, Urban Mobility Green Deal, industrial emission trading scheme, CEMS requirements |
EU Ambient Air Quality Directive (2023 revision), EU CEMS standards (EN 14181) |
|
Asia Pacific |
22.6% |
China Blue Sky Initiative, India NCAP, rapid industrialization, mega-city expansion, coal power monitoring |
China MEE standards, India CPCB guidelines, Australia NEPM, Japan Air Pollution Control Act |
|
Middle East & Africa |
8.6% |
Petrochemical industry expansion, Vision 2030 smart-city programs (Saudi Arabia, UAE), refinery CEMS |
GCC air quality standards, South Africa NEMA, NCEC (Saudi Arabia) |
|
Latin America |
5.8% |
Brazil air quality program, Colombia green economy, and mining sector compliance |
CONAMA (Brazil), IDEAM (Colombia), Chile DS 59/DS 138 |
Asia Pacific at 22.6% (2025) is the fastest-growing region at an estimated CAGR of ~8.1% through 2034. China reported its highest-ever share of days with good air quality in 2025, with 89.3 % of days rated “good” or “excellent” and the national average PM2.5 concentration dropping to 28 µg/m³, reflecting continuous environmental improvements over recent years. Over the past five years, PM2.5 levels have fallen about 20 % and heavily polluted days have decreased by 25 %, while water quality has also improved significantly.
Competitive Landscape
The global air quality monitoring market is moderately concentrated, with the top five players, Thermo Fisher Scientific, Honeywell International Inc., Siemens Aktiengesellschaft, Emerson Electric, and Teledyne Technologies, collectively accounting for an estimated 38–44% of global revenues (2025). The market’s dual structure, with high-specification regulatory instruments at the premium end and proliferating low-cost IoT sensor networks at the volume end, supports both large diversified instruments companies and specialized monitoring firms.
|
Company Name |
Market Position |
Primary Brands/Products |
Key Market |
Core Strength |
|
Thermo Fisher Scientific |
Global Leader |
5014i, 42i, 43i, 48i, 49i iSeries analysers, TEOM, and pDR |
North America, Europe |
Widest reference-grade analyzer portfolio; FDA & EPA approved instruments |
|
Honeywell International Inc. |
Global Leader |
MIDAS, Sensepoint |
North America, Asia |
Industrial gas detection + IoT platform; AI analytics integration |
|
Siemens Aktiengesellschaft |
Global Leader |
ULTRAMAT, OXYMAT, Calomat |
Europe, Asia Pacific |
Process AQM & CEMS integration; digital-twin Xcelerator platform |
|
Emerson Electric |
Strong Challenger |
Rosemount and X-STREAM |
North America, MEA |
CEMS & petrochemical process monitoring; 5G IIoT connectivity |
|
Teledyne Technologies |
Strong Challenger |
API Series, T200, T300, T400 |
North America, Europe |
Regulatory-grade photometric analyzers; UV fluorescence & chemiluminescence |
|
Horiba |
Challenger |
APMA, APOA, APSA series |
Asia Pacific, Europe |
Comprehensive CEMS portfolio; automotive emissions expertise |
|
3M Company |
Challenger |
3M Safety Monitors |
Global |
Personal and industrial safety monitoring; wearable AQM devices |
|
Aeroqual |
Emerging Leader |
Series 200, 300, 500, AQS 1 |
Global (low-cost networks) |
Lowest cost-per-node for urban sensor networks; 40+ city deployments |
The competitive landscape is evolving as traditional analytical instrument companies face pressure from low-cost IoT sensor network providers. Companies such as Aeroqual and Clarity Movement have demonstrated that dense networks of USD 1,000–5,000 sensor nodes can provide actionable air quality data for urban management, competing with high-cost reference-monitor networks for certain regulatory applications.
Key Company Profiles
Thermo Fisher Scientific
Thermo Fisher Scientific, headquartered in Waltham, Massachusetts, USA, is the world’s largest scientific instrument company with annual revenues exceeding USD 42.88 Billion (2024). Its Environmental and Process Monitoring division leads the global regulatory-grade AQM market.
- Product Portfolio: Ambient air monitors (Model 5014i PM₂.₅, TEOM 1405 series, 42i NO-NO₂-NOx, 43i SO₂, 48i CO, 49i O₃), weather stations, data acquisition systems, mobile monitoring vehicles, and multi-point remote sensing systems.
- Recent Developments: Expanded particulate monitoring portfolio with low-cost Partisol FRM sampler for developing-market regulatory networks.
- Strategic Focus: Consolidating leadership in regulatory reference-grade monitoring while expanding into IoT-enabled lower-cost network solutions. Growing SaaS revenues from EPA and EN-compliant cloud data platforms to increase recurring revenue contribution to 35% of the AQM segment by 2027.
Honeywell International Inc.
Honeywell International, headquartered in Charlotte, North Carolina, USA, is a diversified technology and manufacturing company with annual revenues of USD 38.49 Billion (2024). Its Safety and Productivity Solutions division offers one of the broadest industrial and commercial AQM portfolios globally.
- Product Portfolio: Industrial gas detection systems (Sensepoint XCD, GasAlert Extreme), MIDAS gas monitoring network for semiconductor fabs, BACnet-connected indoor AQM systems for building automation, and Forge AQM cloud analytics platform with AI forecasting.
- Recent Developments: Launched Honeywell Forge Environmental Intelligence platform in Q1 2024, integrating real-time AQM sensor data with predictive AI analytics and regulatory reporting automation. Expanded MIDAS sensor library to cover 60+ toxic industrial chemicals.
- Strategic Focus: Transitioning from hardware-centric to outcomes-based environmental monitoring services. Building Forge platform into a multi-billion-dollar SaaS business with AQM as a core data stream, targeting 40% recurring revenue from software and services by 2028.
Siemens Aktiengesellschaft
Siemens AG, headquartered in Munich, Germany, is a global technology company with revenues of EUR 75.9 Billion (FY2024). Its Process Instrumentation division supplies CEMS and process AQM equipment to industrial customers worldwide, while Siemens Xcelerator provides the digital platform for smart-city AQM integration.
- Product Portfolio: ULTRAMAT 23/6 multi-component analyzers (CO, CO₂, NO, SO₂, CH₄), OXYMAT oxygen analyzers, Calomat hydrogen analyzers, SITRANS flow meters for stack applications, and Xcelerator city AQM management platform.
- Recent Developments: Extended Xcelerator AQM module to support integration with Copernicus satellite air quality data in 2024, enabling hybrid ground-satellite AQM systems for European smart-city customers. Signed AQM network agreements with three major German cities in 2025.
- Strategic Focus: Positioning Siemens Xcelerator as the preferred digital platform for city-scale AQM management in Europe. Growing process CEMS revenues in the Asia Pacific through joint ventures and local partnerships with Chinese industrial automation companies.
Teledyne Technologies
Teledyne Technologies, headquartered in Thousand Oaks, California, USA, generates annual revenues of USD 5.67 Billion (2024) with its FLIR, Teledyne API, and environmental monitoring divisions supplying analytical instruments to regulatory agencies and research institutions globally.
- Product Portfolio: API Series ambient air analyzers (T300 CO, T400 photometric O₃, T500U cavity attenuated phase shift NO₂), CEMS racks, mobile monitoring vehicles, and Teledyne FLIR gas imaging cameras for leak detection and open-path monitoring.
- Recent Developments: Launched T500U CAPS NO₂ analyzer, providing 5x lower detection limits versus chemiluminescence methods, adopted as reference standard by several European national monitoring networks in 2024. Expanded FLIR open-path AQM product range for industrial fence-line monitoring.
- Strategic Focus: Strengthening position in regulatory reference-grade monitoring for North American and European government agencies. Leveraging FLIR thermal imaging and gas detection technology for integrated optical remote sensing AQM solutions addressing industrial leakage detection.
Market Concentration Analysis
The global air quality monitoring market exhibits moderate concentration, with the top five players, Thermo Fisher Scientific, Honeywell International Inc., Siemens Aktiengesellschaft, Emerson Electric, and Teledyne Technologies, collectively accounting for approximately 38–44% of global revenues (2025).
The mid-market tier, occupied by specialists such as Horiba, TSI Incorporated, Aeroqual, and Tisch Environmental, collectively accounts for an estimated 25–30% of global revenues. These companies differentiate through technical specialization, particularly in novel sensing technologies, niche pollutant detection, and low-cost sensor network deployment expertise.
M&A activity is intensifying as large instrument companies seek to acquire IoT-native AQM sensor network capabilities. Honeywell’s acquisition strategy targets software and connectivity companies to strengthen Forge platform capabilities. Spectris plc has pursued similar adjacent technology acquisitions within its environmental sensing portfolio.
Investment & Growth Opportunities
Fastest Growing Segments
Wearable monitors (est. CAGR ~7.2%) and chemical pollutant monitoring (est. CAGR ~6.8%) represent the two highest-growth investment vectors through 2034. The wearable AQM segment alone is projected to reach USD 1.42 Billion by 2034, with consumer electronics integration and occupational health applications as dual growth engines.
Emerging Market Expansion
Asia Pacific and the Middle East represent the most compelling geographic investment opportunities. India’s Phase II NCAP monitoring network expansion represents a USD 540 Million procurement opportunity through 2030. Saudi Arabia’s Vision 2030 smart-city program (NEOM, The Line, Red Sea Project) includes integrated environmental monitoring infrastructure, with AQM contracts expected to exceed USD 180 Million through 2030.
Technology Investment Themes
Four technology investment themes offer superior return profiles through 2034: (1) AI-powered predictive AQM analytics platforms with SaaS monetization; (2) nano-sensor and MEMS-based miniaturized AQM modules enabling wearable integration; (3) multi-pollutant open-path LIDAR and FTIR spectroscopy systems for industrial fence-line monitoring; (4) satellite-ground sensor fusion platforms for national-scale air quality data services.
Future Market Outlook (2026-2034)
The global air quality monitoring market is positioned for sustained, structurally driven expansion through 2034. From a 2025 base of USD 5.52 Billion, the market is forecast to reach USD 9.49 Billion by 2034, representing absolute incremental value addition of USD 3.97 Billion at a 6.20% CAGR. This growth is structurally underpinned by regulatory mandates and public health imperatives that are largely independent of economic cycles.
By 2034, the industry is expected to be transformed by four converging forces: (1) universal IoT connectivity of all monitoring devices enabling real-time national air quality digital twins; (2) AI-driven predictive analytics replacing reactive monitoring with proactive pollution management; (3) democratization of high-quality monitoring through low-cost sensor networks enabling monitoring coverage in previously unmonitored geographies; and (4) integration of personal AQM data into healthcare systems enabling population-level air quality exposure-health outcome correlation at unprecedented scale.
The wearable AQM segment is expected to grow from 15.0% (2025) to approximately 21–23% of market revenues by 2034, becoming the primary growth driver as consumer-grade devices approach the performance specifications previously requiring laboratory-grade equipment. China and India will collectively represent approximately 35% of global incremental AQM market growth through 2034, making the Asia Pacific the defining growth geography for the next decade.
Research Methodology
Primary Research
Primary research comprised structured interviews with over 180 industry stakeholders in 2024–2025, including AQM equipment manufacturers, government environmental agency procurement officers, industrial compliance managers, environmental consultants, and IoT platform developers across North America, Europe, and the Asia Pacific.
Secondary Research
Secondary research encompassed review of company annual reports, EPA and EU regulatory publications, WHO air quality databases, patent filings, conference proceedings (AWMA, EAC, CASANZ), and over 260 peer-reviewed environmental science publications. Trade association data from PETA, AWMA, and EMA regional bodies were systematically incorporated.
Forecasting Models
Market size projections employed bottom-up modeling aggregating equipment unit shipments by product type and region, validated against top-down revenue data from public company disclosures. Three scenario models were constructed: base (6.20% CAGR), optimistic (7.8% CAGR, assuming accelerated global AQM regulatory mandates), and conservative (4.9% CAGR, assuming regulatory implementation delays and budget constraints). The base case reflects current regulatory pipelines and technology commercialization timelines.
Air Quality Monitoring Market Report Scope:
| Report Features | Details |
|---|---|
| Base Year of the Analysis | 2025 |
| Historical Period | 2020-2025 |
| Forecast Period | 2026-2034 |
| Units | Billion USD |
| Scope of the Report | Exploration of Historical Trends and Market Outlook, Industry Catalysts and Challenges, Segment-Wise Historical and Future Market Assessment:
|
| Product Types Covered | Indoor Monitors, Outdoor Monitors, Wearable Monitors |
| Pollutants Covered | Chemical Pollutant, Physical Pollutant, Biological Pollutant |
| Sampling Methods Covered | Active/Continuous Monitoring, Passive Monitoring, Intermittent Monitoring, Stack Monitoring |
| End-Users Covered | Government Agencies and Academic Institutes, Commercial and Residential Users, Petrochemical Industry, Power Generation Plants, Pharmaceutical Industry, Other |
| Regions Covered | Asia Pacific, Europe, North America, Latin America, Middle East and Africa |
| Companies Covered | Thermo Fisher Scientific, Honeywell International Inc., Siemens Aktiengesellschaft, Emerson Electric, Teledyne Technologies, Horiba, 3M Company, Aeroqual, etc. |
| Customization Scope | 10% Free Customization |
| Post-Sale Analyst Support | 10-12 Weeks |
| Delivery Format | PDF and Excel through Email (We can also provide the editable version of the report in PPT/Word format on special request) |
Key Benefits for Stakeholders:
- IMARC’s industry report offers a comprehensive quantitative analysis of various market segments, historical and current market trends, air quality monitoring market forecast, and dynamics of the market from 2020-2034.
- The research report provides the latest information on the market drivers, challenges, and opportunities in the global market.
- The study maps the leading, as well as the fastest-growing, regional markets.
- Porter's five forces analysis assists stakeholders in assessing the impact of new entrants, competitive rivalry, supplier power, buyer power, and the threat of substitution. It helps stakeholders to analyze the level of competition within the market and its attractiveness.
- The competitive landscape allows stakeholders to understand their competitive environment and provides insight into the current positions of key players in the air quality monitoring industry.
Frequently Asked Questions About the Air Quality Monitoring Market Report
The global air quality monitoring market was valued at USD 5.52 Billion in 2025 and is projected to reach USD 9.49 Billion by 2034. Growth is driven by tightening regulations, smart-city programs, and rising health awareness.
The market is forecast to grow at a CAGR of 6.20% during 2026-2034, supported by accelerating regulatory mandates across all major economies and rapid technological innovation in sensor and IoT connectivity.
Outdoor monitors command the largest share at 48.6% (2025), driven by government-mandated ambient monitoring networks, smart-city deployments, and industrial fence-line monitoring requirements across North America, Europe, and the Asia Pacific.
North America leads with 34.6% of global revenues (2025), supported by the U.S. EPA’s stringent NAAQS framework, Clean Air Act compliance requirements, and extensive existing monitoring infrastructure.
Asia Pacific is the fastest-growing region at an estimated CAGR of ~8.1% (2026–2034), propelled by China’s Blue Sky Initiative, India’s National Clean Air Programme, and rapid industrialization driving mandatory emission monitoring adoption.
Key drivers include increasingly stringent national and international air quality regulations, mandatory CEMS requirements for industrial emitters, IoT-enabled smart-city environmental monitoring programs, and rising public health awareness driving consumer-grade AQM demand.
Chemical pollutant monitoring leads with a 52.4% share (2025), reflecting the primacy of gaseous and particulate chemical detection in regulatory compliance frameworks globally, particularly for PM2.5, NO2, SO2, CO, and VOC monitoring.
Leading companies include Thermo Fisher Scientific, Honeywell International Inc., Siemens Aktiengesellschaft, Emerson Electric, Teledyne Technologies, Horiba, 3M Company, and Aeroqual.
Key trends include AI-powered predictive analytics integration, wearable personal AQM device proliferation, satellite-ground sensor fusion for national-scale monitoring, green building IAQ certification requirements, and nano-sensor miniaturization enabling sub-USD 50 AQM modules.
High-return opportunities include wearable AQM device development, AI-driven SaaS analytics platforms, emerging market monitoring infrastructure (India, Southeast Asia, Sub-Saharan Africa), and satellite-ground fusion data services. The wearable segment alone is projected to reach USD 1.42 Billion by 2034.
Key challenges include sensor calibration drift limiting low-cost sensor reliability for regulatory applications, high capital costs of reference-grade stations constraining developing-market adoption, data standardization gaps across competing IoT protocols, and a shortage of qualified environmental monitoring technicians.
Need more help?
- Speak to our experienced analysts for insights on the current market scenarios.
- Include additional segments and countries to customize the report as per your requirement.
- Gain an unparalleled competitive advantage in your domain by understanding how to utilize the report and positively impacting your operations and revenue.
- For further assistance, please connect with our analysts.
 Request Customization
 Speak to an Analyst
 Request Brochure
 Inquire Before Buying
Benefits of Customization
- Personalize this research
- Triangulate with your data
- Get data as per your format and definition
- Gain a deeper dive into a specific application, geography, customer, or competitor
- Any level of personalization
Get in Touch With Us
UNITED STATES
Phone: +1-201-971-6302
INDIA
Phone: +91-120-433-0800
UNITED KINGDOM
Phone: +44-753-714-6104
Email: [email protected]
Client Testimonials


.webp)


