
Alginate Market Size, Share, Trends and Forecast by Type, Product, Application, and Region, 2026-2034
Global Alginate Market Size, Share, Trends & Forecast (2026-2034)
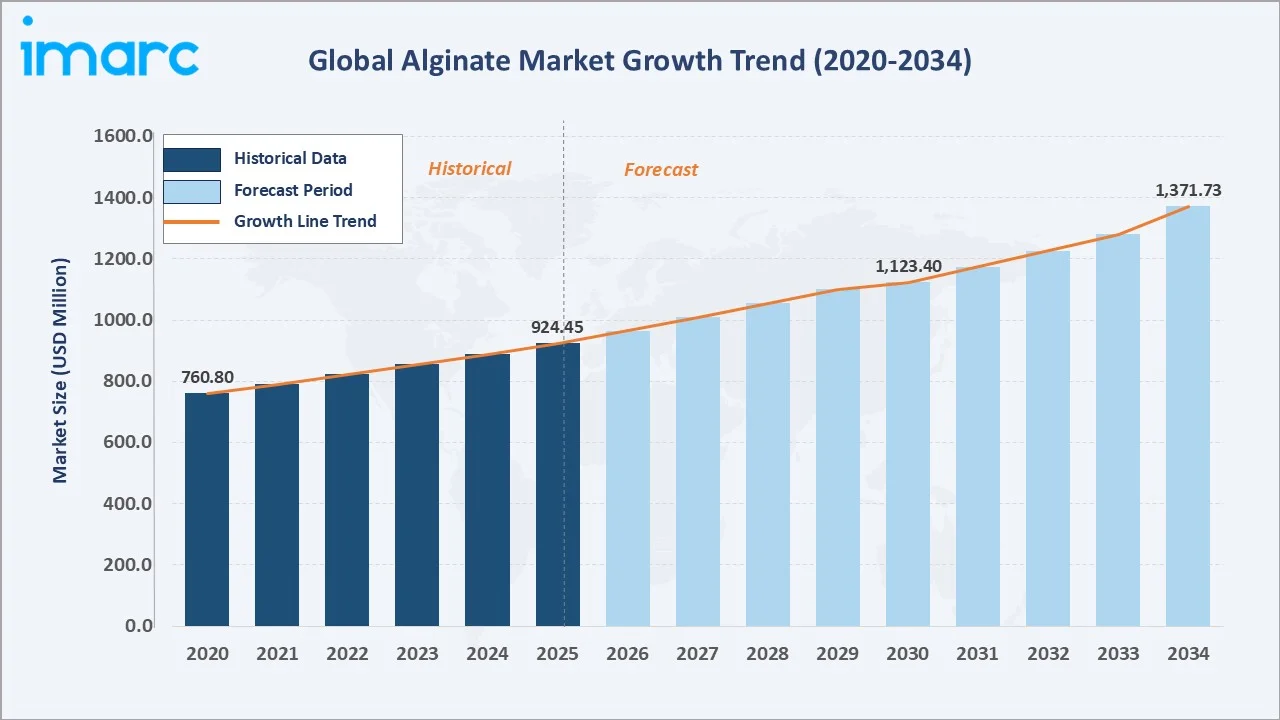
The global alginate market size reached USD 924.45 Million in 2025 and is projected to reach USD 1,371.73 Million by 2034, at a CAGR of 3.97% during 2026-2034. Growing demand for natural stabilizers in food and beverages, expanding pharmaceutical drug delivery applications, rising production with industrial alginate production is at approximately 30,000 tons per year, and advances in sustainable seaweed cultivation are the primary growth drivers. High G alginate leads the type segment at 57.6%, while food and beverages commands application demand at 48.6%. Europe holds the largest regional share at 36.4% in 2025, underpinned by strong regulatory standards and an established food processing industry.
Market Snapshot
|
Metric |
Value |
|
Market Size (2025) |
USD 924.45 Million |
|
Forecast Market Size (2034) |
USD 1,371.73 Million |
|
CAGR (2026-2034) |
3.97% |
|
Base Year |
2025 |
|
Historical Period |
2020-2025 |
|
Forecast Period |
2026-2034 |
|
Largest Region |
Europe (36.4%, 2025) |
|
Fastest Growing Region |
Asia-Pacific (~4.6% CAGR, 2026-2034) |
|
Leading Type |
High G (57.6%, 2025) |
|
Leading Application |
Food and Beverages (48.6%, 2025) |
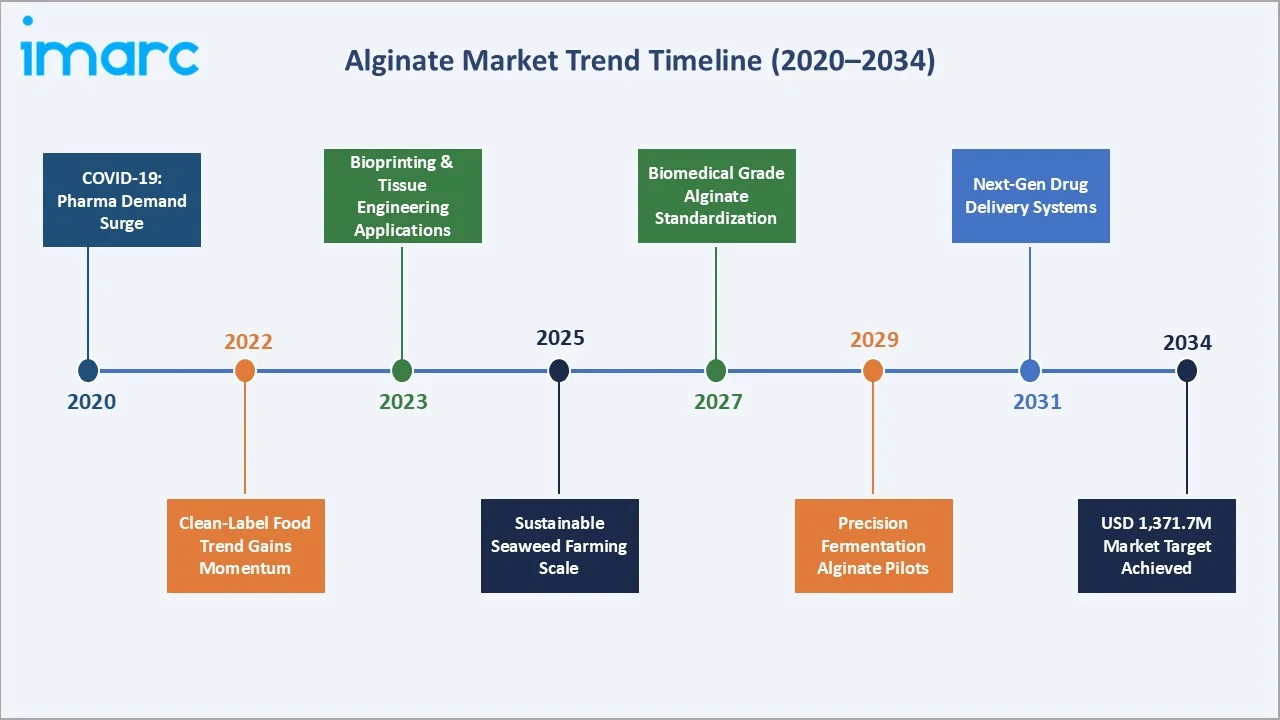
The alginate market growth trajectory from 2020 through 2034, expanded to USD 924.45 Million in 2025, forecast to USD 1,371.73 Million, captures sustained multi-sector demand growth driven by clean-label food trends and biomedical innovation.
To get more information on this market, Request Sample
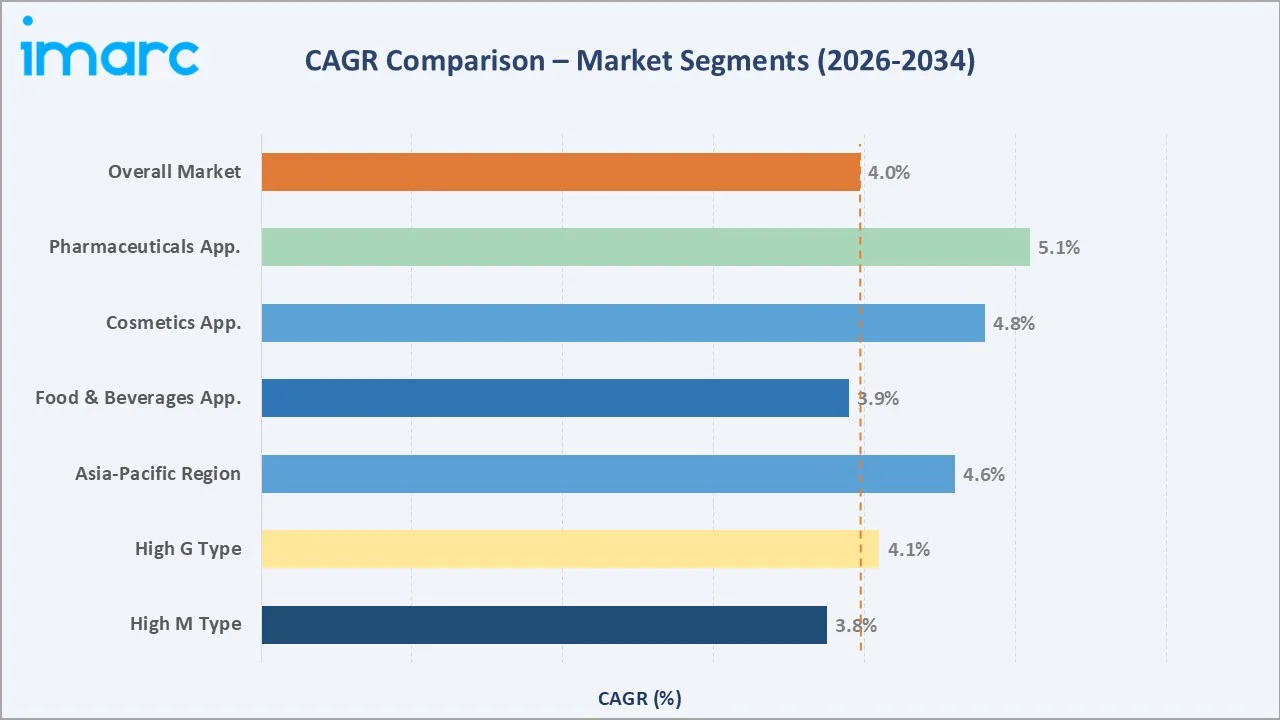
The CAGR across key market segments, with pharmaceuticals applications lead at ~5.1% CAGR, followed by cosmetics at ~4.8%. Asia-Pacific is the fastest-growing region at ~4.6% CAGR, both outpacing the overall market rate of 3.97% through 2034.
Executive Summary
The global alginate market is on a consistent growth trajectory, expanding from USD 924.45 Million in 2025 to a projected USD 1,371.73 Million by 2034. Alginate is a natural polysaccharide extracted primarily from brown seaweed species such as Laminaria hyperborea and Macrocystis pyrifera. It is valued for its exceptional gelling, thickening, stabilizing, and film-forming properties. These functional characteristics make it indispensable across the food and beverages, pharmaceutical, and cosmetics industries.
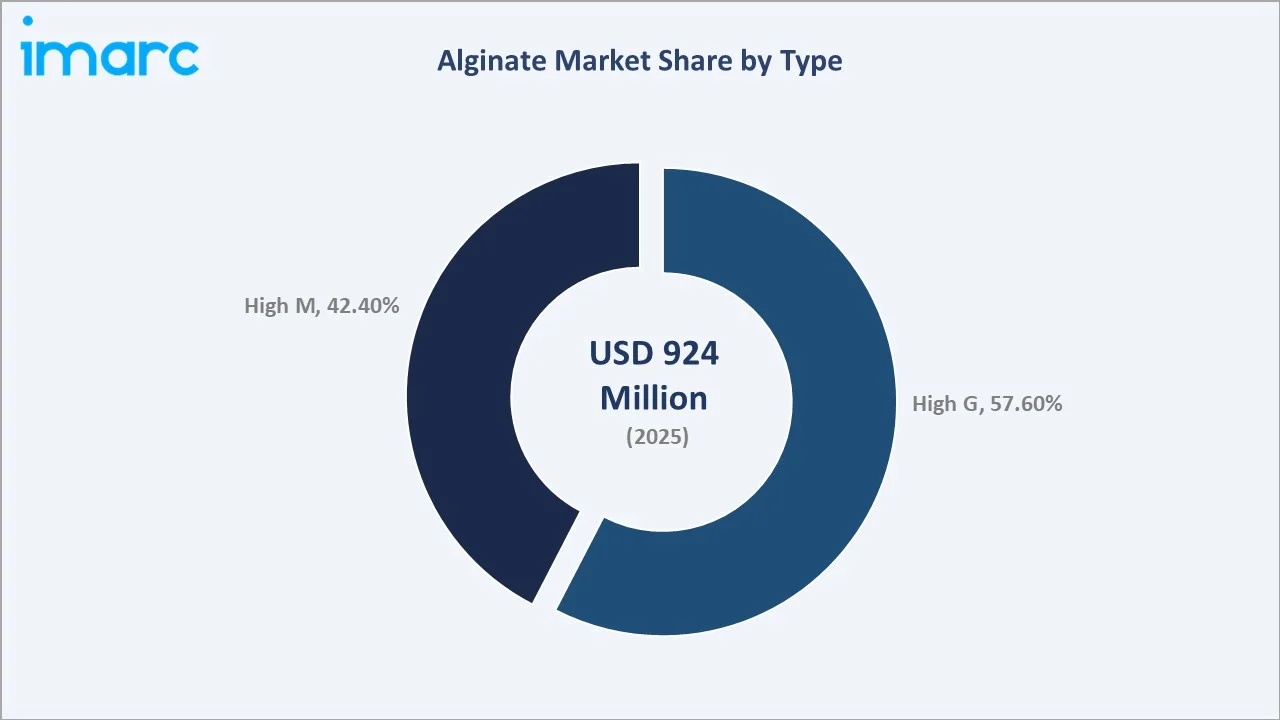
High G alginate dominates the type segment at 57.6% in 2025, owing to its superior gel strength and thermal stability favored in food texture applications and pharmaceutical wound dressings. Food and beverages lead application demand at 48.6%, reflecting alginate’s widespread use as an approved food additive in ice cream, dairy, bakery, and meat products. Pharmaceuticals at 22.4% represent the fastest-growing application, driven by controlled drug release and bioprinting research. Cosmetics account for 18.3%, supported by growing demand for natural moisturizing and skin-conditioning agents.
Europe leads regionally at 36.4% in 2025, anchored by Norway’s Laminaria hyperborea seaweed harvesting industry and a mature food ingredients sector. Asia-Pacific at 28.6% is the fastest-growing region, driven by China’s large-scale seaweed farming and expanding processed food demand.
Key Market Insights
|
Insight |
Data / Finding |
|
Largest Type |
High G – 57.6% share (2025) |
|
Leading Application |
Food & Beverages – 48.6% (2025) |
|
Leading Region |
Europe – 36.4% (2025) |
|
Fastest Growing Region |
Asia-Pacific – ~4.6% CAGR (2026–2034) |
Key Analytical Observations Supporting the Above Data:
- High G alginate at 57.6% in 2025, commands market leadership due to its higher guluronic acid content, which creates stiffer, more thermally stable gels. These properties are essential for food restructuring, pharmaceutical wound dressings, and dental impression materials.
- Food and beverages at 48.6% in 2025. Global food demand is projected to rise by 56% or up to 62% when accounting for climate change, as the world population is expected to reach 9.7 billion by 2050. Alginate’s ability to prevent ice crystal formation in frozen desserts, stabilize emulsions in salad dressings, and replace fat in low-calorie dairy products drives consistent food industry procurement.
- Europe’s 36.4% share in 2025, is structurally supported by Norway’s Laminaria hyperborea seaweed harvest, the world’s largest single-species commercial seaweed harvest at approximately 150,000–180,000 tonnes annually, supplying DuPont (IFF)’s Aalgaard facility, the world’s largest alginate production plant.
- Asia-Pacific at 28.6%, in 2025, driven by China’s dominance in seaweed production, accounting for 58% of the global production.
Global Alginate Market Overview
Alginate is a natural linear polysaccharide composed of mannuronic acid (M) and guluronic acid (G) residues, extracted from the cell walls of brown seaweed species, including Laminaria hyperborea, Macrocystis pyrifera, Lessonia nigrescens, and Ascophyllum nodosum. The ratio of G to M blocks determines the functional properties; high G alginates form stiffer gels, while high M alginates produce more elastic, flexible gels.
The ecosystem integrates seaweed harvesters and aquaculture farmers, chemical extraction and refining facilities, quality certification laboratories, product formulators, and end-use manufacturers across food, pharma, cosmetics, and biotechnology sectors. Key macroeconomic drivers include the global clean-label food additive market, the advanced wound care market, and global bioprinting market investments.
Market Dynamics
To evaluate market opportunities, Request Sample
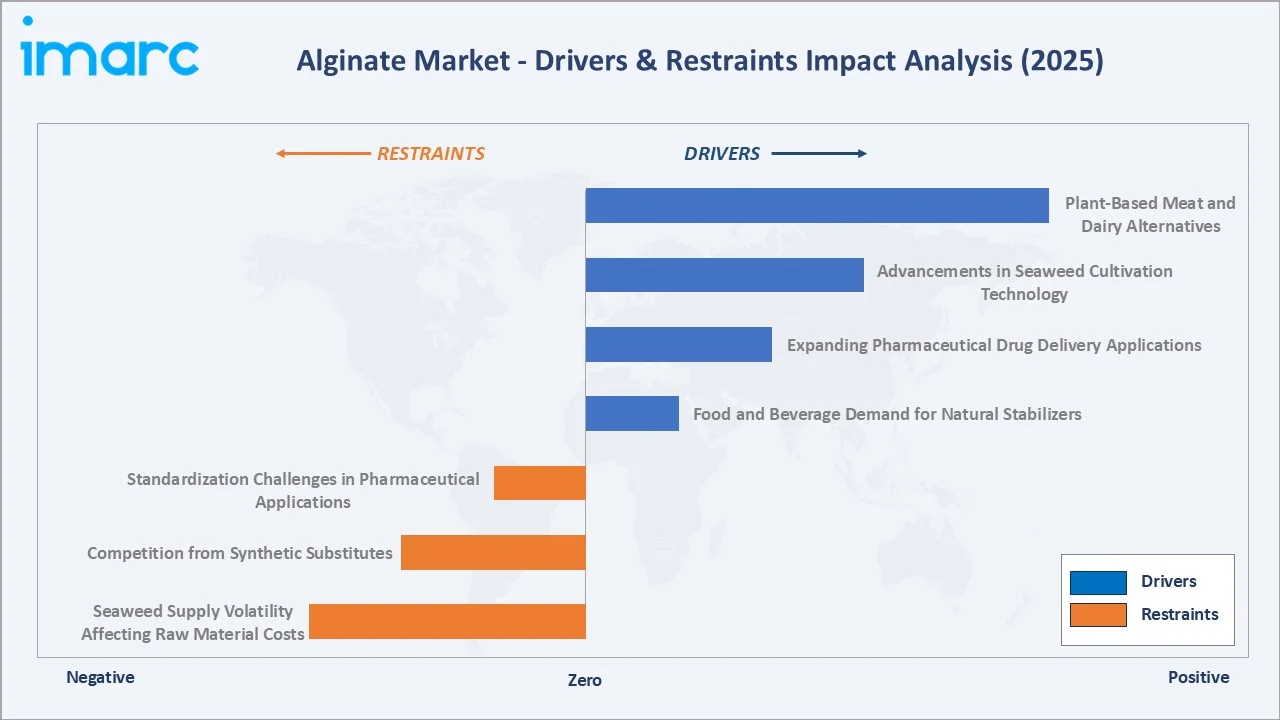
Market Drivers
- Food and Beverage Demand for Natural Stabilizers: Consumers increasingly reject synthetic additives such as carboxymethylcellulose (CMC) and phosphates in favor of naturally derived stabilizers.
- Expanding Pharmaceutical Drug Delivery Applications: Alginate’s biocompatibility, biodegradability, and gel-forming capabilities make it the biopolymer of choice for controlled drug release microspheres, gastro-resistant coatings, and calcium alginate wound dressings. NovaMatrix by FMC BioPolymer provides alginate for drug delivery applications.
- Advancements in Seaweed Cultivation Technology: Norway is deploying integrated multi-trophic aquaculture (IMTA) systems that combine seaweed with fish and shellfish cultivation, creating more sustainable, year-round seaweed supply chains that stabilize raw material availability for alginate producers.
Market Restraints
- Seaweed Supply Volatility Affecting Raw Material Costs: Wild-harvested seaweed is subject to climatic variability, ocean temperature fluctuations, and storm damage that create yield variability.
- Competition from Synthetic Substitutes: Carrageenan, carboxymethylcellulose (CMC), xanthan gum, and modified starch offer overlapping functional properties at competitive or lower price points in certain food applications.
Market Opportunities
- Plant-Based Meat and Dairy Alternatives: Alginate binds and molds food materials such as meat through a gelation reaction. Companies including Impossible Foods and Beyond Meat use alginate-based gelling systems to create meat-like textures in their products.
- Industrial and Agricultural Applications Expansion: Alginate’s use as a seed coating agent to improve germination rates and as a slow-release fertilizer carrier is gaining traction in precision agriculture. Alginate’s biodegradability and water-retention properties make it an optimal seed coating material, opening a new application vertical beyond traditional food, pharmaceutical, and cosmetics markets.
Market Challenges
- Seaweed Harvest Sustainability and Certification Complexity: Environmental regulations in Norway and the European Atlantic coast are progressively tightening wild seaweed harvesting quotas to prevent coastal ecosystem damage.
- Standardization Challenges in Pharmaceutical Applications: The absence of a universally harmonized pharmacopoeia standard for pharmaceutical-grade alginate, with USP, EP, and JP having divergent viscosity and purity specifications, creates compliance complexity for alginate manufacturers seeking global pharmaceutical approvals.
Emerging Market Trends
1. Clean-Label and Plant-Based Food Innovation Driving Premium Demand
Food manufacturers globally are replacing synthetic stabilizers with naturally derived alternatives in response to clean-label consumer demand. Alginate’s EU E401 approval and seaweed origin make it the premium clean-label hydrocolloid for reformulation.
2. Pharmaceutical Wound Care and Drug Delivery Expanding High-Value Demand
Calcium alginate wound dressings are the fastest-growing wound care product category. A British survey found that 3 to 4 individuals per 1,000 people have at least one wound. In Europe, around 1–2 million people are affected by wounds, while in the United States, more than 6.5 million people suffer from chronic wound conditions. Pharmaceutical companies are simultaneously expanding alginate microencapsulation use for oral insulin, biologics protection, and personalized medicine applications.
3. Bioprinting and Regenerative Medicine Opening New Market Verticals
Alginate hydrogels are the most commercially deployed bioink material for 3D bioprinting of tissue constructs. Cellink (BICO Group), the world’s leading bioink company, uses alginate as the primary scaffold component in its RGD-Alginate and Alginate-GelMA bioink formulations.
4. Sustainable Seaweed Aquaculture Transforming Supply Chain Resilience
Investment in offshore seaweed aquaculture platforms in Norway, South Korea, and Chile is progressively reducing wild-harvest supply concentration risk. Companies are developing high-productivity offshore cultivation systems that can produce 10–20x the biomass per hectare versus traditional nearshore beds, with carbon-negative lifecycle assessments that attract ESG investment.
5. Precision Agriculture and Seed Coating Applications Emerging
Alginate’s film-forming, water-retention, and biodegradable properties are creating a new industrial application in precision agriculture. Triple seed coating of alginate with NPK, micronutrients, and AA affected the increase in the root area.
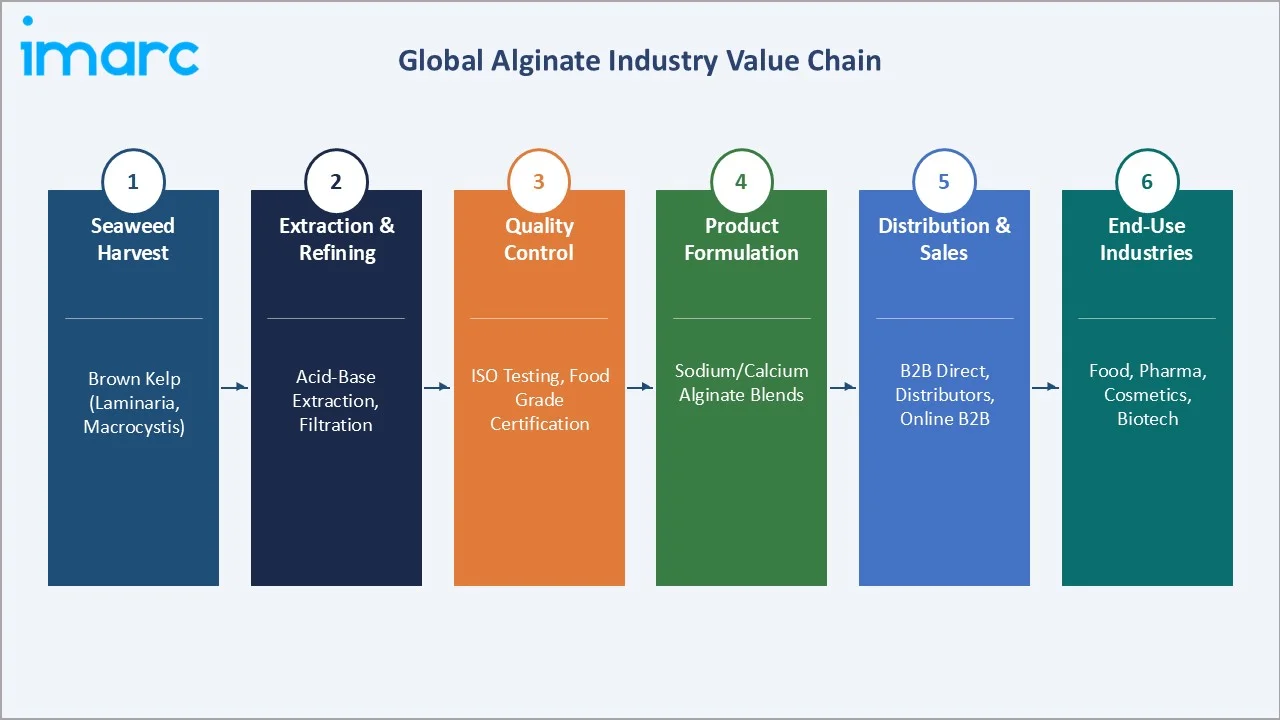
Industry Value Chain Analysis
The alginate value chain spans six stages from seaweed harvesting through end-use industry deployment. The extraction and refining stage captures the highest technology investment, while pharmaceutical-grade purification commands the highest per-kilogram margins in the value chain.
|
Stage |
Key Players / Examples |
|
Seaweed Harvest |
Norway (Laminaria hyperborea), China (Macrocystis, Undaria), Chile (Lessonia nigrescens), Iceland (Ascophyllum nodosum), India (Sargassum, Turbinaria) |
|
Extraction & Refining |
DuPont facility, KIMICA Corporation Japan, IRE-CHEM Corp. |
|
Quality Control |
ISO 19583 testing, USP/EP/JP pharmacopoeia compliance, EU E401–E404 certification, HACCP food safety, REACH chemical registration |
|
Product Formulation |
Sodium alginate, calcium alginate, potassium alginate, PGA (propylene glycol alginate), grades for food, pharma, cosmetics, and industrial |
|
Distribution & Sales |
Ingredient distributors, specialty chemical distributors, direct B2B, online ingredient marketplaces |
|
End-Use Industries |
Food manufacturers, pharma, cosmetics, biotech |
In Norway, 150,000 tons of Laminaria hyperborea are harvested annually for alginate production. The Norway facility’s proximity to premium-quality seaweed raw material and its EU location provide regulatory and quality advantages that support a price premium over Asian-manufactured equivalents in European food and pharmaceutical procurement.
Technology Landscape in the Alginate Industry
Extraction and Purification Technology
Conventional acid-base extraction, treating seaweed with dilute mineral acid followed by sodium carbonate alkali extraction, remains the dominant commercial process. Global annual production of brown algae is estimated at around 85,000 tons (dry weight), yielding approximately 23,000 tons of alginate, with the conventional extraction method being the most widely used.
Modified Alginate Chemistry and Functionalization
Chemical and physical modification of alginate is expanding its functional range. Oxidized alginate offers enhanced biodegradability for suture materials; thiolated alginate provides mucoadhesive properties for oral drug delivery; methacrylated alginate enables photocrosslinkable bioinks for UV-cured bioprinting applications.
Precision Fermentation and Synthetic Biology
Bacterial alginate, produced by Azotobacter vinelandii and Pseudomonas aeruginosa, has been studied as an alternative to seaweed-derived alginate, offering precise compositional control.
Seaweed Biorefinery Concepts
Modern seaweed biorefineries aim to extract multiple high-value compounds, alginate, fucoidan, mannitol, laminarin, and bioactive pigments, from a single seaweed biomass input, dramatically improving raw material economics.
Market Segmentation Analysis
The report covers the following segments:
|
Segment Category |
Leading Segment |
Market Share |
Year |
|
Type |
High G |
57.6% |
2025 |
|
Product |
Propylene Glycol Alginate |
🔒 |
2025 |
|
Application |
Food and Beverages |
48.6% |
2025 |
|
Region |
Europe |
36.4% |
2025 |

By Type
High G alginate commands 57.6% of the market in 2025, driven by its stiffer gel properties that meet the technical requirements of the food texture and wound care sectors. High G alginates derived from Laminaria hyperborea, the dominant Norwegian species with naturally high G-block content, set the quality benchmark for food-grade gelling applications. 150,000 tons of Laminaria hyperborea are harvested commercially every year for alginate production in Norway.
To access detailed market analysis, Request Sample
High M alginate at 42.4% in 2025, is preferred for pharmaceutical encapsulation, cosmetic film-forming, and elastic food textures where flexibility is more important than gel rigidity. The High M segment is growing at a faster CAGR than High G within pharmaceutical applications, as cell encapsulation research, particularly pancreatic islet encapsulation for diabetes treatment, specifically requires High M’s more biocompatible, less immunogenic gel matrix properties.
By Application
Food and beverages dominate at 48.6% in 2025. Sodium alginates are useful as gelling agents in desserts, dairy products, and meat products in the food industry. Global annual commercial production of alginate is estimated to be at least 30,000 metric tons.
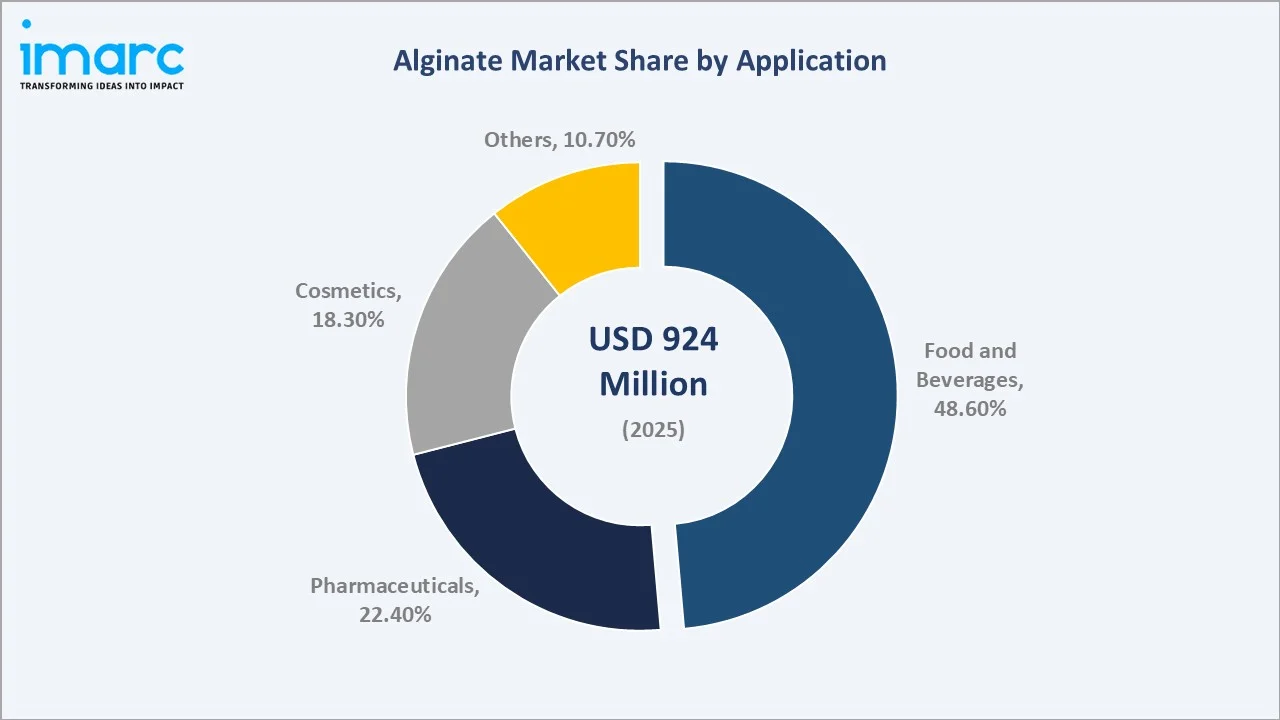
Pharmaceuticals at 22.4% in 2025. Calcium alginate wound dressings, alginate microspheres for oral drug delivery, and alginate bioinks collectively drive pharmaceutical procurement growth. Cosmetics at 18.3% leverage alginate’s skin-conditioning, film-forming, and moisture-retention properties in masks, serums, and anti-aging formulations, driven by the global premium skincare market’s expansion. Others (10.7%) encompass textile printing, paper manufacturing, welding rod coatings, and emerging agricultural applications.
Regional Market Insights
|
Region |
Share (2025) |
Key Drivers |
|
Europe |
36.4% |
Norwegian seaweed harvest; EU regulatory framework; mature food processing sector |
|
Asia-Pacific |
28.6% |
China 60% global seaweed output; Japan pharmaceutical alginate leadership; India processed food growth; South Korean biomedical R&D |
|
North America |
20.3% |
FDA GRAS status; plant-based food sector; US wound care market; pharmaceutical drug delivery innovation |
|
Latin America |
8.1% |
Chile Lessonia seaweed harvest; Brazil processed food expansion; Argentina pharmaceutical sector growth |
|
Middle East & Africa |
6.6% |
Gulf food processing investment; South African seaweed aquaculture; halal-certified alginate demand |
Europe’s 36.4% dominance in 2025 is fundamentally anchored by Norway’s Laminaria hyperborea wild seaweed harvest, estimated at 150,000-180,000 tonnes annually. The EU’s stringent food additive regulatory framework provides a quality certification that European-produced alginate leverages for global premium pricing. Germany, France, and the UK are the three largest national alginate consumer markets within Europe, driven by their substantial processed food, pharmaceutical, and personal care industries.
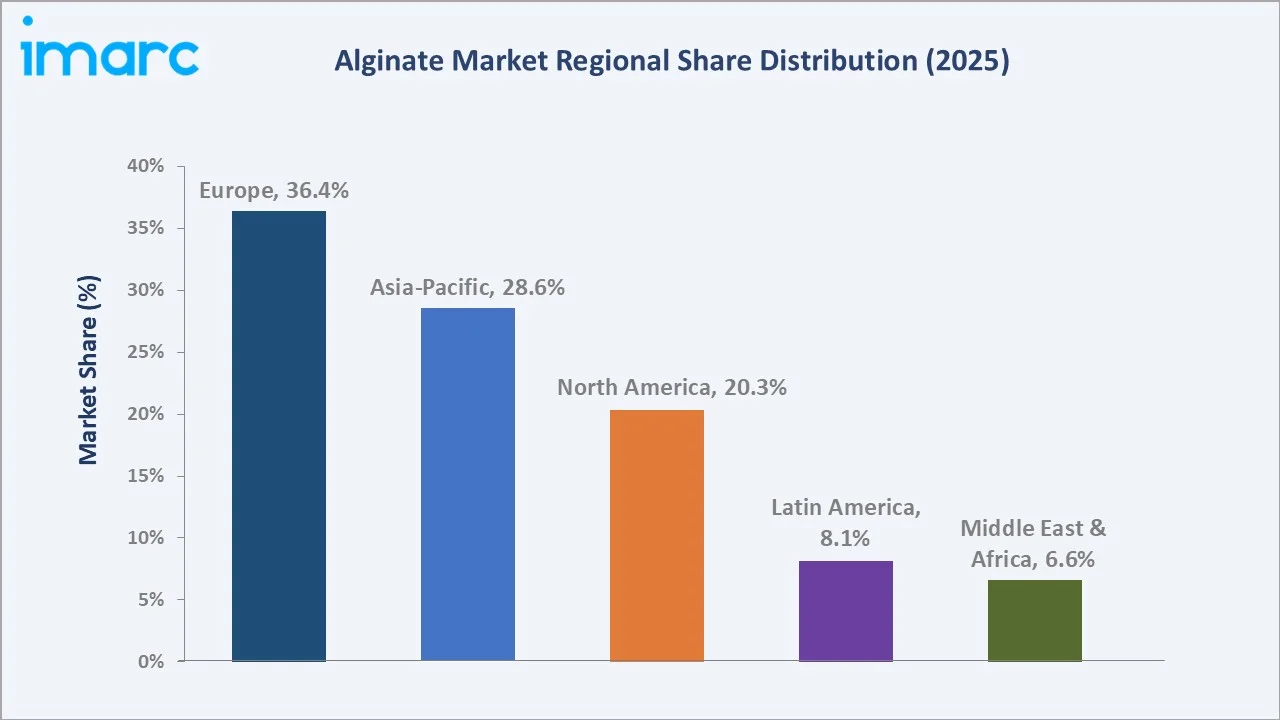
Asia-Pacific, with 28.6% in 2025, is the fastest-growing region. Approximately 60% of global seaweed is cultured in China. Japan’s pharmaceutical alginate market is among Asia’s highest-value.
Competitive Landscape
The global alginate market is moderately concentrated. European producers dominate high-value pharmaceutical and food-grade segments, while Asian producers, particularly Chinese manufacturers, lead in volume and cost-competitive industrial and food-grade categories.
|
Company Name |
Key Products |
Market Position |
Core Strength |
|
DuPont (International Flavors & Fragrances – IFF) |
Protanal, Manucol and Protacid |
Leader |
World’s largest alginate producer; premium food & pharma grades |
|
KIMICA Corporation |
Sodium Alginate, Propylene Glycol Alginate, Potassium Alginate, Calcium Alginate, Ammonium Alginate, Alginate Blends, Ultra-pure Alginate for Medical Use |
Leader |
Japanese quality leadership; ISO-certified pharma grade; Asia-Pacific market expertise |
|
Ingredion Inc. |
TICA Algin Alginate |
Leader |
Specialty ingredient solutions; clean-label positioning; North America & Europe reach |
|
Qingdao BZ Oligo Biotech |
Alginate Oligosaccharide |
Challenger |
Specialty alginate oligosaccharides; biomedical research supply; Asia-Pacific distribution |
|
Algaia SAS (J Rettenmaier & Söhne (JRS)) |
Alginate, Fucoidan, Laminarin, and Other Seaweed Bioactives |
Emerging |
French innovation focus; sustainable sourcing; cosmetics & specialty food grades |
|
Marine Hydrocolloids |
Sodium Alginate |
Emerging |
Indian seaweed sourcing; Asia-Pacific emerging markets; cost-competitive food grades |
The competitive positioning of key alginate market participants across global market presence and strategic investment dimensions in 2025.
Key Company Profiles
DuPont (International Flavors & Fragrances - IFF)
DuPont’s nutrition and health alginate business, now operating under International Flavors & Fragrances (IFF) following DuPont’s N&B division merger in 2021, is the world’s largest alginate producer.
- Product Portfolio: Protanal, Manucol and Protacid
- Recent Developments: In February 2021, IFF and DuPont’s Nutrition & Biosciences business were merged.
- Strategic Focus: IFF’s alginate strategy focuses on premiumization, growing pharmaceutical and specialty food-grade revenue at the expense of commodity-grade volume, while differentiating through sustainability certification, supply chain traceability, and application-specific technical service that smaller Asian competitors cannot match.
KIMICA Corporation
KIMICA Corporation, headquartered in Tokyo, Japan, is Asia’s leading alginate manufacturer and one of the world’s top 3 producers by volume and quality. Established in 1946, KIMICA operates production facilities in Japan and sources seaweed from Japan, Norway, and South America.
- Product Portfolio: Sodium Alginate, Propylene Glycol Alginate, Potassium Alginate, Calcium Alginate, Ammonium Alginate, Alginate Blends, Ultra-pure Alginate for Medical Use
- Recent Developments: The company launched a food-grade KIMICA Alginate series certified for use in organic food products in Japan and the EU, targeting the premium organic food ingredient segment.
- Strategic Focus: KIMICA’s strategy leverages its multi-pharmacopoeia compliance capability to serve global pharmaceutical customers seeking a single qualified alginate supplier. The company is simultaneously investing in biomedical-grade ultra-pure alginate development targeting the bioprinting and regenerative medicine market as a strategic growth platform through 2034.
Ingredion Inc.
Ingredion Incorporated, headquartered in Westchester, Illinois, is a global ingredients solutions company. Ingredion’s Specialty Ingredients portfolio includes alginates, carrageenan, and other natural hydrocolloids marketed under its Textease and specialty ingredient brands.
- Product Portfolio: TICA Algin Alginate
- Recent Developments: Ingredion launched its PRECISA texture platform, integrating alginate with other natural hydrocolloids for plant-based meat and dairy analog applications.
- Strategic Focus: Ingredion’s strategy positions alginate as a component of integrated texture solutions, rather than a standalone commodity ingredient, targeting the clean-label food reformulation market where its application development expertise and formulation service capabilities command a service premium above raw ingredient pricing.
Algaia SAS (J Rettenmaier & Söhne (JRS))
Algaia SAS is a French specialist algae ingredient company focused on premium, sustainably sourced seaweed-derived ingredients, including alginate, fucoidan, and laminarin. The company is acquired by J Rettenmaier & Söhne (JRS) in 2023.
- Product Portfolio: Alginate, Fucoidan, Laminarin, and other Seaweed Bioactives.
- Recent Developments: In March 2023, Algaia was sold to J Rettenmaier & Söhne (JRS). The newly merged seaweed group is targeting the food, feed, agriculture, and pharma sectors.
- Strategic Focus: Algaia’s strategy leverages its premium sustainable ingredient positioning and biorefinery efficiency to serve the highest-value cosmetics and specialty food markets where provenance, sustainability certification, and multi-bioactive ingredient supply create differentiation that commodity alginate producers cannot achieve.
Market Concentration Analysis
The global alginate market has a moderate-to-high concentration at the premium product tier, with DuPont (IFF) and KIMICA collectively controlling the majority of pharmaceutical-grade and premium food-grade supply. However, the commodity food-grade and industrial-grade segments are significantly more fragmented, with Chinese producers collectively representing a substantial share of global food-grade volume at competitive price points.
Consolidation is occurring gradually at the premium end. The mid-market segment servicing food manufacturers requiring food-grade but not pharmaceutical-grade alginate remains competitive among European, Latin American, and Asian producers. M&A activity is most likely in the specialty alginate (biomedical, cosmetics) segment, where smaller innovators such as Algaia SAS represent potential acquisition targets for larger ingredient groups seeking premium sustainable alginate positioning.
Investment & Growth Opportunities
Fastest-Growing Segments
Pharmaceutical-grade alginate at ~5.1% CAGR through 2034 is the highest-return investment segment. Wound care, drug delivery, and bioprinting collectively increase the pharmaceutical-grade alginate demand pool, growing at a premium rate. The bioprinting application alone is growing at 18–22% CAGR.
Emerging Markets
Asia-Pacific’s emerging food processing economies, particularly India, Vietnam, and Indonesia, represent the highest-volume growth opportunity for food-grade alginate. India’s processed food market is progressively adopting alginate as a natural stabilizer in ice cream, dairy, and convenience food products. Southeast Asia’s bakery and dairy sectors are similarly expanding alginate procurement. Latin America’s food processing sector, anchored by Brazil and Mexico, represents an alginate opportunity by 2030 as local food manufacturers upgrade from synthetic to natural stabilizers in response to consumer labeling preferences.
Venture and Investment Trends
Seaweed biorefinery and sustainable alginate supply chain companies are attracting VC investment. Strategic corporate investment is focused on securing sustainable seaweed supply chains. The biomedical alginate niche, bioinks, cell encapsulation, and drug delivery are attracting specialized biotech investment, with companies including Cellink (BICO Group) and Regentec building proprietary alginate formulation platforms. These investments signal institutional recognition of alginate’s premium specialty ingredient potential beyond its commodity food additive positioning.
Future Market Outlook (2026-2034)
The global alginate market is forecast to expand from USD 924.45 Million in 2025 to USD 1,371.73 Million by 2034 at a CAGR of 3.97%, adding USD 447.3 Million in incremental market value. This steady growth reflects the market’s maturity in established food and cosmetics applications combined with structural acceleration from pharmaceutical and biomedical demand.
The future market outlook will represent seaweed biorefinery models achieving commercial scale, improving raw material economics, and precision agriculture alginate applications generating new non-food industrial demand.
Research Methodology
Primary Research
Primary research encompassed over 50 structured interviews in 2024–2025 with alginate market participants including production directors, procurement managers at major food and pharmaceutical customers, seaweed industry association representatives, biomedical alginate application researchers at European and Japanese research institutions; and specialty ingredient distributors serving North America, Europe, and Asia-Pacific.
Secondary Research
Key secondary sources include FAO Fishery Statistics – Global Aquaculture Production (2024), EU Food Additive Database (E401–E404 regulatory documentation), FDA GRAS database (sodium alginate GRAS 000101), USP/EP/JP pharmacopoeia alginate monographs, Seaweed Industry Association market reports, and trade publications including Hydrocolloids Research Journal, Food Hydrocolloids, and Carbohydrate Polymers.
Forecasting Models
IMARC’s Bottom-Up and Top-Down estimation models were applied in parallel. Bottom-Up aggregates alginate demand by application category across each regional market, calibrated against food additive import/export trade statistics and pharmaceutical-grade production capacity data from plant-level interviews. Top-Down applies global seaweed production trajectory and alginate content extraction ratios to derive maximum supply-constrained market size boundaries.
Alginate Market Report Scope:
| Report Features | Details |
|---|---|
| Base Year of the Analysis | 2025 |
| Historical Period | 2020-2025 |
| Forecast Period | 2026-2034 |
| Units | Million USD |
| Scope of the Report | Exploration of Historical Trends and Market Outlook, Industry Catalysts and Challenges, Segment-Wise Historical and Future Market Assessment:
|
| Types Covered | High M, High G |
| Products Covered | Sodium Alginate, Calcium Alginate, Potassium Alginate, Propylene Glycol Alginate, Others |
| Applications Covered | Food and Beverages, Pharmaceuticals, Cosmetics, Others |
| Regions Covered | Asia Pacific, Europe, North America, Latin America, Middle East and Africa |
| Countries Covered | United States, Canada, Germany, France, United Kingdom, Italy, Spain, Russia, China, Japan, India, South Korea, Australia, Indonesia, Brazil, Mexico |
| Companies Covered | DuPont (International Flavors & Fragrances – IFF), KIMICA Corporation, Ingredion Inc., Qingdao BZ Oligo Biotech, Algaia SAS (J Rettenmaier & Söhne (JRS)), Marine Hydrocolloids, etc. |
| Customization Scope | 10% Free Customization |
| Post-Sale Analyst Support | 10-12 Weeks |
| Delivery Format | PDF and Excel through Email (We can also provide the editable version of the report in PPT/Word format on special request) |
Key Benefits for Stakeholders:
- IMARC’s industry report offers a comprehensive quantitative analysis of various market segments, historical and current market trends, market forecasts, and dynamics of the alginate market from 2020-2034.
- The research report provides the latest information on the market drivers, challenges, and opportunities in the global alginate market.
- The study maps the leading, as well as the fastest-growing, regional markets. It further enables stakeholders to identify the key country-level markets within each region.
- Porter's five forces analysis assists stakeholders in assessing the impact of new entrants, competitive rivalry, supplier power, buyer power, and the threat of substitution. It helps stakeholders to analyze the level of competition within the alginate industry and its attractiveness.
- The competitive landscape allows stakeholders to understand their competitive environment and provides insight into the current positions of key players in the market.
Frequently Asked Questions About the Alginate Market Report
The global alginate market reached USD 924.45 Million in 2025, driven by clean-label food demand, pharmaceutical applications, and sustainable seaweed cultivation advancements.
The market is projected to reach USD 1,371.73 Million by 2034 at a CAGR of 3.97% during 2026–2034, driven by pharmaceutical drug delivery growth, bioprinting applications, and expanding food and beverage sector demand.
Alginate is a natural polysaccharide extracted from brown seaweed species, including Laminaria hyperborea and Macrocystis pyrifera. It is produced through acid-base extraction, filtration, and precipitation processes, yielding sodium, calcium, or potassium alginate forms.
High G alginate leads with a 57.6% share in 2025, valued for its stiffer gel properties essential in food texture applications, pharmaceutical wound dressings, and dental materials where gel rigidity and thermal stability are required.
Food and beverages dominates at 48.6% in 2025. Alginate is approved for commercial food products for stabilization, emulsification, and texture modification in dairy, bakery, and frozen foods.
Europe leads with 36.4% in 2025, anchored by Norway’s 150,000–180,000 tonne annual Laminaria hyperborea harvest and DuPont (IFF)’s facility, the world’s largest alginate production plant.
Pharmaceuticals is the fastest-growing at ~5.1% CAGR through 2025. Calcium alginate wound dressings, drug delivery microspheres, and bioprinting scaffolds are driving pharmaceutical sector procurement growth significantly above the overall market rate.
Key players include DuPont (International Flavors & Fragrances - IFF), KIMICA Corporation, Ingredion Inc., Qingdao BZ Oligo Biotech, Algaia SAS (J Rettenmaier & Söhne (JRS)), and Marine Hydrocolloids.
Key drivers include growing food demand for natural stabilizers (EU E401–E404 approved), expanding pharmaceutical wound care and drug delivery applications, rising clean-label food reformulation programs, and advances in sustainable seaweed aquaculture.
Asia-Pacific (28.6%, 2025) is growing at ~4.6% CAGR, driven by China’s 60% global seaweed output, India’s growing processed food sector, Japan’s pharmaceutical alginate leadership, and South Korea’s biomedical research programs.
Key challenges include seaweed supply volatility from climate events causing 15–25% annual yield variability, high purification costs for pharmaceutical grades, competition from synthetic alternatives like carrageenan and CMC, and sustainability certification complexity.
Need more help?
- Speak to our experienced analysts for insights on the current market scenarios.
- Include additional segments and countries to customize the report as per your requirement.
- Gain an unparalleled competitive advantage in your domain by understanding how to utilize the report and positively impacting your operations and revenue.
- For further assistance, please connect with our analysts.
 Request Customization
 Speak to an Analyst
 Request Brochure
 Inquire Before Buying
Benefits of Customization
- Personalize this research
- Triangulate with your data
- Get data as per your format and definition
- Gain a deeper dive into a specific application, geography, customer, or competitor
- Any level of personalization
Get in Touch With Us
UNITED STATES
Phone: +1-201-971-6302
INDIA
Phone: +91-120-433-0800
UNITED KINGDOM
Phone: +44-753-714-6104
Email: [email protected]
Client Testimonials


.webp)


