
Antimony Market Report by Product Type (Antimony Trioxide, Antimony Pentoxide, Alloys, Metal Ingots, and Others), Application (Flame Retardants, Lead-Acid Batteries, Plastic Additives, Glass and Ceramics, and Others), End-Use Industry (Chemical, Automotive, Electrical and Electronics, and Others), and Region 2026-2034
Antimony Market Size:
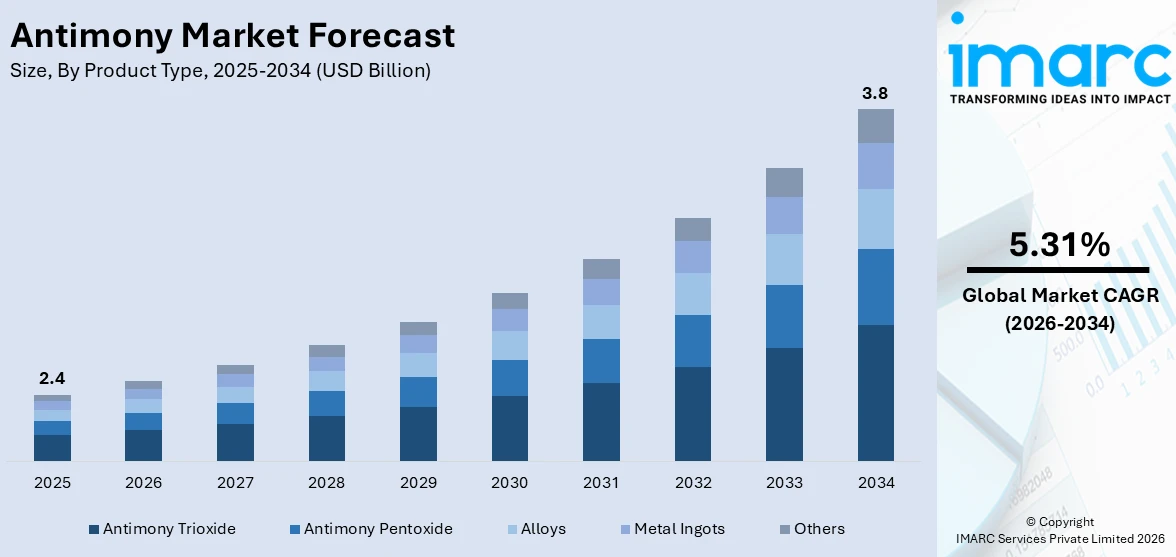
The global antimony market size reached USD 2.4 Billion in 2025. Looking forward, IMARC Group expects the market to reach USD 3.8 Billion by 2034, exhibiting a growth rate (CAGR) of 5.31% during 2026-2034. The market is experiencing steady growth driven by demand in the manufacturing of lead-acid batteries, where the product acts as a strengthening component, growth in the automotive and electronics sectors, and technological advancements in mining and processing.
|
Report Attribute
|
Key Statistics
|
|---|---|
|
Base Year
|
2025
|
|
Forecast Years
|
2026-2034
|
|
Historical Years
|
2020-2025
|
|
Market Size in 2025
|
USD 2.4 Billion |
|
Market Forecast in 2034
|
USD 3.8 Billion |
| Market Growth Rate 2026-2034 | 5.31% |
Antimony Market Analysis:
- Market Growth and Size: The global market is experiencing steady growth, driven by its diverse applications across various industries. The increasing demand for flame retardants, lead-acid batteries, and emerging uses in microelectronics is positively influencing the market.
- Technological Advancements: Innovations in recycling and processing techniques, especially in response to environmental regulations are propelling the market. Advancements in technology also open new applications in the semiconductor industry, offering potential for market expansion.
- Industry Applications: It finds extensive use in flame retardants, lead-acid batteries, and electronics. Its diverse applications across the construction, automotive, and electronics industries underpin its consistent market demand.
- Key Market Trends: The market is witnessing a trend toward sustainable practices, with the recycling gaining prominence. Stringent environmental and health regulations are also shaping production and processing methods, influencing market dynamics.
- Geographical Trends: Asia-Pacific, particularly China, plays a pivotal role as a major producer and consumer, influencing global market dynamics. The economic growth and industrial development in this region are key factors in the market's expansion.
- Competitive Landscape: The market is marked by the presence of several key players, with a concentration of production in China. This geographical concentration presents both a competitive edge and a potential risk for supply disruptions due to regional factors.
- Challenges and Opportunities: Challenges include environmental concerns and the potential health hazards of production and use, leading to stringent regulations. However, these challenges present opportunities for the development of safer production technologies and the expansion of recycling initiatives, contributing to sustainable market growth.
To get more information on this market Request Sample
Antimony Market Trends:
Industrial Applications and Demand Growth:
The global market is significantly influenced by its extensive range of industrial applications. It is a key component in flame retardants, which are widely used in construction materials, plastics, textiles, and electronics. This utility is propelled by stringent fire safety standards across various industries, especially in developed economies. Moreover, the product demand is also bolstered by its use in lead-acid batteries, which are prevalent in the automotive sector. The automotive industry's expansion, particularly in emerging economies, is a crucial driver. As technology advances, new applications in microelectronics, such as in semiconductor production, further fuel market growth. The diverse industrial uses thus create a robust and continually expanding market for this element.
Regulatory Policies and Recycling Initiatives:
Regulatory policies play a pivotal role in shaping the market. Environmental concerns and health hazards associated with production and usage are leading to stringent regulations, especially in North America and Europe. These regulations affect the supply chain by imposing safer production practices and encouraging recycling initiatives. Additionally, recycling, particularly from lead-acid batteries, is gaining momentum as it offers a sustainable alternative to mining new resources. This trend is environmentally beneficial and helps stabilize the market by providing a steady supply of recycled products, thereby mitigating the volatility in raw material prices. Furthermore, these policies stimulate innovation in extraction and processing techniques, making the industry more efficient and sustainable.
Global Economic Trends and Market Volatility:
The market is closely linked to global economic trends, as its demand is tied to the performance of various end-use industries such as automotive, electronics, and construction. Economic growth in emerging markets, especially in the Asia-Pacific region, which is a major producer and consumer, significantly influences the market dynamics. The region's industrial growth directly impacts the demand. Additionally, the market is susceptible to price volatility due to the concentrated nature of its reserves and production, with China dominating the supply. This concentration can lead to supply disruptions and price fluctuations in response to changes in export policies, environmental regulations, or political instability in key producing regions. Investors and stakeholders in the market must, therefore, navigate these economic and geopolitical factors to understand and predict market trends effectively.
Antimony Industry Segmentation:
IMARC Group provides an analysis of the key trends in each segment of the market, along with forecasts at the global, regional, and country levels for 2026-2034. Our report has categorized the market based on product type, application, and end-use industry.
Breakup by Product Type:
- Antimony Trioxide
- Antimony Pentoxide
- Alloys
- Metal Ingots
- Others
Antimony trioxide dominates the market
The report has provided a detailed breakup and analysis of the market based on the product type. This includes antimony trioxide, antimony pentoxide, alloys, metal ingots, and others. According to the report, antimony trioxide accounted for the largest market share.
Antimony trioxide holds a significant share in the market, primarily due to its extensive application as a flame retardant in plastics, textiles, and rubber industries. This compound is favored for its synergistic effect with halogenated flame retardants, enhancing their efficacy. The demand for the segment is closely linked to the construction and electronics industries, where fire safety standards are stringent.
On the other hand, antimony pentoxide is emerging as an alternative to antimony trioxide in various applications, especially where finer particle sizes and specific chemical properties are required. Its use in flame retardants, particularly for coating textiles and in some plastics, is noteworthy. While currently a smaller segment, its market is growing, driven by its perceived lower toxicity and increasing adoption in safety-conscious industries.
Moreover, antimony alloys, primarily used in lead-acid batteries, represent a vital segment of the market. The alloying of antimony with lead imparts improved hardness and strength, making these batteries more durable and reliable. The product demand in this segment is propelled by the automotive industry, including electric vehicles, where lead-acid batteries are used for ancillary power supply.
Furthermore, antimony metal ingots find applications in a variety of sectors, including the manufacturing of bullets, cable sheathing, and bearings. This segment benefits from the metal's physical properties, such as high thermal conductivity and resistance to corrosion.
Breakup by Application:
Access the comprehensive market breakdown Request Sample
- Flame Retardants
- Lead-Acid Batteries
- Plastic Additives
- Stabilizers
- Catalysts
- Glass and Ceramics
- Others
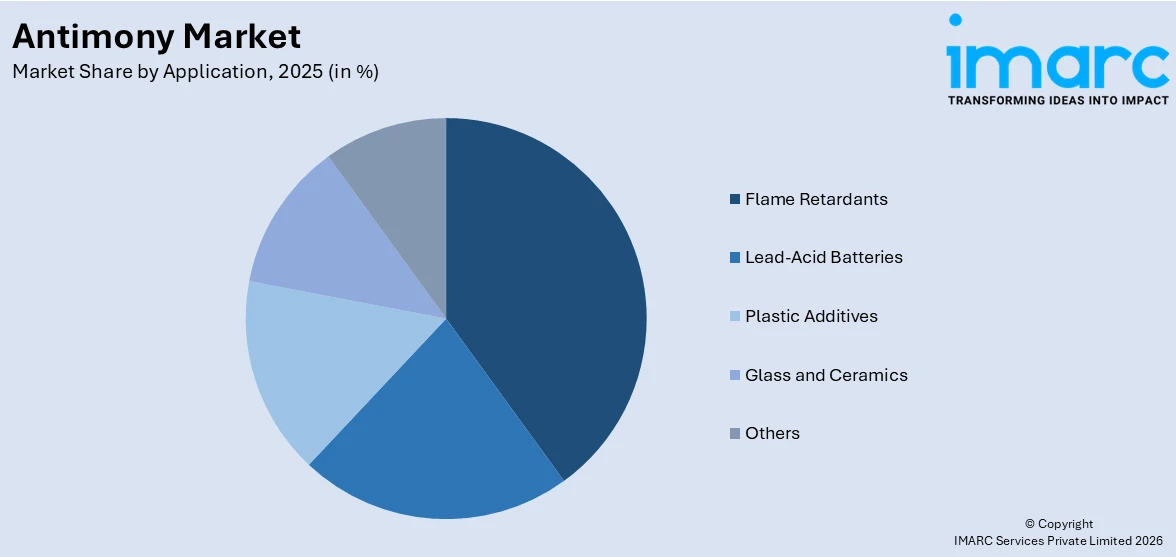
Flame retardants count for the largest market share
A detailed breakup and analysis of the market based on the application have also been provided in the report. This includes flame retardants, lead-acid batteries, plastic additives (stabilizers, catalysts), glass and ceramics, and others. According to the report, flame retardants accounted for the largest market share.
Flame retardants represent a predominant application segment in the market. Its compounds are widely used in combination with halogenated compounds to enhance fire resistance in a variety of materials including plastics, textiles, and rubbers. The growth in this segment is driven by stringent fire safety regulations across multiple end-use industries such as construction, automotive, and electronics. The growth potential in this segment is linked to technological advancements and the development of new applications in various industries.
On the contrary, the use of the product in lead-acid batteries is a significant application segment, especially in the automotive industry. It is alloyed with lead to enhance the battery's mechanical strength and charging characteristics. This segment's growth correlates with the global automotive market, including conventional and electric vehicles, where lead-acid batteries are used for starting, lighting, and ignition purposes.
As a plastic additive, it plays a crucial role as a synergist to enhance the effectiveness of flame retardants in plastics. This application is essential in various consumer goods, electronic components, and construction materials. The growth of this segment is sustained by the ongoing demand in the plastics industry; however, it also faces scrutiny due to environmental and health considerations, driving the search for alternative additives.
Furthermore, in the glass and ceramics industry, it is used to remove bubbles, improve clarity, and impart a desirable color to the products. This application segment, while smaller compared to others, is significant in specialized industrial and artistic applications. The market in this segment is driven by the demand for construction and decorative arts, and it is subject to trends in these respective industries.
Breakup by End-Use Industry:
- Chemical
- Automotive
- Electrical and Electronics
- Others
The report has provided a detailed breakup and analysis of the market based on the end-use industry. This includes chemical, automotive, electrical and electronics, and others.
The chemical industry represents a significant segment of the market, primarily due to the use of its compounds in the production of flame retardants, catalysts, and stabilizers. This segment's growth is influenced by global industrial and safety standards, which dictate the demand for flame retardants.
In the automotive sector, it plays a vital role, especially in the manufacturing of lead-acid batteries. These batteries, alloyed with it, are used in cars for starting, lighting, and ignition. The growth of this segment is closely linked with the automotive industry's overall expansion, including the rise of electric vehicles (EVs).
The electrical and electronics industry is a key end-use segment, especially in the use of flame retardants for electronic devices, components, and housing. The demand in this segment is driven by the ever-growing consumer electronics market and the need for fire safety in electronic products. Additionally, its use in semiconductors and other electronic components contributes to its market growth.
Others segment includes various industries such as construction, defense, and glass manufacturing. In construction, it is used in fire retardant materials, while in defense, it's utilized in ammunition and other applications. The glass industry uses it as a clarifying agent and for color control.
Breakup by Region:
- North America
- United States
- Canada
- Asia Pacific
- China
- Japan
- India
- South Korea
- Australia
- Indonesia
- Others
- Europe
- Germany
- France
- United Kingdom
- Italy
- Spain
- Russia
- Others
- Latin America
- Brazil
- Mexico
- Others
- Middle East and Africa
The market research report has also provided a comprehensive analysis of all the major regional markets, which include North America (the United States and Canada); Asia Pacific (China, Japan, India, South Korea, Australia, Indonesia, and others); Europe (Germany, France, the United Kingdom, Italy, Spain, Russia, and others); Latin America (Brazil, Mexico, and others); and the Middle East and Africa. According to the report, Asia Pacific accounted for the largest market share.
The Asia Pacific region, led by China, is a dominant player in the global market, both as a major producer and consumer. The market in this region benefits from the robust industrial growth, particularly in the automotive, electrical, and electronics sectors. China's significant role in the supply chain, coupled with the region's expanding industrial base, positions the Asia Pacific market for continued growth. Continual innovation in technology and sustainable practices also play a significant role in shaping the regional market dynamics.
The North American market is characterized by stringent regulatory standards, particularly in terms of environmental and health safety, which greatly influence product use in various applications. The demand in this region is driven by the increasing demand for flame retardants, lead-acid batteries, and plastic additives, predominantly in the United States. The market is also witnessing a growing emphasis on recycling, especially from retired lead-acid batteries, as a response to environmental concerns.
Europe's market is driven by advanced industrial and safety standards, particularly in the automotive and electronics sectors. The region's focus on environmental sustainability influences the demand for and use, especially in flame retardants and lead-acid batteries. European countries are also at the forefront of adopting and developing recycling technologies, aligning with the region's stringent environmental policies.
In Latin America, the market is emerging, with growth driven by industrial development in countries such as Brazil and Mexico. The demand in this region is primarily for applications in flame retardants and lead-acid batteries, reflecting the growth in the construction and automotive sectors. The market in Latin America, while smaller compared to other regions, offers potential for growth as industrialization and regulatory frameworks change.
The market in the Middle East and Africa is relatively smaller but holds potential for growth due to industrial development in various countries. The demand in this region is primarily driven by applications in construction materials, particularly flame retardants, and in the automotive sector. The market growth in the Middle East and Africa is influenced by economic diversification efforts and industrialization trends, particularly in Gulf Cooperation Council (GCC) countries and South Africa.
Leading Key Players in the Antimony Industry:
In the antimony market, key players are actively engaged in strategic activities to bolster their market positions. These include expansion of production capacities, investment in research and development for advanced applications, and forging strategic partnerships and collaborations to enhance their global reach. Significant efforts are also directed towards securing stable raw material supplies and optimizing supply chain efficiencies. Additionally, companies are focusing on environmentally sustainable practices, given the increasing regulatory scrutiny on mining and metal industries. Market leaders are also exploring innovative applications of antimony in areas like flame retardants, lead-acid batteries, and plastics, aiming to capitalize on emerging market opportunities.
The market research report has provided a comprehensive analysis of the competitive landscape. Detailed profiles of all major companies have also been provided. Some of the key players in the market include:
- AMG Advanced Metallurgical Group
- BASF SE
- Campine
- Huachang Antimony Industry
- Hunan Chenzhou Mining Group Co. Ltd.
- Korea Zinc Co. Ltd.
- Lambert Metals International
- Mandalay Resources Ltd.
- Nihon Seiko Co., Ltd.
- NYACOL Nano Technologies, Inc.
- Recylex
- Suzuhiro Chemical
- Tri-Star Resources
- United States Antimony
- Village Main Reef Ltd.
- Yunnan Muli Antimony Industry Co. Ltd.
(Please note that this is only a partial list of the key players, and the complete list is provided in the report.)
Latest News:
- On August 2023, Hyundai Motor Group (HMG) stated that it has forged a broad-based strategic alliance across the nickel value chain with Korea Zinc Company Ltd, a prominent non-ferrous metal smelting enterprise.
- On March 2023, BASF SE was chosen by Airbus to design and provide innovative BASF Volatile Organic Compound/Ozone Converter (VOZC) technology for use on A320 Family aircraft beginning in 2024.
- On November 2023, AMG Advanced Metallurgical Group declared the launch of its first hybrid energy storage system at the AMG Liva facility. It mixes lithium batteries with vanadium redox flow batteries in a plant in Hauzenberg, Germany, that is operated by the group's AMG Graphite division.
Antimony Market Report Scope:
| Report Features | Details |
|---|---|
| Base Year of the Analysis | 2025 |
| Historical Period | 2020-2025 |
| Forecast Period | 2026-2034 |
| Units | Billion USD |
| Scope of the Report | Exploration of Historical Trends and Market Outlook, Industry Catalysts and Challenges, Segment-Wise Historical and Future Market Assessment:
|
| Product Types Covered | Antimony Trioxide, Antimony Pentoxide, Alloys, Metal Ingots, Others |
| Applications Covered |
|
| End-Use Industries Covered | Chemical, Automotive, Electrical and Electronics, Others |
| Regions Covered | Asia Pacific, Europe, North America, Latin America, Middle East and Africa |
| Countries Covered | United States, Canada, Germany, France, United Kingdom, Italy, Spain, Russia, China, Japan, India, South Korea, Australia, Indonesia, Brazil, Mexico |
| Companies Covered | AMG Advanced Metallurgical Group, BASF SE, Campine, Huachang Antimony Industry, Hunan Chenzhou Mining Group Co. Ltd., Korea Zinc Co. Ltd, Lambert Metals International, Mandalay Resources Ltd, Nihon Seiko Co., Ltd., NYACOL Nano Technologies, Inc., Recylex, Suzuhiro Chemical, Tri-Star Resources, United States Antimony, Village Main Reef Ltd., Yunnan Muli Antimony Industry Co. Ltd., etc. |
| Customization Scope | 10% Free Customization |
| Post-Sale Analyst Support | 10-12 Weeks |
| Delivery Format | PDF and Excel through Email (We can also provide the editable version of the report in PPT/Word format on special request) |
Key Benefits for Stakeholders:
- IMARC’s industry report offers a comprehensive quantitative analysis of various market segments, historical and current market trends, market forecasts, and dynamics of the antimony market from 2020-2034.
- The research report provides the latest information on the market drivers, challenges, and opportunities in the global antimony market.
- The study maps the leading, as well as the fastest-growing, regional markets. It further enables stakeholders to identify the key country-level markets within each region.
- Porter's five forces analysis assists stakeholders in assessing the impact of new entrants, competitive rivalry, supplier power, buyer power, and the threat of substitution. It helps stakeholders to analyze the level of competition within the antimony industry and its attractiveness.
- The competitive landscape allows stakeholders to understand their competitive environment and provides insight into the current positions of key players in the market.
Frequently Asked Questions About the Antimony Market Report
The global antimony market was valued at USD 2.4 Billion in 2025.
We expect the global antimony market to exhibit a CAGR of 5.31% during 2026-2034.
The increasing demand for antimony in the manufacturing of various semiconductor devices,
including infrared detectors and diodes, batteries, ceramic enamels and paints, etc., as it is a poor conductor of heat and electricity, is primarily driving the global antimony market.
The sudden outbreak of the COVID-19 pandemic had led to the implementation of stringent
lockdown regulations across several nations, resulting in the temporary closure of numerous end use industries, thereby limiting the demand for antimony.
Based on the product type, the global antimony market has been segmented into antimony trioxide, antimony pentoxide, alloys, metal ingots, and others. Among these, antimony trioxide represents currently the largest market share.
Based on the application, the global antimony market can be bifurcated into flame retardants, lead- acid batteries, plastic additives, glass and ceramics, and others. Currently, flame retardants account for the majority of the total market share.
On a regional level, the market has been classified into North America, Europe, Asia Pacific, Middle East and Africa, and Latin America, where Asia Pacific currently dominates the global market.
Some of the major players in the global antimony market include AMG Advanced Metallurgical
Group, BASF SE, Campine, Huachang Antimony Industry, Hunan Chenzhou Mining Group Co. Ltd., Korea Zinc Co. Ltd, Lambert Metals International, Mandalay Resources Ltd, Nihon Seiko Co., Ltd., NYACOL Nano Technologies, Inc., Recylex, Suzuhiro Chemical, Tri-Star Resources, United States Antimony, Village Main Reef Ltd., Yunnan Muli Antimony Industry Co. Ltd., etc.
Need more help?
- Speak to our experienced analysts for insights on the current market scenarios.
- Include additional segments and countries to customize the report as per your requirement.
- Gain an unparalleled competitive advantage in your domain by understanding how to utilize the report and positively impacting your operations and revenue.
- For further assistance, please connect with our analysts.
 Request Customization
 Speak to an Analyst
 Request Brochure
 Inquire Before Buying
Benefits of Customization
- Personalize this research
- Triangulate with your data
- Get data as per your format and definition
- Gain a deeper dive into a specific application, geography, customer, or competitor
- Any level of personalization
Get in Touch With Us
UNITED STATES
Phone: +1-201-971-6302
INDIA
Phone: +91-120-433-0800
UNITED KINGDOM
Phone: +44-753-714-6104
Email: [email protected]
Client Testimonials


.webp)


