
Antimony Prices, Trend, Chart, Demand, Market Analysis, News, Historical and Forecast Data Report 2026 Edition
Antimony Price Trend, Index and Forecast
Track real-time and historical antimony prices across global regions. Updated monthly with market insights, drivers, and forecasts.
Antimony Prices July 2026
| Region | Price (Pricing Index) | Latest Movement |
|---|---|---|
| Europe | 33.7 | 4.4% ↑ Up |
| Northeast Asia | 17.4 | -12.3% ↓ Down |
| North America | 23.81 | -11.6% ↓ Down |
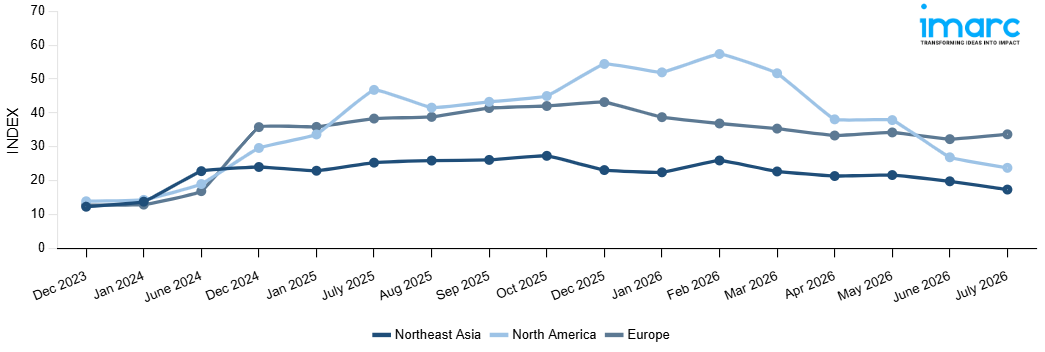
Antimony Price Index (INDEX):
The chart below highlights monthly antimony prices across different regions.
Get Access to Monthly/Quarterly/Yearly Prices, Request Sample
Market Overview Q1 Ending March 2026
Europe: The antimony prices in Europe reached Pricing Index 35.38 in March 2026. The downward pricing movement registered between December and March 2026 was 18.1%. Significantly weakened demand from the flame retardant, lead acid battery, and specialty alloy manufacturing sectors drove a notable reduction in procurement activity and contributed to strongly bearish antimony market conditions across Europe throughout the review period. Ample import cargo availability from Chinese and Central Asian supplying nations intensified downward pricing pressure and overwhelmed prevailing European regional supply balances during the quarter. Considerably declining upstream antimony ore mining and smelting costs in key producing nations reduced manufacturing costs and eroded support for existing antimony price levels throughout the period.
Northeast Asia: The antimony prices in Northeast Asia reached Pricing Index 22.74 in March 2026. The downward pricing movement registered between December and March 2026 was 1.8%. Marginally softening demand from the flame retardant, semiconductor, and specialty glass manufacturing sectors tempered procurement activity and contributed to mild bearish conditions across Northeast Asian markets throughout the review period. Adequate domestic Chinese production output from regional mining and smelting facilities maintained sufficient supply conditions and placed modest downward pressure on prevailing antimony market rates during the quarter. Slightly declining upstream antimony ore processing and refining costs at key domestic producing facilities reduced manufacturing expenses and weakened the cost support for existing price levels.
North America: The antimony prices in North America reached Pricing Index 51.70 in March 2026. The downward pricing movement registered between December and March 2026 was 5.1%. Throughout the review period, low demand for flame retardant chemicals, lead acid batteries, and specialty alloys limited purchases, leading to pessimistic antimony market trends in North American markets. Constant pressure on current prices in North American markets was driven by competitive imported cargo from Asia and Europe, where the countries sourcing the cargo had less control over their prices. Low production and processing costs for antimony ores in leading antimony producing countries reduced delivery costs, making it difficult for local producers to maintain their prices.
Market Overview Q4 Ending December 2025
Europe: The antimony prices in Europe reached Pricing Index 43.20 in December 2025. The upward pricing movement registered between September and December 2025 was 4.3%. The moderate price appreciation was primarily driven by sustained demand from the flame retardant and lead acid battery manufacturing sectors, which maintained robust procurement activity throughout the quarter. Tightened supply conditions, driven by constrained primary ore availability and reduced import volumes, further limited regional market supply. Firm upstream stibnite ore processing and smelting costs elevated production expenses for regional refiners, reinforcing upward pricing dynamics.
Northeast Asia: The antimony prices in Northeast Asia reached Pricing Index 23.15 in December 2025. The downward pricing movement registered between September and December 2025 was 11.5%. Weakened downstream demand from the battery alloy and flame-retardant production industries, which lowered procurement volumes amid muted industrial activity across the region, was the main cause of the notable price reduction. Support for production costs for local smelters and refiners was further undermined by lower upstream stibnite ore feedstock costs. While excess refined antimony production increased supply side pressure, high inventory levels among large manufacturers heightened competitive discounting tactics to speed stock clearance.
North America: The antimony prices in North America reached Pricing Index 54.45 in December 2025. The upward pricing movement registered between September and December 2025 was 25.8%. The substantial price appreciation was driven by acute supply tightness stemming from constrained global mine production and reduced availability of refined antimony imports, significantly limiting domestic volumes. Robust demand from the flame retardant, ammunition, and lead acid battery manufacturing sectors intensified procurement competition amid critically limited spot market availability. Elevated international benchmark valuations and rising logistics costs further amplified delivered pricing pressures across the supply chain.
Market Overview Q3 Ending September 2025
Europe: Several factors contributed to the price rise, including the strong demand for antimony in both the manufacturing and electronics sectors. The demand for flame retardants, a primary industrial application of antimony, surged due to stricter regulations in construction materials across Europe, particularly in the EU. Supply-side issues, particularly in the mining sectors of key producers like China, also contributed to reduced availability, further pushing up prices. Logistics costs, including international shipping and port handling, were higher, further impacting the overall cost structure. Additionally, fluctuating currency rates added a cost burden to imports of antimony and its derivatives.
Northeast Asia: The metal's strong performance in the electronics and battery industries, especially in nations like South Korea and Japan, was the main driver of the price increase. The supply chain was impacted by concerns about disruptions in international shipping, even after logistical costs stayed largely unchanged. Price patterns were influenced by persistent supply chain restrictions brought on by the global trade climate as well as currency changes, particularly those between the Chinese yuan and other regional currencies.
North America: In North America, antimony prices saw a substantial increase. The rise in prices was influenced by growing demand from industries such as automotive and electronics, where antimony is used for flame retardants and as an alloying agent in batteries. Furthermore, the recent expansion of manufacturing capacities in the US and Canada led to higher demand for antimony as part of the supply chain for advanced materials. The cost of international shipping to North America continued to be a key factor in price increases, as high freight costs added to the overall expense of imported goods. Additionally, trade tensions and tariffs imposed on certain countries impacted the cost of imported antimony from regions like China, further driving up prices.
Antimony Price Trend, Market Analysis, and News
IMARC's latest publication, “Antimony Prices, Trend, Chart, Demand, Market Analysis, News, Historical and Forecast Data Report 2026 Edition,” presents a detailed examination of the antimony market, providing insights into both global and regional trends that are shaping prices. This report delves into the spot price of antimony at major ports and analyzes the composition of prices, including FOB and CIF terms. It also presents detailed antimony prices trend analysis by region, covering North America, Europe, Asia Pacific, Latin America, and Middle East and Africa. The factors affecting antimony pricing, such as the dynamics of supply and demand, geopolitical influences, and sector-specific developments, are thoroughly explored. This comprehensive report helps stakeholders stay informed with the latest market news, regulatory updates, and technological progress, facilitating informed strategic decision-making and forecasting.
Antimony Industry Analysis
The global antimony industry size reached 86.6 Thousand Tons in 2025. By 2034, IMARC Group expects the market to reach 104.5 Thousand Tons, at a projected CAGR of 2.01% during 2026-2034. The market is driven by its use in flame retardants, alloying agents in batteries, rising adoption in electronics and renewable energy applications, and advancements in antimony based materials for energy storage applications.
Latest developments in the antimony industry:
- September 2025: The US Department of War awarded a $43.4 Million Defense Production Act (DPA) Title III grant to Alaska Range Resources, LLC (ARR), a wholly owned subsidiary of Nova Minerals Ltd. This funding aims to establish a domestic supply chain for military-grade antimony trisulfide by extracting, concentrating, and refining stibnite from the Estelle Project in Alaska.
- June 2024: AMG Critical Materials N.V. subsidiary AMG Lithium B.V., AMG’s wholly owned subsidiary announced a capital investment of GBP 16 million in Savannah Resources Plc, the developer of the Barroso Lithium Project in Portugal, Europe’s largest spodumene lithium deposit.
- March 2024: BASF was selected by Airbus to develop and supply a new Volatile Organic Compound/Ozone Converter (VOZC) technology from BASF to be used on its A320 Family aircraft starting in 2024.
Product Description
Antimony refers to a chemical element with the symbol Sb (from Latin: stibium) and atomic number 51. It is a lustrous gray metalloid that exhibits both non-metallic and metallic properties. It is commonly found in nature as the sulfide mineral stibnite (Sb2S3). This element has a long history of use dating back to ancient times when it was used in medicines and cosmetics. It is primarily used in the production of flame retardants due to its ability to enhance the flame resistance of various metals. It is also a significant component in the manufacturing of lead-acid batteries, alloys, and semiconductors. Small amounts of antimony are added to lead to an increase its strength and hardness, thereby making it valuable in the production of bullets and cable sheathing.
Report Coverage
| Key Attributes | Details |
|---|---|
| Product Name | Antimony |
| Report Features | Exploration of Historical Trends and Market Outlook, Industry Demand, Industry Supply, Gap Analysis, Challenges, Antimony Price Analysis, and Segment-Wise Assessment. |
| Currency/Units | US$ (Data can also be provided in local currency) or Metric Tons |
| Region/Countries Covered | The current coverage includes analysis at the global and regional levels only. Based on your requirements, we can also customize the report and provide specific information for the following countries: Asia Pacific: China, India, Indonesia, Pakistan, Bangladesh, Japan, Philippines, Vietnam, Thailand, South Korea, Malaysia, Nepal, Taiwan, Sri Lanka, Hongkong, Singapore, Australia, and New Zealand Europe: Germany, France, United Kingdom, Italy, Spain, Russia, Turkey, Netherlands, Poland, Sweden, Belgium, Austria, Ireland, Switzerland, Norway, Denmark, Romania, Finland, Czech Republic, Portugal and Greece North America: United States and Canada Latin America: Brazil, Mexico, Argentina, Columbia, Chile, Ecuador, and Peru Middle East & Africa: Saudi Arabia, UAE, Israel, Iran, South Africa, Nigeria, Oman, Kuwait, Qatar, Iraq, Egypt, Algeria, and Morocco The list of countries presented is not exhaustive. Information on additional countries can be provided if required by the client. |
| Information Covered for Key Suppliers |
|
| Customization Scope | The report can be customized as per the requirements of the customer |
| Report Price and Purchase Option |
Plan A: Monthly Updates - Annual Subscription
Plan B: Quarterly Updates - Annual Subscription
Plan C: Biannually Updates - Annual Subscription
|
| Post-Sale Analyst Support | 360-degree analyst support after report delivery |
| Delivery Format | PDF and Excel through email (We can also provide the editable version of the report in PPT/Word format on special request) |
Key Benefits for Stakeholders:
- IMARC’s report presents a detailed analysis of antimony pricing, covering global and regional trends, spot prices at key ports, and a breakdown of FOB and CIF prices.
- The study examines factors affecting antimony price trend, including input costs, supply-demand shifts, and geopolitical impacts, offering insights for informed decision-making.
- The competitive landscape review equips stakeholders with crucial insights into the latest market news, regulatory changes, and technological advancements, ensuring a well-rounded, strategic overview for forecasting and planning.
- IMARC offers various subscription options, including monthly, quarterly, and biannual updates, allowing clients to stay informed with the latest market trends, ongoing developments, and comprehensive market insights. The antimony price charts ensure our clients remain at the forefront of the industry.
Frequently Asked Questions About the Antimony Price Index Report
The antimony prices in July 2026 were 33.7 Pricing Index in Europe, 17.4 Pricing Index in Northeast Asia, and 23.81 Pricing Index in North America.
The antimony pricing data is updated on a monthly basis.
We provide the pricing data primarily in the form of an Excel sheet and a PDF.
Yes, our report includes a forecast for antimony prices.
The regions covered include North America, Europe, Asia Pacific, Middle East, and Latin America. Countries can be customized based on the request (additional charges may be applicable).
Yes, we provide both FOB and CIF prices in our report.
Need more help?
- Speak to our experienced analysts for insights on the current market scenarios.
- Include additional segments and countries to customize the report as per your requirement.
- Gain an unparalleled competitive advantage in your domain by understanding how to utilize the report and positively impacting your operations and revenue.
- For further assistance, please connect with our analysts.
 Request Customization
 Inquire Before Buying
 Speak to an Analyst
 Request Brochure
Benefits of Customization
- Personalize this research
- Triangulate with your data
- Get data as per your format and definition
- Gain a deeper dive into a specific application, geography, customer, or competitor
- Any level of personalization
Get in Touch With Us
UNITED STATES
Phone: +1-201-971-6302
INDIA
Phone: +91-120-433-0800
UNITED KINGDOM
Phone: +44-753-714-6104
Email: [email protected]
Client Testimonials


.webp)


Why Choose Us
IMARC offers trustworthy, data-centric insights into commodity pricing and evolving market trends, enabling businesses to make well-informed decisions in areas such as procurement, strategic planning, and investments. With in-depth knowledge spanning more than 1000 commodities and a vast global presence in over 150 countries, we provide tailored, actionable intelligence designed to meet the specific needs of diverse industries and markets.
1000
+Commodities
150
+Countries Covered
3000
+Clients
20
+Industry
Robust Methodologies & Extensive Resources
IMARC delivers precise commodity pricing insights using proven methodologies and a wealth of data to support strategic decision-making.
Subscription-Based Databases
Our extensive databases provide detailed commodity pricing, import-export trade statistics, and shipment-level tracking for comprehensive market analysis.
Primary Research-Driven Insights
Through direct supplier surveys and expert interviews, we gather real-time market data to enhance pricing accuracy and trend forecasting.
Extensive Secondary Research
We analyze industry reports, trade publications, and market studies to offer tailored intelligence and actionable commodity market insights.
Trusted by 3000+ industry leaders worldwide to drive data-backed decisions. From global manufacturers to government agencies, our clients rely on us for accurate pricing, deep market intelligence, and forward-looking insights.