
Asia Pacific Business Travel Market Size, Share, Trends and Forecast by Type, Purpose Type, Expenditure, Age Group, Service Type, Travel Type, End User, and Country, 2026-2034
Market Overview 2026-2034:
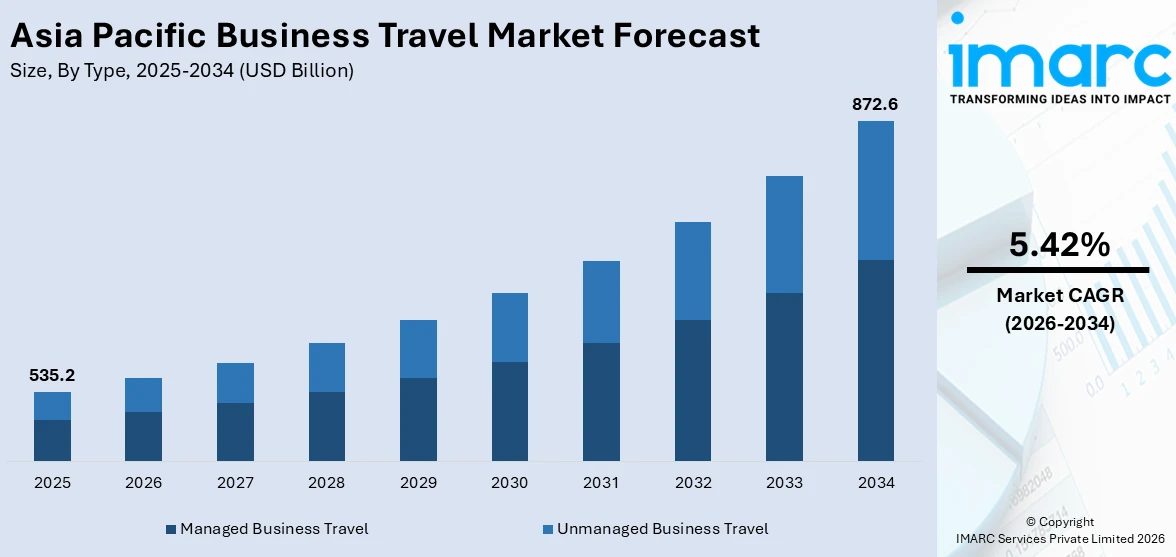
The Asia Pacific business travel market size reached USD 535.2 Billion in 2025. Looking forward, IMARC Group expects the market to reach USD 872.6 Billion by 2034, exhibiting a growth rate (CAGR) of 5.42% during 2026-2034.
|
Report Attribute
|
Key Statistics
|
|---|---|
|
Base Year
|
2025
|
|
Forecast Years
|
2026-2034
|
|
Historical Years
|
2020-2025
|
|
Market Size in 2025
|
USD 535.2 Billion |
|
Market Forecast in 2034
|
USD 872.6 Billion |
| Market Growth Rate (2026-2034) | 5.42% |
Business travel refers to a journey that is taken explicitly for work or expanding business operations. Also known as corporate travel, it includes various components like client meetings, promoting brands and products, business expansion, and employee training and incentives. In the Asia Pacific region, business travel is gaining immense preference among organizations due to rapid globalization and increased business activities.
To get more information on this market Request Sample
The Asia Pacific business travel market is primarily driven by the rising middle class and stable economic growth in the region. The increasing adoption of technology in travel management processes is also contributing to the market. Additionally, rapid digitization in the tourism and corporate sectors, coupled with the penetration of the Internet of Things (IoT), has helped both travelers and travel operators to operate swiftly and efficiently. Furthermore, there has been a rising trend of B-leisure travel, which incorporates business with pleasure elements while offering recreational activities for relieving stress and improving work efficiency.
Key Market Segmentation:
IMARC Group provides an analysis of the key trends in each sub-segment of the Asia Pacific business travel market report, along with forecasts at the regional and country levels from 2026-2034. Our report has categorized the market based on type, purpose type, expenditure, age group, service type, travel type and end user.
Breakup by Type:
- Managed Business Travel
- Unmanaged Business Travel
Breakup by Purpose Type:
- Marketing
- Internal Meetings
- Trade Shows
- Product Launch
- Others
Breakup by Expenditure:
- Travel Fare
- Lodging
- Dining
- Others
Breakup by Age Group:
- Travelers Below 40 Years
- Travelers Above 40 Years
Breakup by Service Type:
- Transportation
- Food and Lodging
- Recreational Activities
- Others
Breakup by Travel Type:
- Group Travel
- Solo Travel
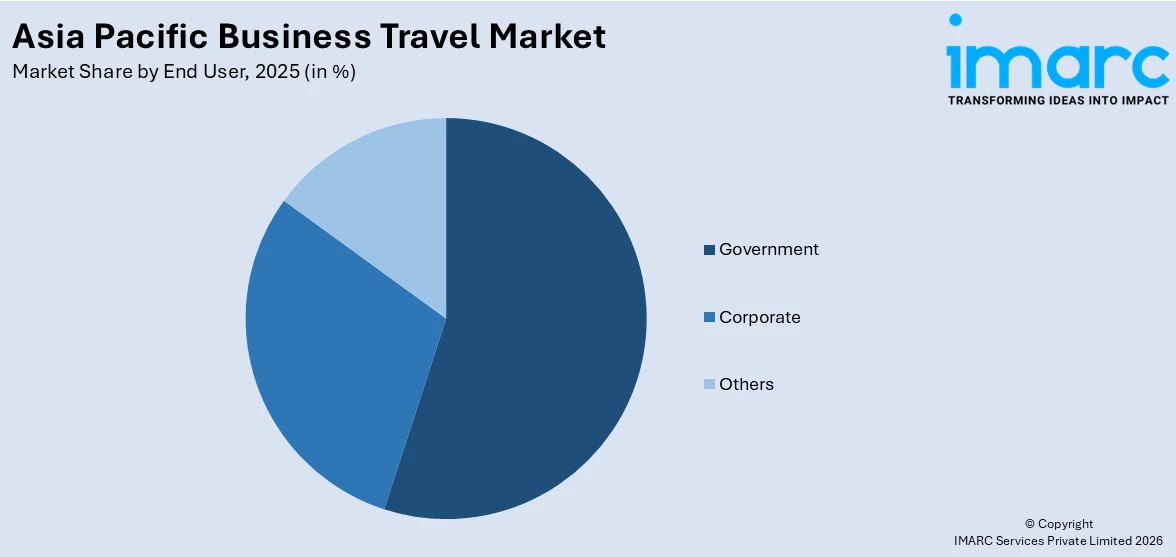
Breakup by End User:
Access the comprehensive market breakdown Request Sample
- Government
- Corporate
- Others
Breakup by Country:
- China
- Japan
- India
- South Korea
- Australia
- Indonesia
- Others
Competitive Landscape:
The competitive landscape of the industry has also been examined along with the profiles of the key players.
Report Coverage:
| Report Features | Details |
|---|---|
| Base Year of the Analysis | 2025 |
| Historical Period | 2020-2025 |
| Forecast Period | 2026-2034 |
| Units | Billion USD |
| Segment Coverage | Type, Purpose Type, Expenditure, Age Group, Service Type, Travel Type, End User, Country |
| Countries Covered | China, Japan, India, South Korea, Australia, Indonesia, Others |
| Customization Scope | 10% Free Customization |
| Post-Sale Analyst Support | 10-12 Weeks |
| Delivery Format | PDF and Excel through Email (We can also provide the editable version of the report in PPT/Word format on special request) |
Key Questions Answered in This Report:
- How has the Asia Pacific business travel market performed so far and how will it perform in the coming years?
- What has been the impact of COVID-19 on the Asia Pacific business travel market?
- What are the key regional markets?
- What is the breakup of the market based on the type?
- What is the breakup of the market based on the purpose type?
- What is the breakup of the market based on the expenditure?
- What is the breakup of the market based on the age group?
- What is the breakup of the market based on the service type?
- What is the breakup of the market based on the travel type?
- What is the breakup of the market based on the end user?
- What are the various stages in the value chain of the industry?
- What are the key driving factors and challenges in the industry?
- What is the structure of the Asia Pacific business travel market and who are the key players?
- What is the degree of competition in the industry?
Need more help?
- Speak to our experienced analysts for insights on the current market scenarios.
- Include additional segments and countries to customize the report as per your requirement.
- Gain an unparalleled competitive advantage in your domain by understanding how to utilize the report and positively impacting your operations and revenue.
- For further assistance, please connect with our analysts.
 Request Customization
 Speak to an Analyst
 Request Brochure
 Inquire Before Buying
Benefits of Customization
- Personalize this research
- Triangulate with your data
- Get data as per your format and definition
- Gain a deeper dive into a specific application, geography, customer, or competitor
- Any level of personalization
Get in Touch With Us
UNITED STATES
Phone: +1-201-971-6302
INDIA
Phone: +91-120-433-0800
UNITED KINGDOM
Phone: +44-753-714-6104
Email: [email protected]
Client Testimonials


.webp)


