Market Overview:
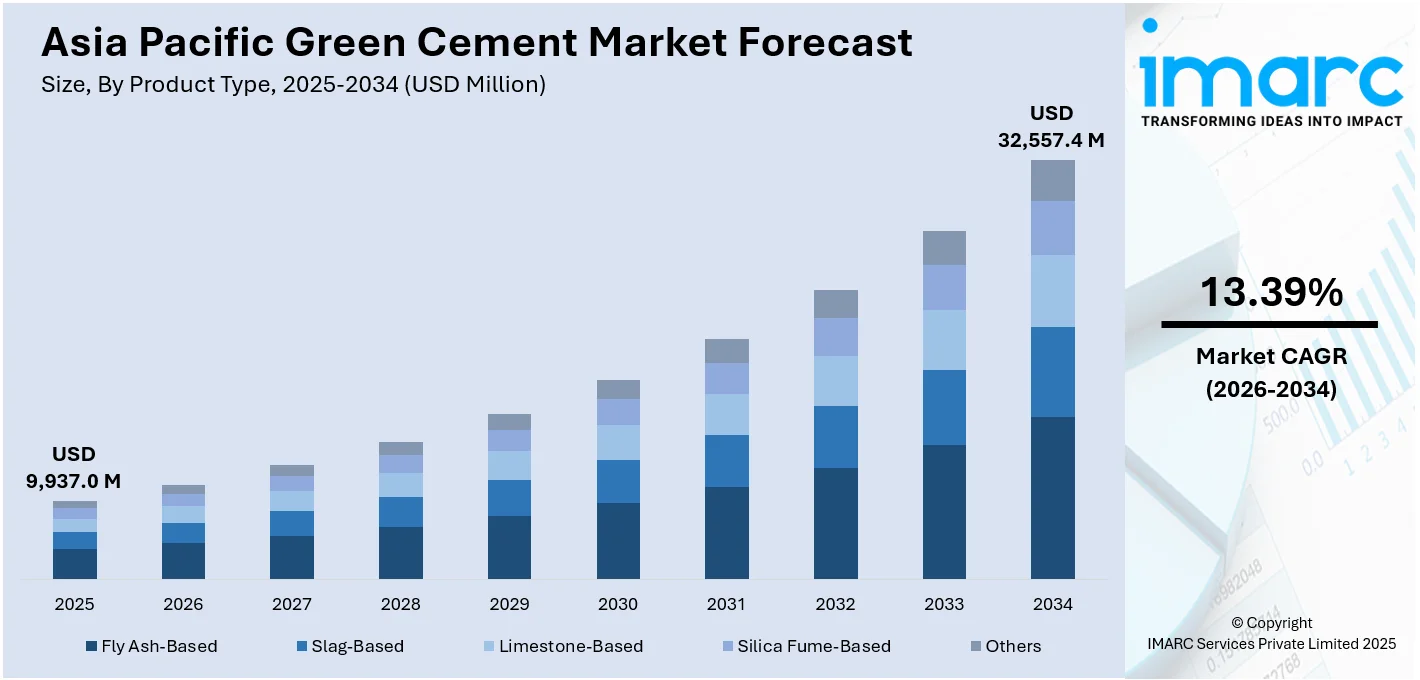
The Asia Pacific green cement market size reached US$
5,619.8 Million in 2021. Looking forward, IMARC Group expects the market to reach US$
14,152.4 Million by 2027, exhibiting a growth rate (CAGR) of
16.7% during 2022-2027.
Green cement is an essential raw material used in the construction industry. It utilizes industrial waste materials, such as blast furnace slag, micro silica and fly ash, to minimize the negative ecological impact by employing novel carbon-negative processes. In the Asia Pacific region, the growing concerns about climate change, environmental pollution, depletion of raw materials, and the rise in fuel prices have led to the development of sustainable green cement varieties.
The Asia Pacific represents one of the largest green cement markets. The primary factor driving the growth of the market include rapid urbanization and increasing focus on ecological concerns. This has shifted preferences toward an eco-friendly and efficient construction material, such as green cement. Moreover, the cost-effectiveness and the easy availability of green cement across the region are also catalyzing the market growth. Furthermore, with the flourishing construction industry and the on-going infrastructural projects, various stringent regulations and policies have been introduced by governments in the region supporting the adoption of green cement.
Key Market Segmentation:
IMARC Group provides an analysis of the key trends in each sub-segment of the Asia Pacific green cement market report, along with forecasts at the regional and country level from 2022-2027. Our report has categorized the market based on product type and end use industry.
Breakup by Product Type:
- Fly Ash-Based
- Slag-Based
- Limestone-Based
- Silica Fume-Based
- Others
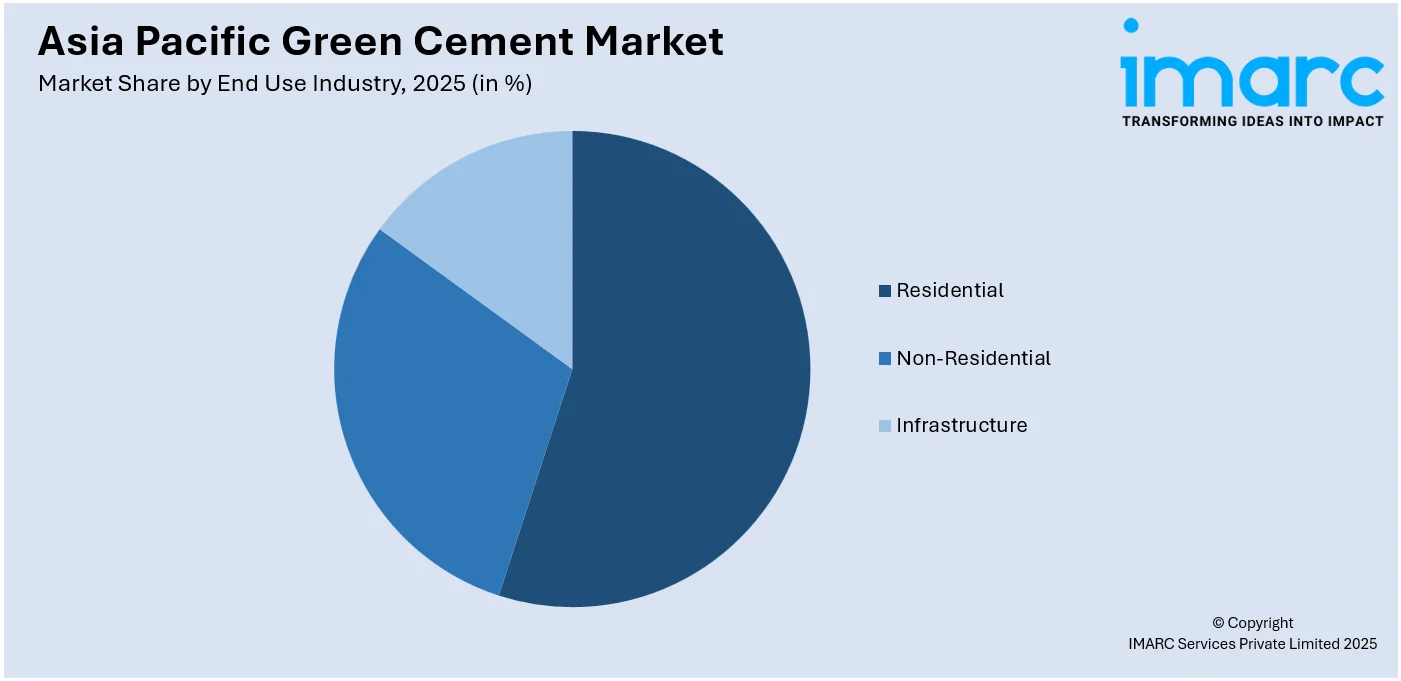
Breakup by End Use Industry:
- Residential
- Non-Residential
- Infrastructure
Breakup by Country:
- China
- Japan
- India
- South Korea
- Australia
- Indonesia
- Others
Competitive Landscape:
The competitive landscape of the industry has also been examined along with the profiles of the key players.
Report Coverage:
Report Features |
Details |
---|
Base Year of the Analysis |
2021 |
Historical Period |
2016-2021 |
Forecast Period |
2022-2027 |
Units |
US$ Million |
Segment Coverage |
Product Type, End Use Industry, Country |
Countries Covered |
China, Japan, India, South Korea, Australia, Indonesia, Others |
Customization Scope |
10% Free Customization |
Report Price and Purchase Option |
Single User License: US$ 2499
Five User License: US$ 3499
Corporate License: US$ 4499 |
Post-Sale Analyst Support |
10-12 Weeks |
Delivery Format |
PDF and Excel through Email (We can also provide the editable version of the report in PPT/Word format on special request) |
Key Questions Answered in This Report:
- How has the Asia Pacific green cement market performed so far and how will it perform in the coming years?
- What has been the impact of COVID-19 on the Asia Pacific green cement market?
- What are the key regional markets?
- What is the breakup of the market based on the product type?
- What is the breakup of the market based on the end use industry?
- What are the various stages in the value chain of the industry?
- What are the key driving factors and challenges in the industry?
- What is the structure of the Asia Pacific green cement market and who are the key players?
- What is the degree of competition in the industry?
1 Preface
2 Scope and Methodology
2.1 Objectives of the Study
2.2 Stakeholders
2.3 Data Sources
2.3.1 Primary Sources
2.3.2 Secondary Sources
2.4 Market Estimation
2.4.1 Bottom-Up Approach
2.4.2 Top-Down Approach
2.5 Forecasting Methodology
3 Executive Summary
4 Introduction
4.1 Overview
4.2 Key Industry Trends
5 Asia Pacific Green Cement Market
5.1 Market Overview
5.2 Market Performance
5.3 Impact of COVID-19
5.4 Market Forecast
6 Market Breakup by Product Type
6.1 Fly Ash-Based
6.1.1 Market Trends
6.1.2 Market Forecast
6.2 Slag-Based
6.2.1 Market Trends
6.2.2 Market Forecast
6.3 Limestone-Based
6.3.1 Market Trends
6.3.2 Market Forecast
6.4 Silica Fume-Based
6.4.1 Market Trends
6.4.2 Market Forecast
6.5 Others
6.5.1 Market Trends
6.5.2 Market Forecast
7 Market Breakup by End Use Industry
7.1 Residential
7.1.1 Market Trends
7.1.2 Market Forecast
7.2 Non-Residential
7.2.1 Market Trends
7.2.2 Market Forecast
7.3 Infrastructure
7.3.1 Market Trends
7.3.2 Market Forecast
8 Market Breakup by Country
8.1 China
8.1.1 Market Trends
8.1.2 Market Breakup by Product Type
8.1.3 Market Breakup by End Use Industry
8.1.4 Market Forecast
8.2 Japan
8.2.1 Market Trends
8.2.2 Market Breakup by Product Type
8.2.3 Market Breakup by End Use Industry
8.2.4 Market Forecast
8.3 India
8.3.1 Market Trends
8.3.2 Market Breakup by Product Type
8.3.3 Market Breakup by End Use Industry
8.3.4 Market Forecast
8.4 South Korea
8.4.1 Market Trends
8.4.2 Market Breakup by Product Type
8.4.3 Market Breakup by End Use Industry
8.4.4 Market Forecast
8.5 Australia
8.5.1 Market Trends
8.5.2 Market Breakup by Product Type
8.5.3 Market Breakup by End Use Industry
8.5.4 Market Forecast
8.6 Indonesia
8.6.1 Market Trends
8.6.2 Market Breakup by Product Type
8.6.3 Market Breakup by End Use Industry
8.6.4 Market Forecast
8.7 Others
8.7.1 Market Trends
8.7.2 Market Breakup by Product Type
8.7.3 Market Breakup by End Use Industry
8.7.4 Market Forecast
9 SWOT Analysis
9.1 Overview
9.2 Strengths
9.3 Weaknesses
9.4 Opportunities
9.5 Threats
10 Value Chain Analysis
11 Porters Five Forces Analysis
11.1 Overview
11.2 Bargaining Power of Buyers
11.3 Bargaining Power of Suppliers
11.4 Degree of Competition
11.5 Threat of New Entrants
11.6 Threat of Substitutes
12 Price Analysis
13 Policy and Regulatory Landscape
14 Competitive Landscape
14.1 Market Structure
14.2 Key Players
14.3 Profiles of Key Players
List of Figures
Figure 1: Asia Pacific: Green Cement Market: Major Drivers and Challenges
Figure 2: Asia Pacific: Green Cement Market: Sales Value (in Million US$), 2016-2021
Figure 3: Asia Pacific: Green Cement Market Forecast: Sales Value (in Million US$), 2022-2027
Figure 4: Asia Pacific: Green Cement Market: Breakup by Product Type (in %), 2021
Figure 5: Asia Pacific: Green Cement Market: Breakup by End Use Industry (in %), 2021
Figure 6: Asia Pacific: Green Cement Market: Breakup by Country (in %), 2021
Figure 7: Asia Pacific: Green Cement (Fly Ash-Based) Market: Sales Value (in Million US$), 2016 & 2021
Figure 8: Asia Pacific: Green Cement (Fly Ash-Based) Market Forecast: Sales Value (in Million US$), 2022-2027
Figure 9: Asia Pacific: Green Cement (Slag-Based) Market: Sales Value (in Million US$), 2016 & 2021
Figure 10: Asia Pacific: Green Cement (Slag-Based) Market Forecast: Sales Value (in Million US$), 2022-2027
Figure 11: Asia Pacific: Green Cement (Limestone-Based) Market: Sales Value (in Million US$), 2016 & 2021
Figure 12: Asia Pacific: Green Cement (Limestone-Based) Market Forecast: Sales Value (in Million US$), 2022-2027
Figure 13: Asia Pacific: Green Cement (Silica Fume-Based) Market: Sales Value (in Million US$), 2016 & 2021
Figure 14: Asia Pacific: Green Cement (Silica Fume-Based) Market Forecast: Sales Value (in Million US$), 2022-2027
Figure 15: Asia Pacific: Green Cement (Other Product Types) Market: Sales Value (in Million US$), 2016 & 2021
Figure 16: Asia Pacific: Green Cement (Other Product Types) Market Forecast: Sales Value (in Million US$), 2022-2027
Figure 17: Asia Pacific: Green Cement (Residential) Market: Sales Value (in Million US$), 2016 & 2021
Figure 18: Asia Pacific: Green Cement (Residential) Market Forecast: Sales Value (in Million US$), 2022-2027
Figure 19: Asia Pacific: Green Cement (Non-Residential) Market: Sales Value (in Million US$), 2016 & 2021
Figure 20: Asia Pacific: Green Cement (Non-Residential) Market Forecast: Sales Value (in Million US$), 2022-2027
Figure 21: Asia Pacific: Green Cement (Infrastructure) Market: Sales Value (in Million US$), 2016 & 2021
Figure 22: Asia Pacific: Green Cement (Infrastructure) Market Forecast: Sales Value (in Million US$), 2022-2027
Figure 23: China: Green Cement Market: Sales Value (in Million US$), 2016 & 2021
Figure 24: China: Green Cement Market: Breakup by Product Type (in %), 2021
Figure 25: China: Green Cement Market: Breakup by End Use Industry (in %), 2021
Figure 26: China: Green Cement Market Forecast: Sales Value (in Million US$), 2022-2027
Figure 27: Japan: Green Cement Market: Sales Value (in Million US$), 2016 & 2021
Figure 28: Japan: Green Cement Market: Breakup by Product Type (in %), 2021
Figure 29: Japan: Green Cement Market: Breakup by End Use Industry (in %), 2021
Figure 30: Japan: Green Cement Market Forecast: Sales Value (in Million US$), 2022-2027
Figure 31: India: Green Cement Market: Sales Value (in Million US$), 2016 & 2021
Figure 32: India: Green Cement Market: Breakup by Product Type (in %), 2021
Figure 33: India: Green Cement Market: Breakup by End Use Industry (in %), 2021
Figure 34: India: Green Cement Market Forecast: Sales Value (in Million US$), 2022-2027
Figure 35: South Korea: Green Cement Market: Sales Value (in Million US$), 2016 & 2021
Figure 36: South Korea: Green Cement Market: Breakup by Product Type (in %), 2021
Figure 37: South Korea: Green Cement Market: Breakup by End Use Industry (in %), 2021
Figure 38: South Korea: Green Cement Market Forecast: Sales Value (in Million US$), 2022-2027
Figure 39: Australia: Green Cement Market: Sales Value (in Million US$), 2016 & 2021
Figure 40: Australia: Green Cement Market: Breakup by Product Type (in %), 2021
Figure 41: Australia: Green Cement Market: Breakup by End Use Industry (in %), 2021
Figure 42: Australia: Green Cement Market Forecast: Sales Value (in Million US$), 2022-2027
Figure 43: Indonesia: Green Cement Market: Sales Value (in Million US$), 2016 & 2021
Figure 44: Indonesia: Green Cement Market: Breakup by Product Type (in %), 2021
Figure 45: Indonesia: Green Cement Market: Breakup by End Use Industry (in %), 2021
Figure 46: Indonesia: Green Cement Market Forecast: Sales Value (in Million US$), 2022-2027
Figure 47: Others: Green Cement Market: Sales Value (in Million US$), 2016 & 2021
Figure 48: Others: Green Cement Market Forecast: Sales Value (in Million US$), 2022-2027
Figure 49: Asia Pacific: Green Cement Industry: SWOT Analysis
Figure 50: Asia Pacific: Green Cement Industry: Value Chain Analysis
Figure 51: Asia Pacific: Green Cement Industry: Porter’s Five Forces Analysis
List of Tables
Table 1: Asia Pacific: Green Cement Market Forecast: Key Industry Highlights, 2021 and 2027
Table 2: Asia Pacific: Green Cement Market Forecast: Breakup by Product Type (in Million US$), 2022-2027
Table 3: Asia Pacific: Green Cement Market Forecast: Breakup by End Use Industry (in Million US$), 2022-2027
Table 4: Asia Pacific: Green Cement Market Forecast: Breakup by Country (in Million US$), 2022-2027
Table 5: Asia Pacific: Green Cement Market: Competitive Structure
Table 6: Asia Pacific: Green Cement Market: Key Players