
Asia Pacific Microdisplay Market Size, Share, Trends and Forecast by Product, Technology, Resolution, Brightness, End User, and Country, 2026-2034
Market Overview:
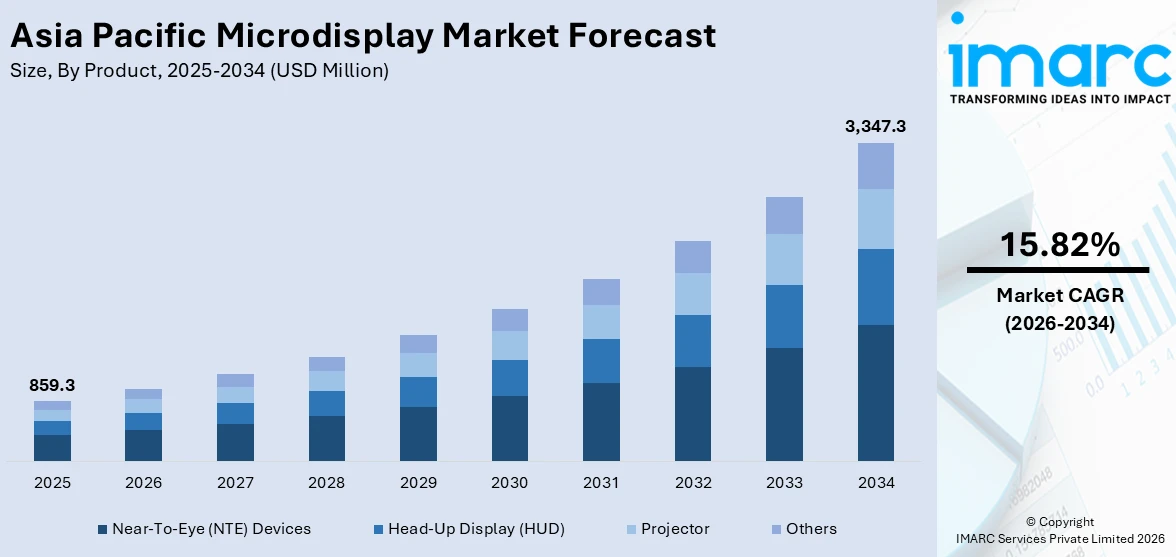
The Asia Pacific microdisplay market size reached USD 859.3 Million in 2025. Looking forward, IMARC Group expects the market to reach USD 3,347.3 Million by 2034, exhibiting a growth rate (CAGR) of 15.82% during 2026-2034.
|
Report Attribute
|
Key Statistics
|
|---|---|
|
Base Year
|
2025
|
|
Forecast Years
|
2026-2034
|
|
Historical Years
|
2020-2025
|
|
Market Size in 2025
|
USD 859.3 Million |
|
Market Forecast in 2034
|
USD 3,347.3 Million |
| Market Growth Rate (2026-2034) | 15.82% |
Microdisplays are miniature display units with a microlevel resolution and diagonal screen size of less than two inches. They are mainly found in two variants: transmissive and reflective displays. The transmissive microdisplays enable the light to pass through the display without reflection. Whereas in reflective microdisplays, the image is formed when the light is diverted into the projection path. They are commonly used in rear-projection TVs and backlit laptop computer screens as they create large images from a lightweight and small unit. Microdisplays can also integrate drivers with display chip and offer reduced manufacturing costs and power dissipation than the conventional direct-view displays like CRT and flat-panel LCDs.
To get more information on this market Request Sample
The Asia Pacific microdisplay market is primarily driven by their increasing applications in industries ranging from aerospace, medical and consumer electronics to defense and military. Microdisplays are widely utilized in the consumer electronics industry for the manufacturing of smartwatches and smart fitness bands, especially in countries such as Japan, South Korea and China. Besides this, due to the need to improve flexibility in defense-related operations, the adoption of electronic systems such as HMDs for effective and real-time information gathering has increased. Additionally, the introduction of the organic light-emitting diode (OLED) on silicon technology is also providing a significant impact on the market growth. This technology offers an improved image quality through high-resolution, bidirectional, and ultra-low power microdisplays. Moreover, the rising popularity of high-resolution display devices and the growing demand for advanced consumer electronics like smart glasses, viewfinders in digital cameras, smartphones, and head-mounted displays are also contributing to the market.
Key Market Segmentation:
IMARC Group provides an analysis of the key trends in each segment of the Asia Pacific microdisplay market report, along with forecasts at the regional and country levels from 2026-2034. Our report has categorized the market based on product, technology, resolution, brightness and end user.
Breakup by Product:
- Near-To-Eye (NTE) Devices
- Head-Up Display (HUD)
- Projector
- Others
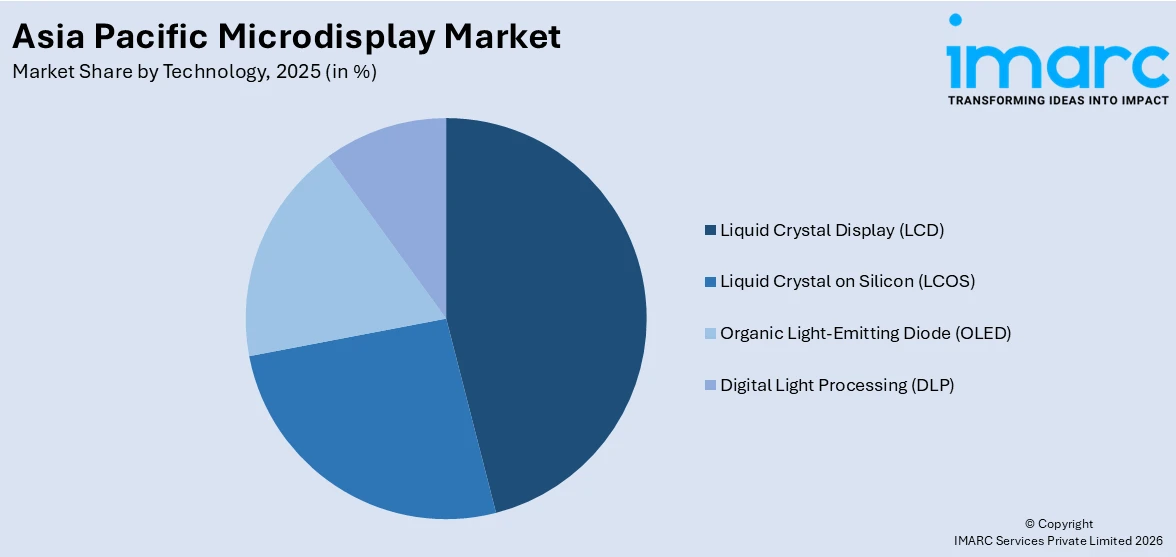
Breakup by Technology:
Access the comprehensive market breakdown Request Sample
- Liquid Crystal Display (LCD)
- Liquid Crystal on Silicon (LCOS)
- Organic Light-Emitting Diode (OLED)
- Digital Light Processing (DLP)
Breakup by Resolution:
- Lower Than HD
- HD
- FHD
- Higher Than FHD
Breakup by Brightness:
- Less Than 500 Nits
- 500–1,000 Nits
- More Than 1,000 Nits
Breakup by End User:
- Consumer
- Industrial and Enterprise
- Automotive
- Military, Defense, and Aerospace
- Sports and Entertainment
- Retail and Hospitality
- Medical
- Education
- Others
Breakup by Country:
- China
- Japan
- India
- South Korea
- Australia
- Indonesia
- Others
Competitive Landscape:
The competitive landscape of the industry has also been examined along with the profiles of the key players.
Report Coverage:
| Report Features | Details |
|---|---|
| Base Year of the Analysis | 2025 |
| Historical Period | 2020-2025 |
| Forecast Period | 2026-2034 |
| Units | Million USD |
|
Scope of the Report
|
Exploration of Historical and Forecast Trends, Industry Catalysts and Challenges, Segment-Wise Historical and Predictive Market Assessment:
|
| Products Covered | Near-To-Eye (NTE) Devices, Head-Up Display (HUD), Projector, Others |
| Technologies Covered | Liquid Crystal Display (LCD), Liquid Crystal on Silicon (LCOS), Organic Light-Emitting Diode (OLED), Digital Light Processing (DLP) |
| Resolutions Covered | Lower Than HD, HD, FHD, Higher Than FHD |
| Brightness Covered | Less Than 500 Nits, 500–1,000 Nits, More Than 1,000 Nits |
| End Users Covered | Consumer, Industrial and Enterprise, Automotive, Military, Defense, and Aerospace, Sports and Entertainment, Retail and Hospitality, Medical, Education, Others |
| Countries Covered | China, India, Japan, Australia, Indonesia, South Korea, Others |
| Customization Scope | 10% Free Customization |
| Post-Sale Analyst Support | 10-12 Weeks |
| Delivery Format | PDF and Excel through Email (We can also provide the editable version of the report in PPT/Word format on special request) |
Key Questions Answered in This Report:
- How has the Asia Pacific microdisplay market performed so far and how will it perform in the coming years?
- What has been the impact of COVID-19 on the Asia Pacific microdisplay market?
- What are the key regional markets?
- What is the breakup of the market based on the product?
- What is the breakup of the market based on the technology?
- What is the breakup of the market based on the resolution?
- What is the breakup of the market based on the brightness?
- What is the breakup of the market based on the end user?
- What are the various stages in the value chain of the industry?
- What are the key driving factors and challenges in the industry?
- What is the structure of the Asia Pacific microdisplay market and who are the key players?
- What is the degree of competition in the industry?
Need more help?
- Speak to our experienced analysts for insights on the current market scenarios.
- Include additional segments and countries to customize the report as per your requirement.
- Gain an unparalleled competitive advantage in your domain by understanding how to utilize the report and positively impacting your operations and revenue.
- For further assistance, please connect with our analysts.
 Request Customization
 Speak to an Analyst
 Request Brochure
 Inquire Before Buying
Benefits of Customization
- Personalize this research
- Triangulate with your data
- Get data as per your format and definition
- Gain a deeper dive into a specific application, geography, customer, or competitor
- Any level of personalization
Get in Touch With Us
UNITED STATES
Phone: +1-201-971-6302
INDIA
Phone: +91-120-433-0800
UNITED KINGDOM
Phone: +44-753-714-6104
Email: [email protected]
Client Testimonials


.webp)


