
Asia Pacific Silica Sand Market Size, Share, Trends and Forecast by End Use and Country, 2026-2034
Asia Pacific Silica Sand Market Size, Share, Trends & Forecast (2026-2034)
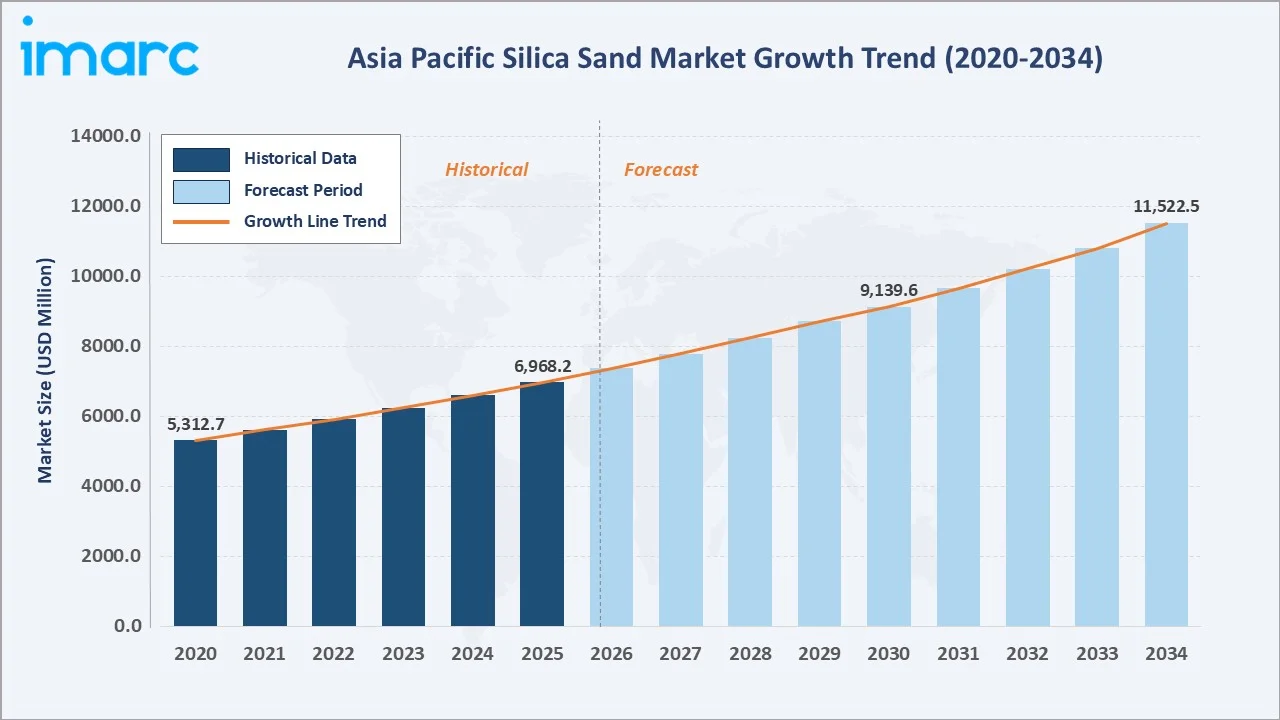
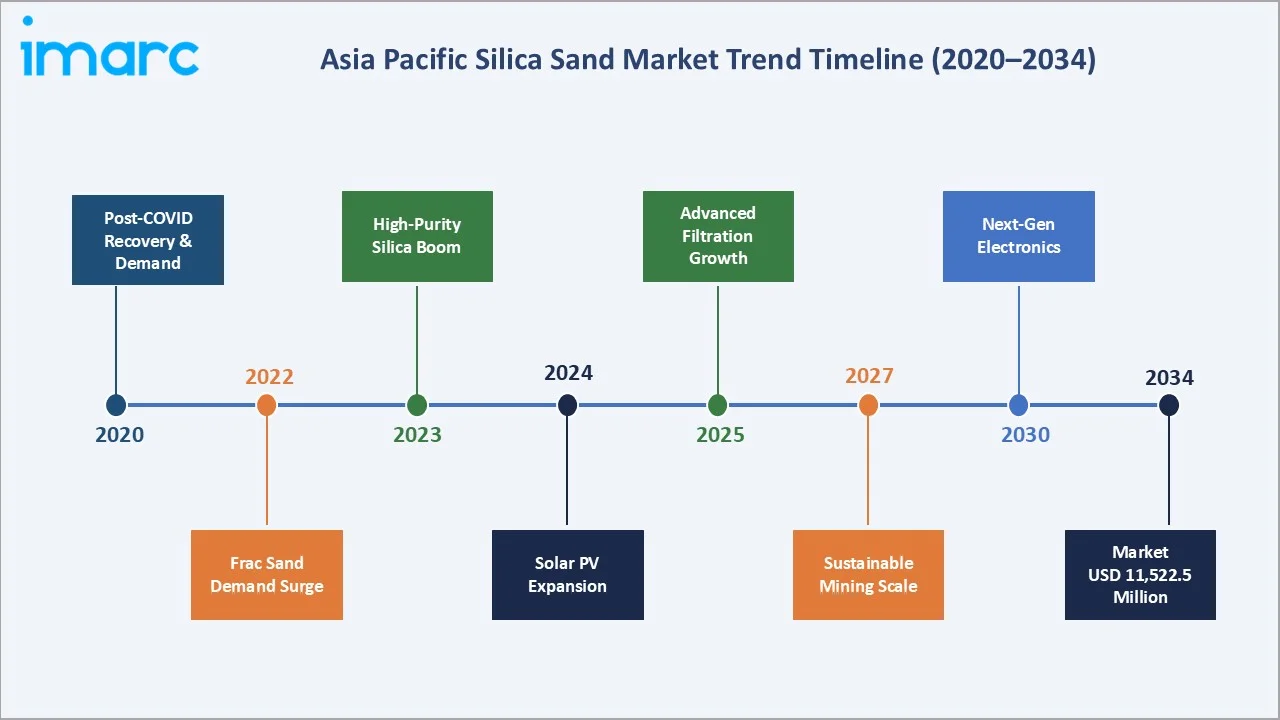
The Asia Pacific silica sand market size reached USD 6,968.2 Million in 2025 and is projected to reach USD 11,522.5 Million by 2034, exhibiting a CAGR of 5.57% during 2026-2034. Rapid urbanization, booming glass manufacturing, growing hydraulic fracturing activity, and rising demand for high-purity silica sand in electronics and solar sectors are the primary growth drivers. The Glass Industry dominates end-use at 34.2% in 2025, while China commands a 38.6% country share, reflecting its abundant reserves and large industrial base.
Market Snapshot
|
Metric |
Value |
|
Market Size (2025) |
USD 6,968.2 Million |
|
Forecast Market Size (2034) |
USD 11,522.5 Million |
|
CAGR (2026–2034) |
5.57% |
|
Base Year |
2025 |
|
Historical Period |
2020-2025 |
|
Forecast Period |
2026-2034 |
|
Largest Country |
China (38.6% share, 2025) |
|
Second Country |
India (22.4% share, 2025) |
|
Leading End Use |
Glass Industry (34.2%, 2025) |
|
Second End Use |
Foundry (21.6%, 2025) |
The Asia Pacific silica sand market growth trajectory from 2020 through 2034, with the historical expansion to USD 6,968.2 Million in 2025, reflects consistent industrial-driven demand, while the forecast to USD 11,522.5 Million captures accelerating construction investment, energy transition activity, and technology-led high-purity silica demand across the region.
To get more information on this market, Request Sample
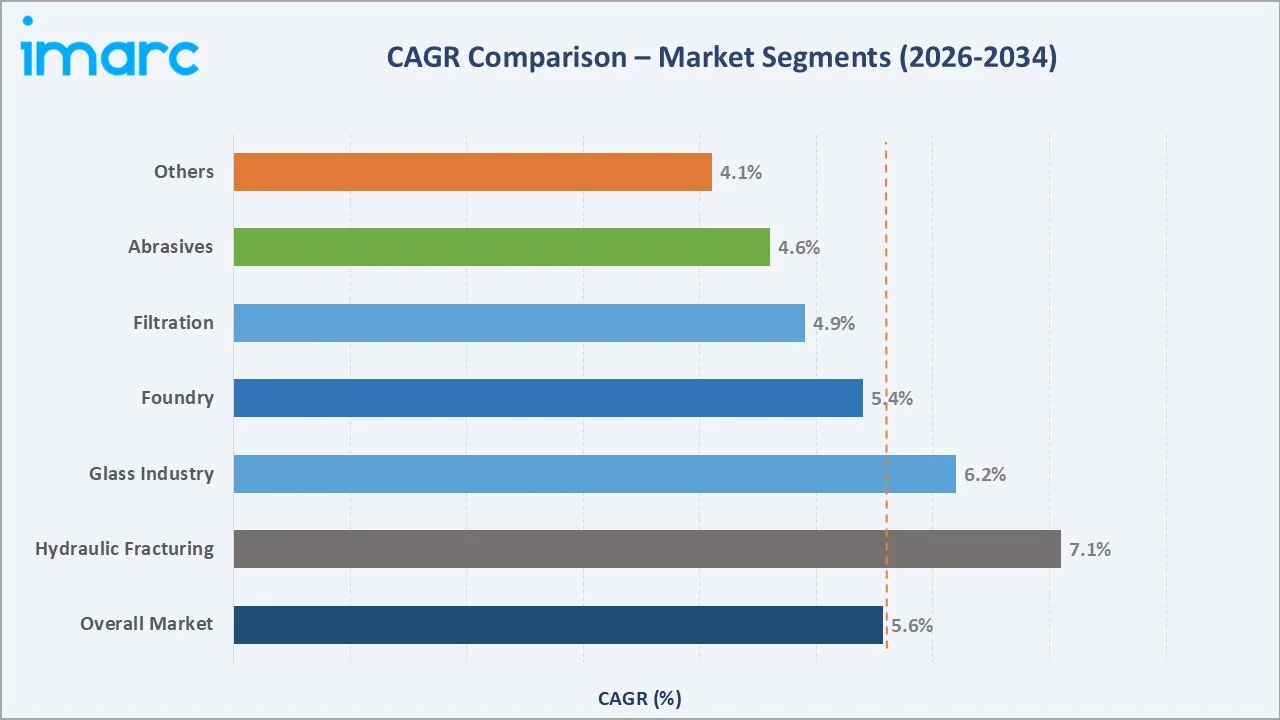
The CAGR trajectories across key end-use sub-segments, with Hydraulic Fracturing at ~7.10% CAGR and Glass Industry at ~6.20% CAGR, are the fastest-growing categories within the Asia Pacific silica sand industry analysis through 2034.
Executive Summary
The Asia Pacific silica sand market is on a sustained growth trajectory from USD 6,968.2 Million in 2025 to USD 11,522.5 Million by 2034. Silica sand, an essential industrial mineral deployed across glass production, foundry operations, hydraulic fracturing, filtration, and abrasives, benefits from the non-discretionary nature of its demand across construction, energy, and technology sectors.
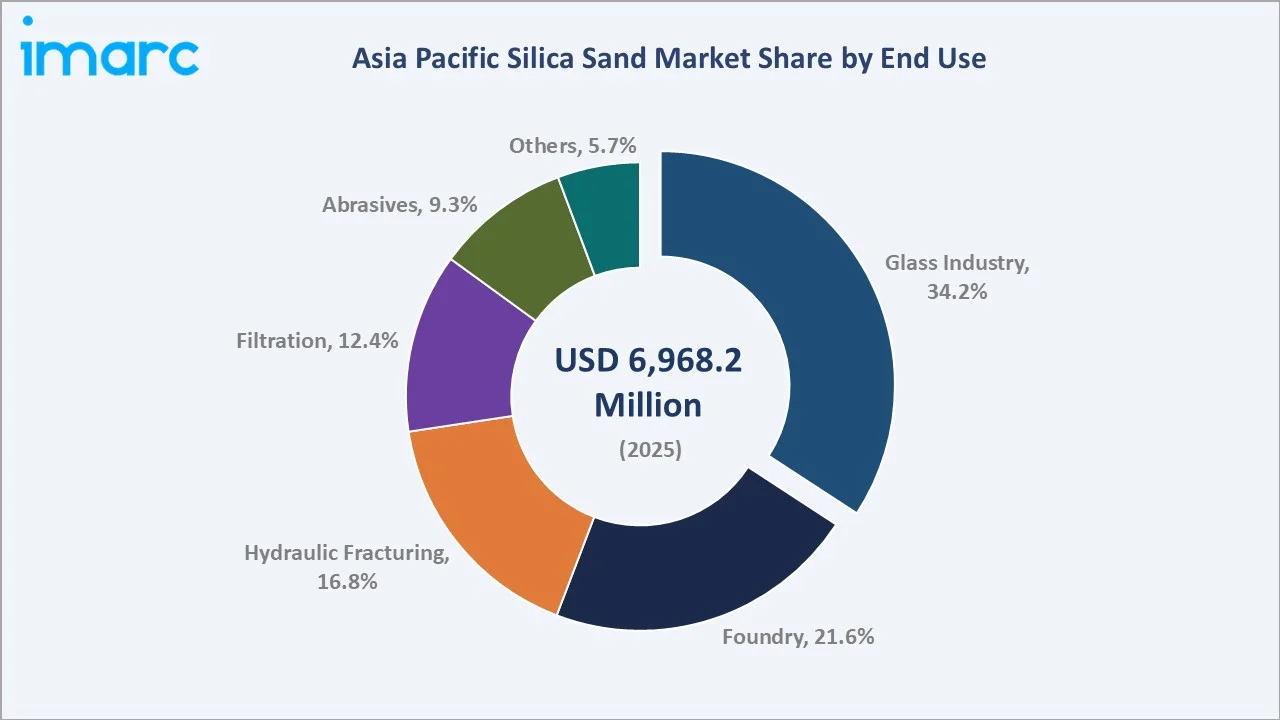
The Glass Industry dominates end-use at 34.2% in 2025, fueled by rapid urbanization, infrastructure development, and booming automotive and packaging glass demand across China, India, and Southeast Asia.
Hydraulic Fracturing (16.8%) is the fastest-growing application, driven by China's expansion into unconventional oil and gas extraction requiring specification-grade frac sand.
China commands 38.6% of the regional market in 2025, backed by abundant silica sand reserves and extensive industrial consumption. India (22.4%) and Malaysia (11.8%) follow, with Southeast Asian economies contributing meaningfully. Australia (5.6%) leads in high-purity silica sand exports supplying global electronics and solar photovoltaic supply chains.
Key Market Insights
|
Insight |
Data |
|
Largest End Use |
Glass Industry – 34.2% share (2025) |
|
Second End Use |
Foundry – 21.6% share (2025) |
|
Fastest-Growing End Use |
Hydraulic Fracturing |
|
Leading Country |
China – 38.6% revenue share (2025) |
|
Second Country |
India – 22.4% revenue share (2025) |
|
Top Companies |
Mitsubishi Chemical Group Corporation, Diatreme Resources Limited, JFE Mineral & Alloy Company, Ltd., VRX Silica Ltd, TOCHU Corporation |
Key Analytical Observations Expanding On The Above Data:
- Glass Industry, with 34.2% in 2025, dominates because it is the primary consumption segment for silica sand in Asia Pacific. China and India's rapid urbanization requires construction glass, automotive glass components, and packaging glass, making the glass sector the anchor demand driver for the regional silica sand market.
- Foundry applications, with 21.6% in 2025, reflect Asia Pacific's status as the world's largest metal casting region.
- China's 38.6% dominance in 2025 reflects multiple structural forces acting simultaneously. Ningxia Province alone holds silica sand reserves of 5 billion metric tons, providing an unparalleled domestic supply base for Chinese industrial consumers across glass, foundry, and construction segments.
- India, with 22.4% in 2025, benefits from the National Infrastructure Pipeline (NIP) targeting USD 1.4 Trillion in investments, driving silica sand demand for concrete, glass, and foundry applications across the country's rapidly expanding construction and manufacturing base.
Asia Pacific Silica Sand Market Overview
Silica sand is a high-purity quartz sand composed predominantly of silicon dioxide (SiO₂), mined and processed for use across industrial, construction, and technology sectors. Product grades are defined by SiO₂ purity, grain size distribution, clay content, and iron oxide levels, determining suitability for applications ranging from glass manufacturing to semiconductor fabrication.
The Asia Pacific ecosystem integrates silica sand mining companies, primary processors, glass manufacturers, foundry operators, oil and gas extraction firms, water treatment utilities, electronics fabricators, and solar panel producers. The supply chain links quarrying operations in China, India, Malaysia, and Australia with downstream industrial consumers across a region accounting for over 60% of global silica sand consumption.
Market Dynamics
To evaluate market opportunities, Request Sample
Market Drivers
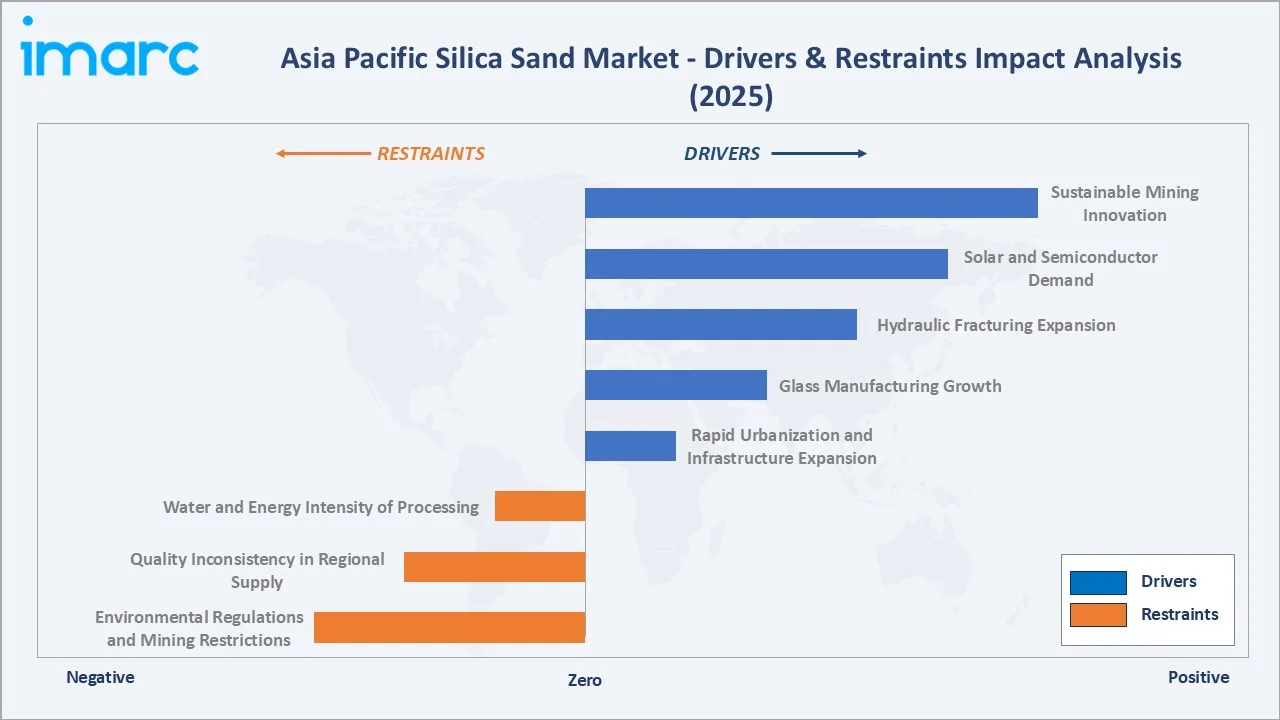
- Rapid Urbanization and Infrastructure Expansion: China's New Urbanization Plan and India's Smart Cities Mission are driving sustained demand for construction glass, concrete, and drainage materials, all requiring silica sand as a core raw material.
- Glass Manufacturing Growth: The region's automotive, construction, and packaging sectors are generating unprecedented glass production demand. In June 2024, Corning and Optiemus Infracom have started construction on India’s first facility dedicated to finishing cover glass for mobile electronics. Located in Tamil Nadu, the plant, set up under the joint venture Bharat Innovative Glass Technologies (BIG Tech), will produce high-quality finished glass components to meet rising demand from device manufacturers in India and global markets.
- Hydraulic Fracturing Expansion: China's National Energy Administration (NEA) reported oil and gas production exceeding 400 million tons of oil equivalent in January 2025. Expanding unconventional resource extraction through hydraulic fracturing requires frac sand meeting strict size consistency and crush resistance specifications.
Market Restraints
- Environmental Regulations and Mining Restrictions: Increasingly stringent environmental regulations across China, India, and Malaysia are tightening mine permitting, rehabilitation requirements, and dust emission controls, raising compliance costs and constraining new capacity development in key producing regions.
- Quality Inconsistency in Regional Supply: Not all regional silica sand deposits meet high-purity specifications required for electronics and solar applications, necessitating significant beneficiation investment and creating procurement challenges for demanding downstream technology manufacturers.
Market Opportunities
- Solar and Semiconductor Demand: The rapid growth of solar energy and semiconductor manufacturing in the Asia-Pacific region is driving increased demand for high-purity silica sand. Companies are investing in new processing facilities to support photovoltaic and electronics production, reflecting a broader shift toward higher-quality raw materials and stricter purity standards.
- Sustainable Mining Innovation: Malaysia's Sarawak Corridor of Renewable Energy (SCORE) offers 100% Pioneer Status tax exemptions of 5–10 years to promote responsible industrial growth. Sustainability certification is becoming a competitive differentiator, enabling certified silica sand producers to command premium pricing in ESG-conscious supply chains.
Market Challenges
- Water and Energy Intensity of Processing: Silica sand washing, classification, and attrition scrubbing are highly water and energy intensive. Rising resource costs and water scarcity pressures in arid mining regions are squeezing processing economics, limiting profitability for producers serving lower-margin commodity markets.
- Trade Policy Uncertainty: Export restrictions and mineral resource nationalism policies across key producing countries create supply chain uncertainty for downstream consumers dependent on cross-border silica sand trade within Asia Pacific, adding procurement risk and cost for electronics and glass manufacturers.
Emerging Market Trends
1. High-Purity Silica Sand Demand from Electronics and Solar Applications
Modern semiconductor and photovoltaic manufacturing requires silica sand with SiO₂ purity exceeding 99.9%. Asia Pacific's solar manufacturing ecosystem, led by Chinese and South Korean producers, is scaling high-purity silica consumption rapidly, transforming traditional commodity-grade markets into specification-grade specialty segments commanding significant price premiums over standard industrial grades.
2. Integration of Sustainable Mining Practices
Environmental sustainability has become a competitive dimension in Asia Pacific silica sand production. Producers are investing in water recycling systems, dust suppression technology, progressive mine rehabilitation, and biodiversity offset programs. Sustainability certification is increasingly a prerequisite for supply agreements with electronics and glass manufacturers operating under ESG procurement frameworks.
3. Growth of Hydraulic Fracturing in Unconventional Energy Production
China's expansion of unconventional oil and gas extraction from shale and tight reservoirs is generating large-scale frac sand demand. Engineering requirements for frac sand, sphericity, crush resistance, and consistent grain size distribution, are pushing producers to upgrade beneficiation capabilities to meet API-RP-19C specifications for hydraulic fracturing applications across the region.
4. Digital and AI-Driven Quality Control in Silica Sand Processing
AI-powered optical sorting, real-time particle size analysis, and automated process control are progressively improving yield and consistency in silica sand beneficiation operations. Technology-enabled quality control is reducing batch-to-batch variability that previously limited Asia Pacific silica sand producers from meeting premium electronics and solar-grade specifications consistently.
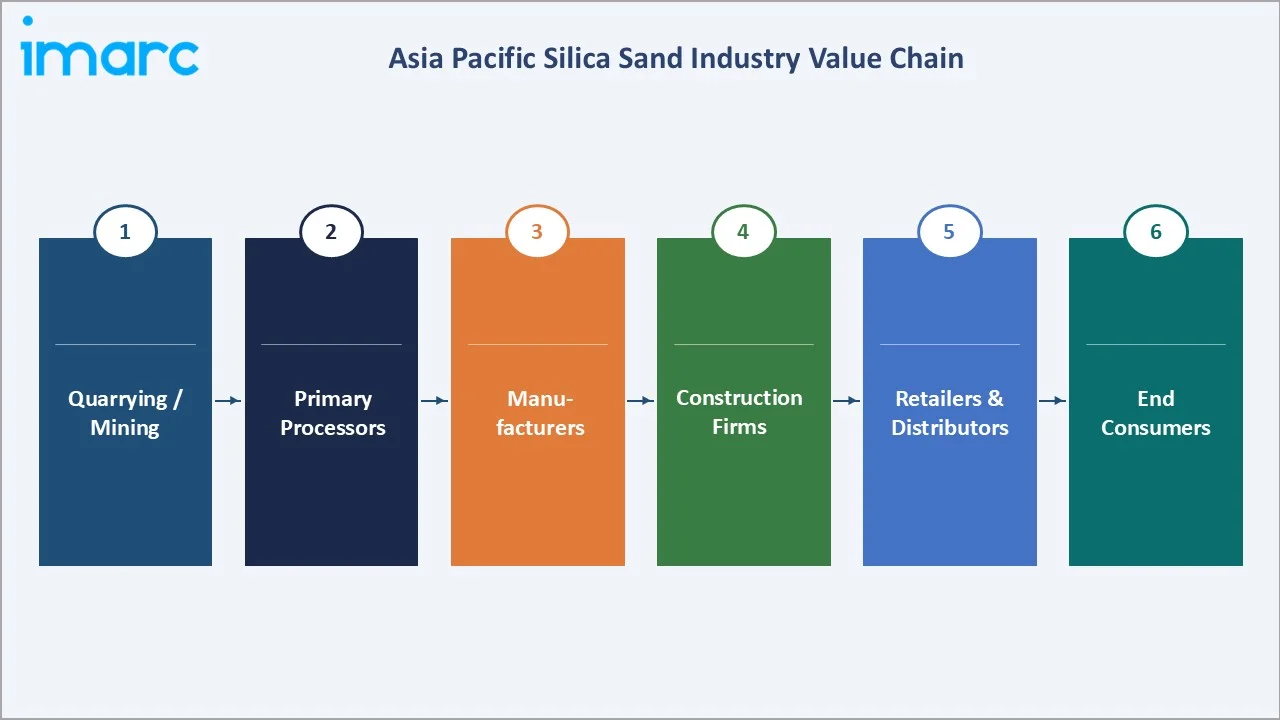
Industry Value Chain Analysis
The Asia Pacific silica sand value chain spans six stages from raw quarrying through end-use consumption. Primary processing and beneficiation capture the highest value-add margins, while quality certification and logistics infrastructure represent critical competitive advantages for producers serving high-specification end markets in electronics, solar, and specialty glass.
|
Stage |
Key Players / Examples |
|
Quarrying / Mining |
VRX Silica Ltd, Diatreme Resources Limited |
|
Primary Processors |
Xinyi Golden Ruite Quartz Materials Co., Ltd., Mangal Minerals, JFE Mineral & Alloy Company, Ltd. |
|
Manufacturers |
Regional processing and value-add manufacturers across China, Japan, and South Korea |
|
Large Construction Firms |
Regional EPC contractors, infrastructure developers, and industrial project operators across China, India, and Southeast Asia |
|
Retailers & Distributors |
TOCHU Corporation, regional commodity trading houses and industrial distributors across Asia Pacific |
|
End Consumers |
Glass manufacturers, foundry operators, oil & gas extraction firms, water treatment utilities, semiconductor and solar panel fabricators |
Integrated producers with captive processing facilities, in-house beneficiation, and logistics infrastructure achieve lower delivered cost structures than spot-market-dependent processors. Vertical integration from mining through processing is a meaningful competitive advantage, particularly for high-specification grades where quality consistency is critical to retain supply contracts with demanding technology manufacturers.
Technology Landscape in the Silica Sand Industry
Beneficiation Technology: Attrition Scrubbing and Flotation
Advanced attrition scrubbing systems remove clay coatings and iron-bearing mineral impurities from silica grains, elevating SiO₂ purity from standard 95% to high-purity 99.9%+ grades suitable for electronics applications. Froth flotation removes feldspar and mica contaminants, enabling production of specification-grade silica sand from deposits previously considered unsuitable for premium markets.
High-Purity Processing: HCl Leaching and Thermal Purification
For semiconductor and solar-grade applications requiring SiO₂ purity exceeding 99.99%, hydrochloric acid leaching and high-temperature thermal purification remove trace metal contaminants to parts-per-billion levels. These advanced processing technologies represent significant capital and operational cost premiums but command commensurately higher sale prices from electronics and photovoltaic manufacturers.
Digital Quality Control and AI-Powered Sorting
Real-time laser diffraction particle size analysis, X-ray fluorescence composition monitoring, and AI-powered optical sorting are being adopted by leading Asia Pacific silica sand processors. These digital quality systems reduce batch-to-batch variability, minimize product downtime, and generate the quality documentation increasingly required by electronics and solar supply chain auditors for certification compliance.
Market Segmentation Analysis
The report covers the following segments:
|
Segment Category |
Leading Segment |
Market Share |
Year |
|
End Use |
Glass Industry |
34.2% |
2025 |
|
Country |
China |
38.6% |
2025 |

By End Use
The Glass Industry commands a 34.2% majority share in 2025, reflecting its fundamental role as the primary consumption sector for silica sand across Asia Pacific. Construction glass, automotive glass, packaging containers, and specialty technical glass for electronics all require silica sand as the core raw material, making the glass sector the anchor demand driver for the regional market.
To access detailed market analysis, Request Sample
Foundry applications at 21.6% in 2025 reflect Asia Pacific's dominance of global metal casting. Silica sand is irreplaceable as a molding and core sand in foundry operations, providing the dimensional stability and refractoriness required for iron, steel, and aluminum casting across the region's automotive, machinery, and construction equipment manufacturing sectors.
Hydraulic Fracturing at 16.8% is the fastest-growing end-use segment, expanding as China scales unconventional oil and gas extraction. Filtration (12.4%) serves water treatment infrastructure across the region's rapidly expanding municipal and industrial water systems. Abrasives (9.3%) support metal fabrication and surface preparation industries across the region.
Regional Market Insights
|
Country |
Share (2025) |
Key Growth Drivers |
|
China |
38.6% |
Industrial scale, construction boom, electronics & solar manufacturing, hydraulic fracturing expansion |
|
India |
22.4% |
National Infrastructure Pipeline, construction activity, glass & foundry sector growth, rapid urbanization |
|
Malaysia |
11.8% |
Electronics manufacturing hub, semiconductor supply chain, construction sector demand and export activity |
|
South Korea |
9.4% |
Semiconductor and display glass production, automotive glass, advanced manufacturing and electronics |
|
Japan |
8.2% |
High-purity silica for electronics, specialty glass, automotive, and high-value industrial applications |
|
Australia |
5.6% |
High-purity silica sand exports, solar & semiconductor supply chains, construction and mining sectors |
|
Others |
4.0% |
Emerging ASEAN manufacturing, Vietnam & Indonesia construction, Philippines electronics and processing |
China's 38.6% market dominance in 2025 reflects an unrivalled combination of silica sand resource abundance and industrial consumption scale. China's construction sector, glass manufacturing industry, and electronics fabrication ecosystem collectively drive the region's highest absolute silica sand consumption volumes, cementing its position as the dominant country within the Asia Pacific market.
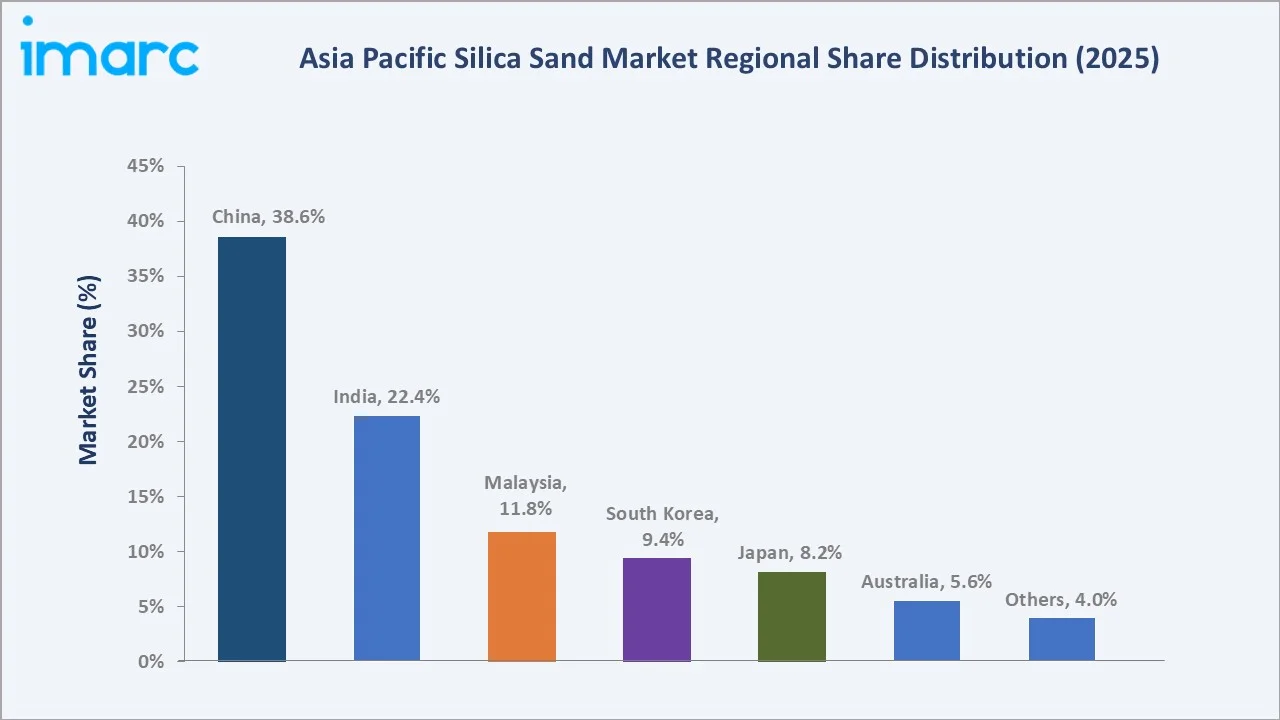
India, with 22.4% in 2025, is experiencing a construction-led demand surge supported by the National Infrastructure Pipeline targeting USD 1.4 Trillion in investments. India's foundry sector, the world's second largest by output, and its expanding glass packaging market provide additional demand anchors. Malaysia (11.8%) benefits from its established electronics manufacturing hub status and growing semiconductor-linked silica sand procurement requirements.
Competitive Landscape
The Asia Pacific silica sand market operates under intense competition, with multiple companies building manufacturing capabilities and diversifying product portfolios. The market is moderately fragmented, with regional leaders holding strong positions in their home markets while several producers compete across multiple geographies through strategic partnerships, acquisitions, and long-term supply agreements.
|
Company Name |
Key Products |
Market Position |
Strategic Focus |
|
Diatreme Resources Limited |
High-purity silica sand |
Emerging |
Australia; high-purity export market; corporate M&A growth strategy |
|
JFE Mineral & Alloy Company, Ltd. |
Nikko silica sand |
Leader |
Japan; high-specification electronics and specialty glass supply |
|
Mangal Minerals |
Silica sand, Clear Float Silica sand, Borocilicat silica sand, Ultra Clear Float Quality Silica Sand |
Challenger |
India market leadership: construction & foundry applications focus |
|
Mitsubishi Chemical Group Corporation |
Silica Sand |
Leader |
Pan-Asia trading network; strategic investment in upstream assets |
|
TOCHU Corporation |
Silica Sand |
Leader |
Pan-Asia distribution network; commodity trading and supply chain |
|
VRX Silica Ltd |
High-purity silica sand |
Challenger |
Australia; solar and semiconductor export-focused development strategy |
|
Xinyi Golden Ruite Quartz Materials Co., Ltd. |
High-purity Silica Sand |
Challenger |
China; solar and semiconductor value chain; high-purity processing |
Key players include Diatreme Resources Limited, JFE Mineral & Alloy Company, Ltd., Mangal Minerals, Mitsubishi Chemical Group Corporation, TOCHU Corporation, VRX Silica Ltd, Xinyi Golden Ruite Quartz Materials Co., Ltd., and others.
Key Company Profiles
Mitsubishi Chemical Group Corporation
Mitsubishi Chemical Group Corporation is a leading global trading and investment conglomerate headquartered in Tokyo, Japan, with extensive operations across energy, materials, chemicals, and industrial sectors. Its Materials Solution segment includes strategic silica sand and industrial minerals trading and investment positions across the Asia Pacific region.
- Product Portfolio: Silica sand
- Recent Developments: In December 2024, Mitsubishi Chemical Group expanded its production capacity of Mitsubishi Synthetic Silica, a synthetic silica powder used in the semiconductor manufacturing process, at the Kyushu-Fukuoka Plant. The Product boasts high competitiveness in this application by achieving the world's highest level of purity for sand-type silica using manufacturing technology cultivated over many years.
- Strategic Focus: Mitsubishi's silica sand strategy leverages its pan-Asian trading network and financial scale to secure long-term supply agreements, invest in upstream mining assets, and serve downstream electronics, glass, and energy sector customers across multiple Asian markets requiring reliable high-quality silica sand supply.
Diatreme Resources Limited
Diatreme Resources Limited is an Australian mineral exploration and mining company with a primary focus on silica sand and mineral sands assets. The company has been actively consolidating its position in Australia's high-purity silica sand sector through organic project development and corporate acquisitions targeting premium-specification markets.
- Product Portfolio: High-purity silica sand products
- Recent Developments: In June 2025, Diatreme Resources has upgraded the mineral resource estimate for its Si2 deposit, confirming both its large scale and high-quality silica content. The updated assessment highlights the deposit’s suitability for supplying premium-grade silica sand, particularly for high-end applications such as photovoltaic glass manufacturing.
- Strategic Focus: Diatreme's strategy focuses on developing high-purity silica sand assets in Australia for export to Asia Pacific technology manufacturers, targeting specifications required by semiconductor and solar photovoltaic supply chains where Australia's naturally high-purity deposits provide a competitive material quality advantage.
VRX Silica Ltd
VRX Silica Ltd is an Australian silica sand development company advancing high-purity silica sand projects in Western Australia for domestic and export markets. VRX is developing multiple projects targeting growing demand for specification-grade silica sand from electronics, solar, and glass manufacturers across the Asia Pacific region.
- Product Portfolio: High-purity silica sand products
- Recent Developments: In November 2024, VRX Silica received a positive endorsement from the Environmental Protection Agency (EPA), advancing toward critical project approvals that strengthen its positioning in the Asia Pacific silica sand supply chain.
- Strategic Focus: VRX Silica focuses on advancing its Western Australian silica sand projects through regulatory milestones, developing partnerships with downstream consumers, and positioning its high-purity products to serve Asia Pacific electronics, solar, and premium glass manufacturing supply chains.
Market Concentration Analysis
The Asia Pacific silica sand market is moderately fragmented at the regional level, reflecting significant country-level concentration among national producers, with no single company holding more than 10–12% of total regional market revenue. China's market is primarily served by domestic manufacturers, while Australia, India, Japan, and South Korea each have distinct competitive ecosystems with established local leaders.
Consolidation is occurring through corporate M&A—exemplified by Diatreme Resources' acquisition of Metallica Minerals in 2024—and through strategic investment by large trading houses such as Mitsubishi Chemical Group Corporation in the Materials Solution segment. Global trading houses are playing an increasing intermediary role linking upstream producers with downstream industrial consumers across borders.
Investment & Growth Opportunities
Fastest-Growing Segments
Hydraulic Fracturing at ~7.10% CAGR through 2034 is the highest-growth end-use segment, driven by China's unconventional energy expansion. High-purity silica sand for electronics and solar at an implied ~6.5% CAGR represents the most value-accretive growth opportunity, with significant price premiums versus standard industrial grades available to certified producers.
Emerging Markets
Vietnam, Indonesia, and the Philippines represent the fastest-growing demand markets within the "Others" segment (4.0% share, 2025), driven by electronics manufacturing FDI inflows, construction activity, and growing domestic glass production. These markets are expected to contribute incremental demand growth through 2034 as industrialization accelerates across Southeast Asia.
Venture & Investment Trends
Private investment in Australian high-purity silica sand development is growing, reflecting the strategic value of Australia's premium silica resources for Asia Pacific electronics and solar supply chains. The Sibelco–Ojing Technology USD 350 Million agreement in 2024 for high-purity quartz sand distribution signals significant institutional confidence in premium-grade silica sand market growth across the region.
Future Market Outlook (2026-2034)
The Asia Pacific silica sand market is forecast to expand from USD 6,968.2 Million in 2025 to USD 11,522.5 Million by 2034 at a CAGR of 5.57%, adding USD 4,554.3 Million in incremental annual market value over the forecast period. This consistent, sustained growth reflects the market's broad industrial demand fundamentals across construction, glass, energy, and advanced technology sectors.
Three structural forces will most significantly shape the Asia Pacific silica sand industry through 2034. The solar energy transition, with Asia Pacific representing over 70% of global solar panel production, will generate sustained high-purity silica sand demand. Government-supported semiconductor fab investments across Japan, South Korea, Malaysia, and India will create premium-specification requirements. Third, hydraulic fracturing scale-up in China will absorb growing frac-grade silica volumes through the full forecast period.
Research Methodology
Primary Research
Primary research encompassed structured interviews in 2024–2025 with Asia Pacific silica sand industry stakeholders, including mine operations managers, processing plant engineers, glass industry procurement specialists, foundry technical managers, and oil and gas equipment procurement executives. Primary data validated market sizing, end-use segment shares, country-level demand estimates, and technology adoption timelines across the region.
Secondary Research
Key secondary sources include China National Bureau of Statistics mining output data, Geological Survey of India mineral production statistics, Australian Critical Minerals Council publications, IEA Solar Energy Data, USGS Mineral Commodity Summaries (Silica), World Glass Council industry data, and trade publications including Industrial Minerals, Mineral Processing and Extractive Metallurgy Review, and Asian Glass magazine.
Forecasting Models
Market size estimations and growth projections were derived using a combination of top-down and bottom-up forecasting models, incorporating GDP growth rates, urbanization indices, construction investment data, industrial production indices, and historical market evolution patterns across each country. Scenario analysis (base, optimistic, and conservative cases) was performed to account for commodity price volatility and policy uncertainty.
Asia Pacific Silica Sand Market Report Scope:
| Report Features | Details |
|---|---|
| Base Year of the Analysis | 2025 |
| Historical Period | 2020-2025 |
| Forecast Period | 2026-2034 |
| Units | Million Metric Tons, Million USD |
| Scope of the Report |
Exploration of Historical and Forecast Trends, Industry Catalysts and Challenges, Segment-Wise Historical and Predictive Market Assessment:
|
| End Uses Covered | Glass Industry, Foundry, Hydraulic Fracturing, Filtration, Abrasives, Others |
| Countries Covered | China, India, Malaysia, South Korea, Japan, Australia, Others |
| Companies Covered | Diatreme Resources Limited, JFE Mineral & Alloy Company, Ltd., Mangal Minerals, Mitsubishi Chemical Group Corporation, TOCHU Corporation, VRX Silica Ltd, Xinyi Golden Ruite Quartz Materials Co., Ltd., etc. |
| Customization Scope | 10% Free Customization |
| Post-Sale Analyst Support | 10-12 Weeks |
| Delivery Format | PDF and Excel through Email (We can also provide the editable version of the report in PPT/Word format on special request) |
Key Benefits for Stakeholders:
- IMARC’s report offers a comprehensive quantitative analysis of various market segments, historical and current market trends, market forecasts, and dynamics of the Asia Pacific silica sand market from 2020-2034.
- The research study provides the latest information on the market drivers, challenges, and opportunities in the Asia Pacific silica sand market.
- Porter's five forces analysis assist stakeholders in assessing the impact of new entrants, competitive rivalry, supplier power, buyer power, and the threat of substitution. It helps stakeholders to analyze the level of competition within the Asia Pacific silica sand industry and its attractiveness.
- Competitive landscape allows stakeholders to understand their competitive environment and provides an insight into the current positions of key players in the market.
Frequently Asked Questions About the Asia Pacific Silica Sand Market Report
The Asia Pacific silica sand market reached USD 6,968.2 Million in 2025, reflecting consistent demand from construction, glass manufacturing, hydraulic fracturing, electronics, and foundry sectors across the region.
The market is projected to reach USD 11,522.5 Million by 2034, growing at a CAGR of 5.57% during 2026-2034, driven by China and India's industrial growth, high-purity silica demand from electronics and solar sectors, and hydraulic fracturing expansion.
The Glass Industry leads with a 34.2% end-use share in 2025, driven by construction glass, automotive glass, and packaging applications across China, India, and Southeast Asia, alongside rapid urbanization and infrastructure investment.
China commands a 38.6% country share in 2025, supported by abundant silica sand reserves, rapid industrialization, large construction investment, and an extensive glass manufacturing and electronics production base.
Hydraulic Fracturing is the fastest-growing end-use at ~7.10% CAGR through 2034, driven by China's expanding unconventional oil and gas extraction operations requiring frac sand meeting strict quality specifications.
Leading companies include, Diatreme Resources Limited, JFE Mineral & Alloy Company, Ltd., Mangal Minerals, Mitsubishi Chemical Group Corporation, TOCHU Corporation, VRX Silica Ltd, and Xinyi Golden Ruite Quartz Materials Co., Ltd.
Semiconductor manufacturing expansion, solar photovoltaic production, and advanced display glass for electronics are driving demand for silica sand with SiO₂ purity exceeding 99.9%, commanding significant price premiums over standard industrial grades.
Australia, with 5.6% of regional market value in 2025, is a key source of high-purity silica sand for export to Asian electronics and solar manufacturers. VRX Silica and Diatreme Resources are advancing projects to serve premium-specification demand from semiconductor and photovoltaic supply chains.
Sustainable mining practices, water recycling in processing, rehabilitation commitments, and dust emission controls are becoming competitive differentiators. Government incentive programs such as Malaysia's SCORE Pioneer Status exemptions support responsible industrial growth in the silica sand sector.
Need more help?
- Speak to our experienced analysts for insights on the current market scenarios.
- Include additional segments and countries to customize the report as per your requirement.
- Gain an unparalleled competitive advantage in your domain by understanding how to utilize the report and positively impacting your operations and revenue.
- For further assistance, please connect with our analysts.
 Request Customization
 Speak to an Analyst
 Request Brochure
 Inquire Before Buying
Benefits of Customization
- Personalize this research
- Triangulate with your data
- Get data as per your format and definition
- Gain a deeper dive into a specific application, geography, customer, or competitor
- Any level of personalization
Get in Touch With Us
UNITED STATES
Phone: +1-201-971-6302
INDIA
Phone: +91-120-433-0800
UNITED KINGDOM
Phone: +44-753-714-6104
Email: [email protected]
Client Testimonials


.webp)


