
Australia Augmented Reality Gaming Market Size, Share, Trends and Forecast by Component, Technology, Device, Game Type, and Region, 2026-2034
Australia Augmented Reality Gaming Market Overview:
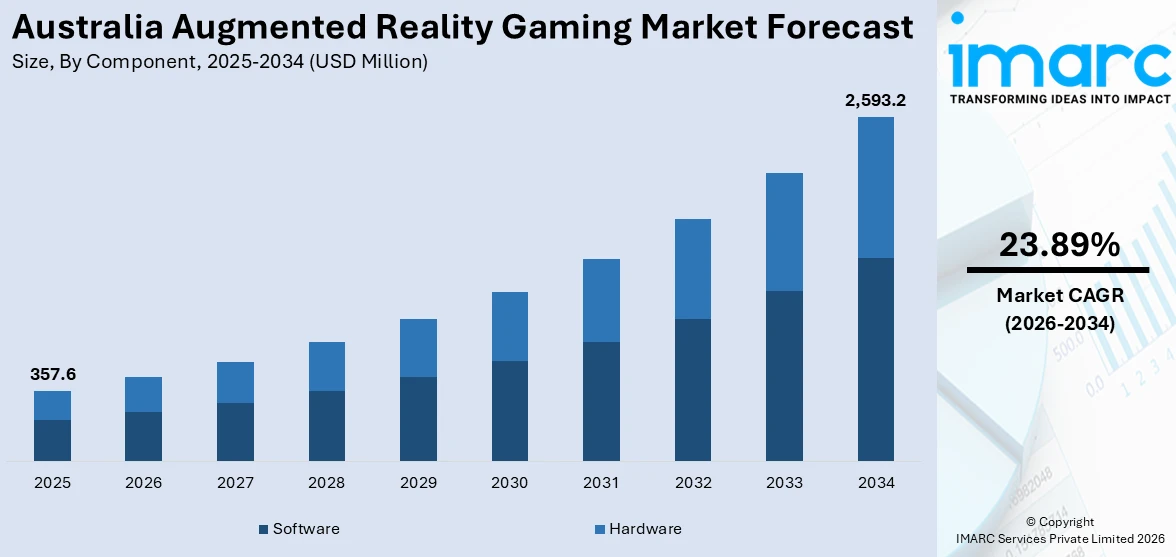
The Australia augmented reality gaming market size reached USD 357.6 Million in 2025. Looking forward, IMARC Group expects the market to reach USD 2,593.2 Million by 2034, exhibiting a growth rate (CAGR) of 23.89% during 2026-2034. The market is gaining traction due to rising mobile usage, growing interest in immersive experiences, and faster connectivity through 5G. Increased investment from game developers and expanding consumer demand for interactive content are also pushing the market forward.
|
Report Attribute
|
Key Statistics
|
|---|---|
|
Base Year
|
2025 |
|
Forecast Years
|
2026-2034
|
|
Historical Years
|
2020-2025
|
| Market Size in 2025 | USD 357.6 Million |
| Market Forecast in 2034 | USD 2,593.2 Million |
| Market Growth Rate 2026-2034 | 23.89% |
Australia Augmented Reality Gaming Market Trends:
Mobile Ecosystem Fuels AR Growth
Smartphone adoption and mobile-first attitude among Australians are further defining the AR gaming sector. High-end devices with sophisticated sensors and processing capabilities are making fertile ground for more responsive and graphically richer AR experiences. Improved displays and battery lives further enable users to spend more time engaging, which has driven developers to release mobile-optimized AR content. The popularity of cloud gaming also decreases reliance on expensive hardware, making AR games more accessible. While console-based AR is niche, the mobile platform is driving user interest and market revenue. Advances in mobile chipsets, particularly those made to support AR frameworks, are facilitating smoother performance and more elaborate visual effects. Top AR games integrate real-world mapping and object tracking, providing players with realistic interactions. This technical maturity, combined with consumer familiarity with mobile gaming apps, is resulting in higher download rates and user retention. The growing Android and iOS app ecosystems further simplify distribution, getting AR games out to a wider audience. As mobile innovation continues, pricing models and in-app monetization strategies are changing, enabling companies to maintain profitability in a competitive environment. In general, mobile technology continues to be a key enabler, making AR gaming a mass entertainment mode in Australia.
To get more information on this market Request Sample
Supportive Climate for Innovation
Australia's AR gaming industry is enhanced by a combination of public and private efforts aimed at fostering innovation. Government-supported programs that back digital creativity have spurred tech startups to look at AR as a business tool, especially in the field of gaming. Schools are also creating specialized courses on AR design and development, creating a skilled talent base that can service industry needs. Sydney and Melbourne business accelerators and tech clusters are assisting emerging studios in growing AR projects. In the meantime, greater access to development tools such as Unity and ARKit is reducing barriers to entry for small developers. Gaming expos and industry events are facilitating exposure and collaboration, compelling companies to make their AR abilities more visible. Recent innovations include collaborations between local studios and international tech majors to co-create AR-based mobile games, which tend to be region-specific. These collaborations involve knowledge transfer, co-branding, and technical support, which accelerates project timelines. Moreover, Australia's robust internet infrastructure and growing household penetration of 5G are enabling real-time multiplayer functionalities, boosting social gaming experiences. With AR applications catching up in many industries, such as retail and tourism, cross-industry spillovers also favor gaming. With encouraging policies, increasing infrastructure, and widening interest, Australia's AR gaming is on a firm growth trajectory.
Australia Augmented Reality Gaming Market Segmentation:
IMARC Group provides an analysis of the key trends in each segment of the market, along with forecasts at the country level for 2026-2034. Our report has categorized the market based on component, technology, device, and game type.
Component Insights:
- Software
- Hardware
The report has provided a detailed breakup and analysis of the market based on the component. This includes software and hardware.
Technology Insights:
Access the comprehensive market breakdown Request Sample
- RFID
- GPS
- Mobile Tracking
- Others
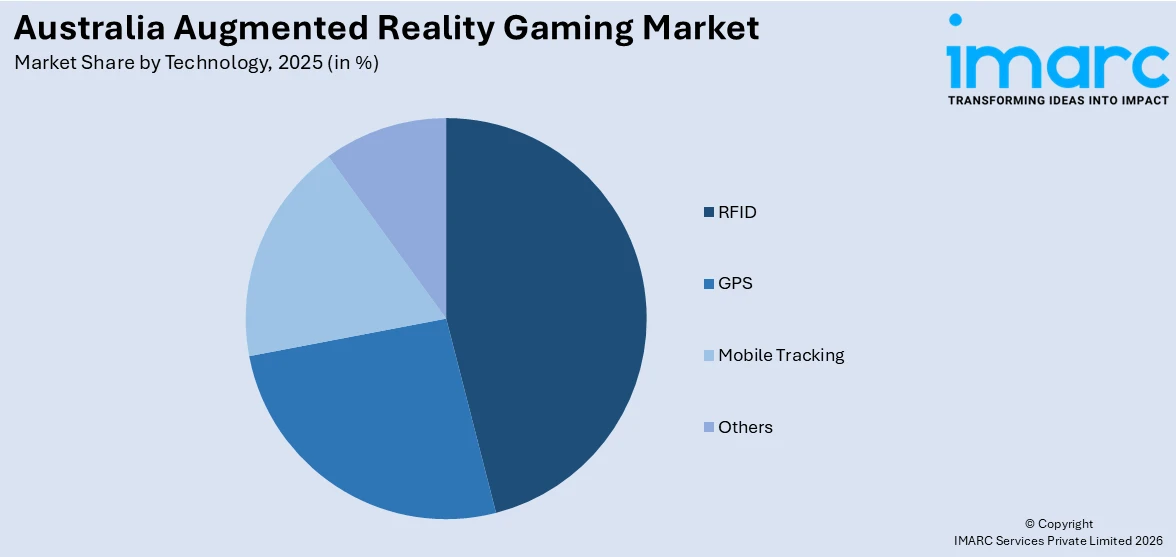
The report has provided a detailed breakup and analysis of the market based on the technology. This includes RFID, GPS, mobile tracking, and others.
Device Insights:
- Mobiles
- HMDs
- Smart Glasses
The report has provided a detailed breakup and analysis of the market based on the device. This includes mobiles, HMDs, and smart glasses.
Game Type Insights:
- Racing Games
- Adventure Games
- Fighting Games
- Shooting Games
- Mystery Thriller Games
- Puzzle Games
- Science Fiction Games
- Others
A detailed breakup and analysis of the market based on the game type have also been provided in the report. This includes racing games, adventure games, fighting games, shooting games, mystery thriller games, puzzle games, science fiction games, and others.
Regional Insights:
- Australia Capital Territory & New South Wales
- Victoria & Tasmania
- Queensland
- Northern Territory & Southern Australia
- Western Australia
The report has also provided a comprehensive analysis of all the major regional markets, which include Australia Capital Territory & New South Wales, Victoria & Tasmania, Queensland, Northern Territory & Southern Australia, and Western Australia.
Competitive Landscape:
The market research report has also provided a comprehensive analysis of the competitive landscape. Competitive analysis such as market structure, key player positioning, top winning strategies, competitive dashboard, and company evaluation quadrant has been covered in the report. Also, detailed profiles of all major companies have been provided.
Australia Augmented Reality Gaming Market News:
- September 2024: Ekruzer unveiled its controller bar concept for the world’s first gaming-compatible e-scooter, featuring an HD display and augmented reality gaming. This innovation strengthened AR gaming's outdoor integration, promoting physical engagement and expanding ARG's reach within urban micromobility and lifestyle industries.
- August 2024: HADO Australia launched its 2025 initiative, introducing advanced augmented reality gaming experiences. The launch included university programs and competitive gameplay formats, which expanded market engagement and boosted interest in AR gaming, encouraging broader adoption across educational and entertainment sectors nationwide.
Australia Augmented Reality Gaming Market Report Coverage:
| Report Features | Details |
|---|---|
| Base Year of the Analysis | 2025 |
| Historical Period | 2020-2025 |
| Forecast Period | 2026-2034 |
| Units | Million USD |
| Scope of the Report | Exploration of Historical Trends and Market Outlook, Industry Catalysts and Challenges, Segment-Wise Historical and Future Market Assessment:
|
| Components Covered | Software, Hardware |
| Technologies Covered | RFID, GPS, Mobile Tracking, Others |
| Devices Covered | Mobiles, HMDs, Smart Glasses |
| Game Types Covered | Racing Games, Adventure Games, Fighting Games, Shooting Games, Mystery Thriller Games, Puzzle Games, Science Fiction Games, Others |
| Regions Covered | Australia Capital Territory & New South Wales, Victoria & Tasmania, Queensland, Northern Territory & Southern Australia, Western Australia |
| Customization Scope | 10% Free Customization |
| Post-Sale Analyst Support | 10-12 Weeks |
| Delivery Format | PDF and Excel through Email (We can also provide the editable version of the report in PPT/Word format on special request) |
Key Questions Answered in This Report:
- How has the Australia augmented reality gaming market performed so far and how will it perform in the coming years?
- What is the breakup of the Australia augmented reality gaming market on the basis of component?
- What is the breakup of the Australia augmented reality gaming market on the basis of technology?
- What is the breakup of the Australia augmented reality gaming market on the basis of device?
- What is the breakup of the Australia augmented reality gaming market on the basis of game type?
- What are the various stages in the value chain of the Australia augmented reality gaming market?
- What are the key driving factors and challenges in the Australia augmented reality gaming market?
- What is the structure of the Australia augmented reality gaming market and who are the key players?
- What is the degree of competition in the Australia augmented reality gaming market?
Key Benefits for Stakeholders:
- IMARC’s industry report offers a comprehensive quantitative analysis of various market segments, historical and current market trends, market forecasts, and dynamics of the Australia augmented reality gaming market from 2020-2034.
- The research report provides the latest information on the market drivers, challenges, and opportunities in the Australia augmented reality gaming market.
- Porter's five forces analysis assist stakeholders in assessing the impact of new entrants, competitive rivalry, supplier power, buyer power, and the threat of substitution. It helps stakeholders to analyze the level of competition within the Australia augmented reality gaming industry and its attractiveness.
- Competitive landscape allows stakeholders to understand their competitive environment and provides an insight into the current positions of key players in the market.
Need more help?
- Speak to our experienced analysts for insights on the current market scenarios.
- Include additional segments and countries to customize the report as per your requirement.
- Gain an unparalleled competitive advantage in your domain by understanding how to utilize the report and positively impacting your operations and revenue.
- For further assistance, please connect with our analysts.
 Request Customization
 Speak to an Analyst
 Request Brochure
 Inquire Before Buying
Benefits of Customization
- Personalize this research
- Triangulate with your data
- Get data as per your format and definition
- Gain a deeper dive into a specific application, geography, customer, or competitor
- Any level of personalization
Get in Touch With Us
UNITED STATES
Phone: +1-201-971-6302
INDIA
Phone: +91-120-433-0800
UNITED KINGDOM
Phone: +44-753-714-6104
Email: [email protected]
Client Testimonials


.webp)


