
Australia Commercial Vehicle Market Size, Share, Trends and Forecast by Vehicle Body Type, Propulsion Type, and Region, 2026-2034
Australia Commercial Vehicle Market Summary:
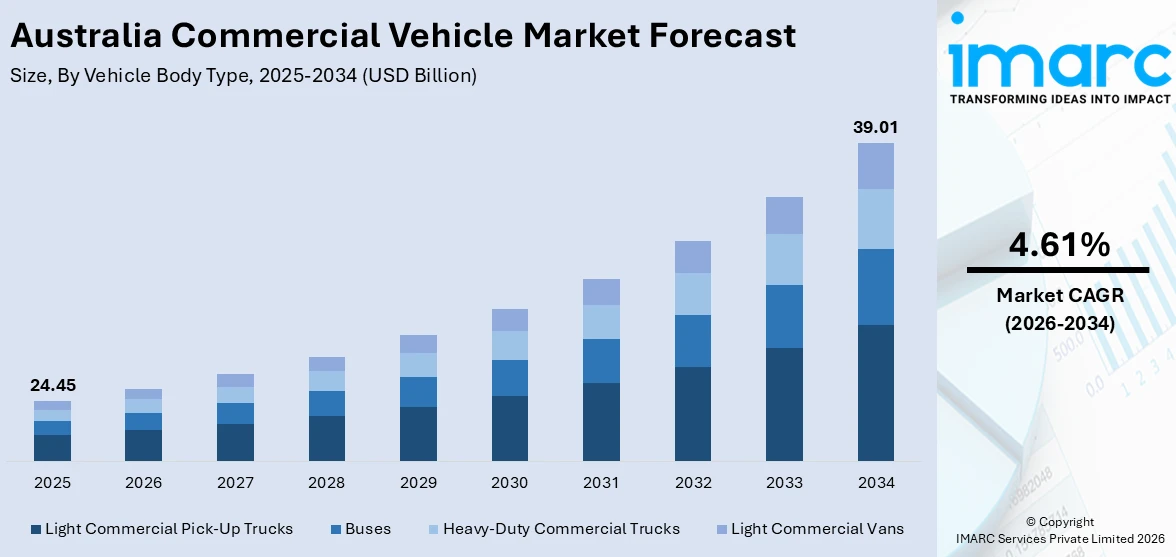
The Australia commercial vehicle market size was valued at USD 24.45 Billion in 2025 and is projected to reach USD 39.01 Billion by 2034, growing at a compound annual growth rate of 4.61% from 2026-2034.
The Australia commercial vehicle market is experiencing robust momentum driven by expanding infrastructure development, rising freight and logistics demand, and the growing adoption of cleaner propulsion technologies. Rapid e-commerce growth is intensifying demand for last-mile delivery vehicles, while mining and construction activities sustain heavy-duty truck requirements. Supportive government policies, fleet modernization initiatives, and increasing investments in electric and hybrid commercial vehicles are reshaping the competitive landscape and strengthening Australia commercial vehicle market share.
Key Takeaways and Insights:
- By Vehicle Body Type: Light commercial pick-up trucks dominate the market with a share of 42.5% in 2025, driven by strong demand from construction, agriculture, and trade sectors, alongside rising consumer preference for versatile utility vehicles that serve both commercial and personal transportation needs across urban and regional areas.
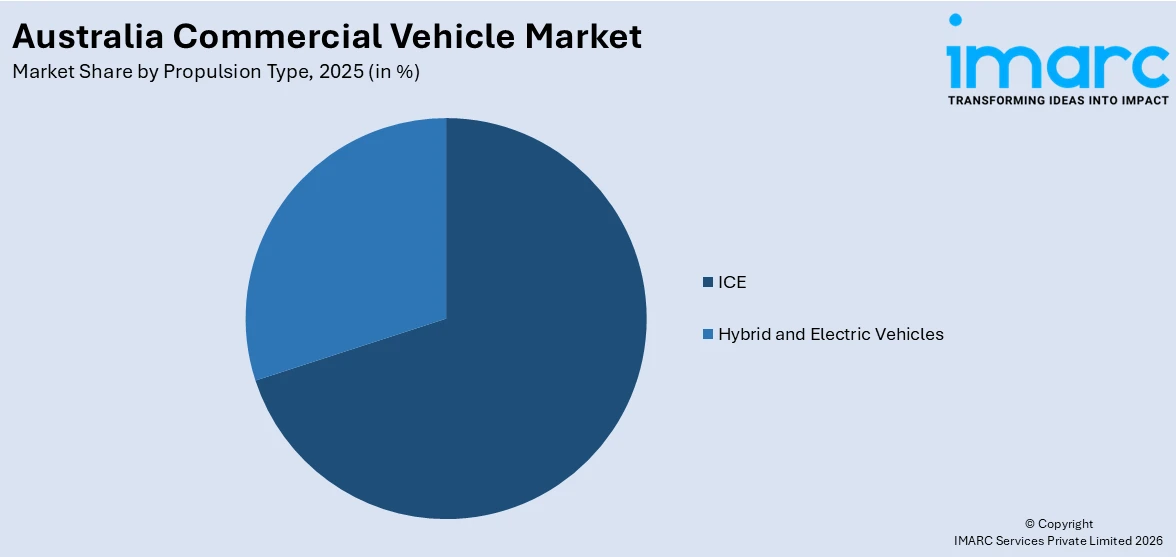
- By Propulsion Type: ICE leads the market with a share of 69.0% in 2025, reflecting the continued reliance on conventional combustion engines across freight, mining, and long-haul transport applications where refuelling infrastructure and range requirements favour established diesel and petrol powertrains.
- By Region: Australia Capital Territory & New South Wales is the largest region with 32.5% share in 2025, driven by the concentration of logistics hubs, major port operations, large-scale infrastructure projects, and densely populated urban centres that generate sustained demand for commercial vehicles.
- Key Players: Leading manufacturers drive the Australia commercial vehicle market by expanding model portfolios, improving fuel efficiency and safety technologies, and strengthening nationwide distribution networks. Their investments in electric mobility, fleet management solutions, and strategic partnerships accelerate adoption and ensure consistent product availability.
To get more information on this market Request Sample
The Australia commercial vehicle market is advancing steadily as the nation invests in infrastructure modernization, resource extraction, and sustainable transportation ecosystems. Light commercial pick-up trucks and vans remain integral to daily operations across construction, mining, agriculture, and last-mile delivery, while heavy-duty trucks support long-haul freight and resource logistics. The shift toward electrified powertrains is gaining momentum, with hybrid vehicles emerging as a preferred transitional technology among fleet operators seeking to balance emission reduction with operational practicality. For instance, according to the Federal Chamber of Automotive Industries, plug-in hybrid vehicle sales in Australia surged by 130.9% year-on-year in 2025, reaching 53,484 units, while hybrid vehicles accounted for 199,133 units sold, highlighting the growing consumer and fleet appetite for lower-emission alternatives. E-commerce expansion, government fleet electrification programs, and regulatory frameworks such as the New Vehicle Efficiency Standard are collectively shaping a more competitive and technology-driven market environment. Advanced telematics, AI-powered fleet management, and connected vehicle technologies are further enhancing operational efficiency and safety standards across the sector.
Australia Commercial Vehicle Market Trends:
Accelerating Adoption of Electric and Hybrid Commercial Vehicles
Australia is witnessing a growing transition toward electrified commercial transport as fleet operators seek to reduce carbon footprints and comply with tightening emission regulations. For instance, in May 2025, logistics company Linfox received an order for 30 heavy-duty electric trucks from Volvo, marking the largest battery-electric truck order in Australia to date. Government incentives, corporate sustainability commitments, and expanding charging infrastructure are fostering broader acceptance of electric and hybrid commercial vehicles across metropolitan and regional corridors.
E-Commerce Driven Last-Mile Delivery Expansion
The rapid growth of online retail is fundamentally reshaping logistics and driving demand for light commercial vans and delivery vehicles across urban centres. Rising parcel volumes, same-day delivery expectations, and the proliferation of micro-fulfilment centres are intensifying fleet expansion requirements among courier services and third-party logistics providers. Retailers are increasingly investing in dedicated delivery fleets to meet evolving consumer preferences for faster and more flexible fulfilment options. The shift toward decentralized warehousing and urban distribution hubs is further strengthening demand for manoeuvrable, fuel-efficient commercial vehicles, supporting Australia commercial vehicle market growth.
Integration of Advanced Telematics and Fleet Management Technologies
Commercial fleet operators in Australia are increasingly adopting AI-powered telematics systems to optimize route planning, monitor driver behaviour, and improve fuel efficiency. Digital fleet tracking, predictive maintenance, and connected vehicle platforms are enabling operators to enhance productivity while reducing operational costs. Manufacturers are embedding advanced driver-assistance systems, collision avoidance technologies, and sophisticated electronic architectures into new commercial vehicle models across all weight segments. The growing emphasis on real-time data analytics, remote diagnostics, and automated compliance reporting is accelerating the digital transformation of fleet operations throughout the country.
Market Outlook 2026-2034:
The Australia commercial vehicle market is positioned for sustained growth, supported by continued infrastructure investment, expanding freight and logistics networks, and the accelerating transition toward cleaner propulsion technologies. The market generated a revenue of USD 24.45 Billion in 2025 and is projected to reach a revenue of USD 39.01 Billion by 2034, growing at a compound annual growth rate of 4.61% from 2026-2034. Large-scale construction projects, including the Inland Rail corridor and Western Sydney Airport infrastructure, are expected to sustain demand for heavy-duty and specialized commercial vehicles. The electrification of fleet operations will gain further momentum as Volvo begins local production of electric trucks at its Brisbane facility, establishing Australia as a regional hub for electric commercial vehicle manufacturing. Rising e-commerce activity, fleet modernization requirements, and stricter emission standards under the New Vehicle Efficiency Standard are anticipated to drive higher adoption of fuel-efficient and alternative-powered vehicles, creating a more competitive and sustainable commercial vehicle landscape.
Australia Commercial Vehicle Market Report Segmentation:
| Segment Category | Leading Segment | Market Share |
|---|---|---|
|
Vehicle Body Type |
Light Commercial Pick-Up Trucks |
42.5% |
|
Propulsion Type |
ICE |
69.0% |
|
Region |
Australia Capital Territory & New South Wales |
32.5% |
Vehicle Body Type Insights:
- Buses
- Heavy-Duty Commercial Trucks
- Light Commercial Pick-Up Trucks
- Light Commercial Vans
Light commercial pick-up trucks dominate with a market share of 42.5% of the total Australia commercial vehicle market in 2025.
Light commercial pick-up trucks have established themselves as the cornerstone of Australia's commercial vehicle landscape, serving diverse applications across construction, agriculture, mining services, and urban trade operations. Their versatility in accommodating both payload demands and passenger comfort has driven widespread adoption among small businesses, tradespeople, and fleet operators. The segment benefits from a deeply entrenched cultural preference for utility vehicles in Australia, where utes function as essential work tools and family transport. Dual-purpose functionality, rugged durability, and extensive aftermarket customization options continue to reinforce their dominant position across metropolitan and regional markets.
The continued strength of pick-up truck demand is further supported by expanding construction activity, growing infrastructure investment, and rising adoption among regional and rural operators who require robust vehicles for challenging terrain. Manufacturers are responding with increasingly sophisticated offerings, incorporating advanced safety features, improved fuel efficiency, and enhanced towing capabilities to meet evolving customer expectations. Additionally, the introduction of hybrid and electric pick-up truck variants is beginning to reshape the segment, as fleet operators and mining companies explore lower-emission alternatives that maintain the operational performance required for demanding commercial applications.
Propulsion Type Insights:
Access the comprehensive market breakdown Request Sample
- Hybrid and Electric Vehicles
- BEV
- FCEV
- HEV
- PHEV
- ICE
- CNG
- Diesel
- Gasoline
- LPG
ICE leads the market with a share of 69.0% of the total Australia commercial vehicle market in 2025.
Internal combustion engine vehicles continue to account for the overwhelming majority of commercial vehicle sales in Australia, driven by established refuelling infrastructure, superior range capabilities for long-haul transport, and lower upfront acquisition costs compared to electrified alternatives. Diesel-powered trucks and vans remain indispensable for mining, freight, and construction operations that require high torque output and extended operating distances across Australia's vast geography. The mature supply chain for ICE components and widespread availability of maintenance services reinforce operator confidence. According to industry data, Australia's heavy commercial vehicle market recorded 51,277 new truck and van registrations in 2024, predominantly ICE-powered.
Despite the growing momentum toward electrification, ICE vehicles are expected to retain market dominance during the forecast period owing to their proven reliability across demanding Australian conditions including remote mining regions, agricultural corridors, and long-haul interstate routes. Manufacturers are investing in cleaner-burning engines that comply with updated emission standards, enhancing the environmental profile of conventional powertrains. The introduction of improved fuel quality regulations and paraffinic diesel standards is further supporting the viability of modern diesel commercial vehicles, ensuring their continued relevance in the broader transition toward lower-emission transport solutions.
Regional Insights:
- Australia Capital Territory & New South Wales
- Victoria & Tasmania
- Queensland
- Northern Territory & Southern Australia
- Western Australia
Australia Capital Territory & New South Wales comprises the largest region with a 32.5% share of the total Australia commercial vehicle market in 2025.
Driven by Sydney's status as a major logistics and distribution hub, extensive port operations, and significant infrastructure development throughout the greater metropolitan area, Australia Capital Territory and New South Wales comprise the nation's most diverse and developed commercial vehicle market. From light commercial vans for last-mile delivery to heavy-duty trucks for construction and port haulage, the concentration of freight corridors, warehousing facilities, and e-commerce fulfillment centers creates consistent demand across all vehicle types. The region leads the country in commercial vehicle registrations, which is further supported by its dense population and strong economy.
Major infrastructure projects including metro rail extensions, airport expansions, and continuous urban development projects that need a lot of support from commercial vehicles further solidify the region's leadership position. In order to expedite fleet electrification, state transport agencies in New South Wales have been aggressively collaborating with domestic manufacturers, making the state a leader in the acquisition of electric buses. Cleaner commercial vehicles are being adopted throughout the region as a result of government sustainability mandates, strict emission laws, and business decarbonization commitments. The long-term need for a variety of commercial vehicle fleets is being reinforced by the expansion of intermodal logistics networks and the rise in cross-border freight activities.
Market Dynamics:
Growth Drivers:
Why is the Australia Commercial Vehicle Market Growing?
Expanding Infrastructure Development and Construction Activity
Australia's sustained commitment to large-scale infrastructure development is generating substantial demand for commercial vehicles across construction, logistics, and material transport applications. Federal and state governments continue to invest heavily in road networks, rail corridors, public transport systems, airports, and urban development projects that require extensive fleets of heavy-duty trucks, specialized utility vehicles, and light commercial vehicles for daily operations. The construction sector's strong growth trajectory creates a multiplier effect on commercial vehicle demand, as contractors, subcontractors, and material suppliers all depend on reliable transport solutions to maintain project timelines and deliver essential resources to dispersed work sites. Major projects spanning interstate rail corridors, airport infrastructure, and state-level transport investment programs are anchoring long-term procurement of heavy-duty trucks for earthmoving and material haulage, light commercial vehicles for site logistics, and specialized equipment transport vehicles. The construction boom is further supported by residential housing demand, renewable energy project development, and defence-related infrastructure, collectively sustaining a broad-based requirement for commercial fleets across all weight categories.
Growth in Mining and Resource Sector Operations
Australia's mining sector remains one of the world's largest and most productive, creating sustained demand for heavy-duty commercial trucks, specialized haulage vehicles, and light commercial utility vehicles that support extraction, processing, and logistics operations across remote and regional areas. The sector's continued expansion, driven by global demand for iron ore, lithium, copper, and rare earth minerals, requires extensive transport infrastructure connecting mine sites to processing facilities and export ports. Commercial vehicles are essential for transporting workers, equipment, maintenance supplies, and raw materials across vast distances in challenging environmental conditions. Mining operations in Western Australia, Queensland, and Northern Territory are particularly dependent on robust commercial vehicle fleets capable of withstanding extreme heat, dust, and rough terrain. Resource sector investment in fleet modernization, safety upgrades, and emission reduction technologies is driving procurement of next-generation commercial vehicles with improved payload capacity, fuel efficiency, and advanced telematics capabilities.
Rapid E-Commerce Expansion and Last-Mile Delivery Demand
Australia's rapidly expanding online retail sector is radically changing logistics networks and creating previously unheard-of demand for delivery vans, small commercial vehicles, and urban freight solutions. Growing customer demands for same-day shipment, quicker delivery, and flexible fulfillment models are pushing third-party logistics companies, courier services, and retailers to update and grow their fleets of vehicles. There is a constant need for effective, maneuverable commercial vehicles that are appropriate for metropolitan delivery operations due to the growth of micro-fulfillment centers in urban areas and the rising parcel volumes from major e-commerce platforms. Long-term demand for commercial delivery vehicles has been generated by the structural shift toward online purchasing, and this demand goes far beyond brief disruption-related surges. To cut emissions and meet more stringent environmental regulations, major retailers and logistics companies are investigating the use of electric trucks for urban delivery routes. The business case for fleet expansion across the light commercial vehicle market is being strengthened by the convergence of increasing parcel quantities, urbanization, and corporate environmental goals.
Market Restraints:
What Challenges the Australia Commercial Vehicle Market is Facing?
High Vehicle Acquisition and Operational Costs
For small and medium-sized fleet operators in Australia, the high initial cost of commercial vehicles, especially heavy-duty trucks and electric alternatives, remains a major obstacle. Operational cost challenges are further exacerbated by rising insurance rates, increased maintenance costs, and volatile fuel prices. Vehicle prices have increased recently due to supply chain disruptions and component shortages, making fleet expansion and renewal financially difficult for companies with narrow profit margins in the cutthroat transportation and logistics industries.
Limited Electric Vehicle Charging Infrastructure
Despite the increased interest in electric commercial vehicles, adoption is hindered by the lack of high-capacity charging infrastructure, particularly along regional and interstate routes. Range anxiety is a big concern for fleet owners considering long-distance use of battery-electric trucks and vans. The lack of standardized megawatt-level charging networks makes heavy-duty EVs impractical outside of metropolitan delivery routes, and grid capacity limitations in rural mining and agricultural areas further hinder the transition to electrified commercial fleets.
Ageing Fleet and Workforce Shortages
The fleet of commercial vehicles in Australia is still much older than those in Europe and North America, and many operators are deferring replacement because of supply and pricing restrictions. Operational effectiveness, environmental performance, and safety compliance are all threatened by an aging fleet. At the same time, fleet utilization is being restricted and labor costs are rising due to a chronic lack of trained commercial vehicle drivers and skilled maintenance specialists. These labor shortages and growing regulatory demands result in operational bottlenecks that limit the possibility for market expansion.
Competitive Landscape:
Established international manufacturers and up-and-coming electric vehicle experts are fighting for market dominance in a variety of vehicle sectors in Australia's fiercely competitive commercial vehicle market. To meet demand from the freight, construction, mining, and urban delivery sectors, companies are concentrating on diversifying their product lines, improving vehicle safety and emission performance, and fortifying dealer and service networks. Market leaders are setting themselves apart with strategic investments in linked fleet management technologies, advanced driver-assistance systems, and electric and hybrid commercial vehicles. The competitive landscape is also being shaped by local manufacturing projects, government procurement programs, and alliances with fleet operators. Industry-wide model updates are being prompted by the implementation of new Australian Design Rules for safety and emissions, which is escalating competitiveness and spurring innovation.
Australia Commercial Vehicle Market Report Coverage:
| Report Features | Details |
|---|---|
| Base Year of the Analysis | 2025 |
| Historical Period | 2020-2025 |
| Forecast Period | 2026-2034 |
| Units | Billion USD |
| Scope of the Report |
Exploration of Historical Trends and Market Outlook, Industry Catalysts and Challenges, Segment-Wise Historical and Future Market Assessment:
|
| Vehicle Body Types Covered | Buses, Heavy-Duty Commercial Trucks, Light Commercial Pick-Up Trucks, Light Commercial Vans |
| Propulsion Types Covered |
|
| Regions Covered | Australia Capital Territory & New South Wales, Victoria & Tasmania, Queensland, Northern Territory & Southern Australia, Western Australia |
| Customization Scope | 10% Free Customization |
| Post-Sale Analyst Support | 10-12 Weeks |
| Delivery Format | PDF and Excel through Email (We can also provide the editable version of the report in PPT/Word format on special request) |
Frequently Asked Questions About the Australia Commercial Vehicle Market Report
The Australia commercial vehicle market size was valued at USD 24.45 Billion in 2025.
The Australia commercial vehicle market is expected to grow at a compound annual growth rate of 4.61% from 2026-2034 to reach USD 39.01 Billion by 2034.
Light commercial pick-up trucks dominated the market with a share of 42.5%, driven by strong demand from construction, agriculture, and trade sectors, alongside rising consumer preference for versatile utility vehicles across urban and regional areas.
Key factors driving the Australia commercial vehicle market include expanding infrastructure development, growing mining and construction activity, rapid e-commerce growth, fleet modernization requirements, supportive government policies, and increasing adoption of electric and hybrid commercial vehicles.
Major challenges include high vehicle acquisition and operational costs, limited electric vehicle charging infrastructure in regional areas, an ageing commercial vehicle fleet, persistent driver and workforce shortages, supply chain constraints, and slow adoption of zero-emission technologies beyond metropolitan corridors.
Need more help?
- Speak to our experienced analysts for insights on the current market scenarios.
- Include additional segments and countries to customize the report as per your requirement.
- Gain an unparalleled competitive advantage in your domain by understanding how to utilize the report and positively impacting your operations and revenue.
- For further assistance, please connect with our analysts.
 Request Customization
 Speak to an Analyst
 Request Brochure
 Inquire Before Buying
Benefits of Customization
- Personalize this research
- Triangulate with your data
- Get data as per your format and definition
- Gain a deeper dive into a specific application, geography, customer, or competitor
- Any level of personalization
Get in Touch With Us
UNITED STATES
Phone: +1-201-971-6302
INDIA
Phone: +91-120-433-0800
UNITED KINGDOM
Phone: +44-753-714-6104
Email: [email protected]
Client Testimonials


.webp)


