
Australia Desktop Virtualization Market Size, Share, Trends and Forecast by Type, Component, Organization Size, Vertical, and Region, 2026-2034
Australia Desktop Virtualization Market Overview:
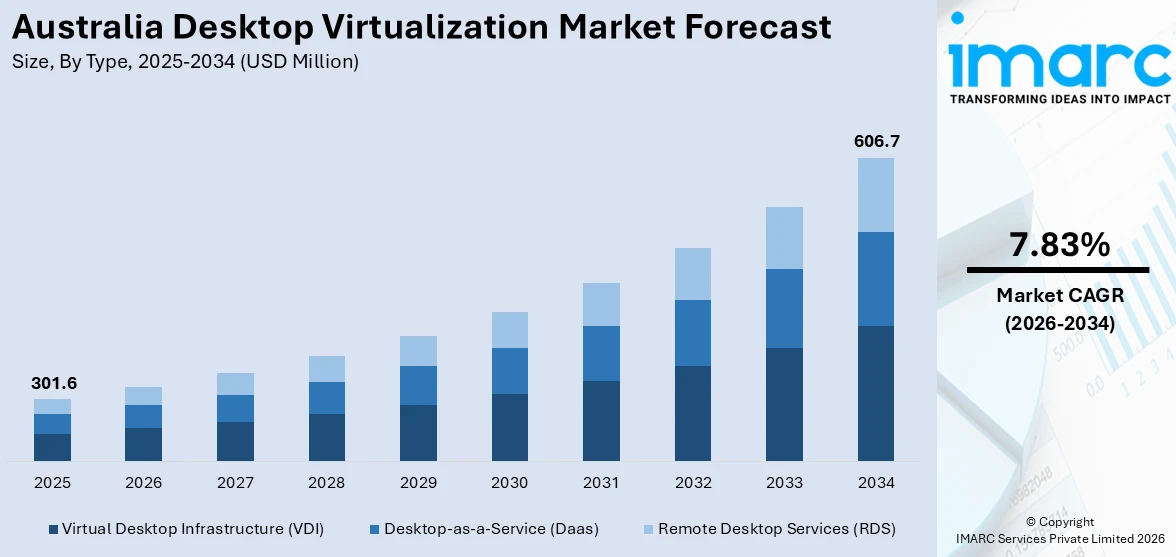
The Australia desktop virtualization market size reached USD 301.6 Million in 2025. Looking forward, IMARC Group expects the market to reach USD 606.7 Million by 2034, exhibiting a growth rate (CAGR) of 7.83% during 2026-2034. The widespread remote/hybrid work adoption, the surging public cloud spending, robust government IT investments, and the escalating cybersecurity and compliance demands prompting secure virtual desktop infrastructure (VDI) deployments are the key factors propelling the market growth.
|
Report Attribute
|
Key Statistics
|
|---|---|
|
Base Year
|
2025
|
|
Forecast Years
|
2026-2034
|
|
Historical Years
|
2020-2025
|
| Market Size in 2025 | USD 301.6 Million |
| Market Forecast in 2034 | USD 606.7 Million |
| Market Growth Rate 2026-2034 | 7.83% |
Australia Desktop Virtualization Market Trends:
Proliferation of Remote/Hybrid Work & Cloud-Delivered VDI
Australia’s transition to hybrid work has fundamentally reshaped enterprise ICT strategies, placing virtual desktop infrastructure (VDI) and cloud-based Desktop-as-a-Service (DaaS) at the core of business continuity and productivity. As of early 2024, 53% of Australian employees worked remotely at least part-time, while 14% operated fully from home, driving heightened demand for secure, flexible desktop access across locations. In response, 70% of businesses plan to adopt cloud platforms to fast-track IT modernization, with DaaS solutions gaining traction for eliminating on-premise hardware burdens and simplifying user onboarding. Industry leaders report that centralized VDI architectures help IT teams uniformly enforce security protocols, streamline patching processes, and significantly reduce support tickets. This not only enhances operational efficiency but also frees internal resources to focus on strategic digital transformation efforts. As hybrid work cements its place in the Australian employment landscape, scalable, cloud-enabled virtual desktops are becoming essential to ensure consistent user experiences and secure, agile IT operations.
To get more information on this market Request Sample
Escalating Cyberthreats & Zero-Trust-Driven Virtualization
Amid a sharp rise in cyber threats, Australian enterprises are boosting the adoption of secure, centralized desktop environments within zero-trust architectures to reduce exposure and enhance control. In 2023, the Australian Signals Directorate (ASD) recorded nearly 94,000 cybercrime incidents, a 23% year-on-year increase, while the Office of the Australian Information Commissioner reported 527 notifiable data breaches in the first half of 2024 alone, marking the highest semi-annual figure since 2020. Ransomware attacks surged 40% in 2023, revealing critical gaps in legacy VPN-based access and prompting widespread migration to Zero Trust Network Access (ZTNA) integrated with Virtual Desktop Infrastructure (VDI). Notably, over 11% of ASD-handled incidents in FY 2023–24 targeted critical infrastructure, intensifying regulatory pressure for auditable, compliant IT environments. In response, organizations are embedding multifactor authentication, continuous trust verification, and endpoint compliance within VDI systems, leading to fewer malware incidents compared to physical desktops. The 2023 DP World cyberattack, which paralyzed 40% of Australia’s container flow, further underscored the urgency for centralized control and remote-wipe capabilities offered by desktop virtualization.
Australia Desktop Virtualization Market Segmentation:
IMARC Group provides an analysis of the key trends in each segment of the market, along with forecasts at the region/country level for 2026-2034. Our report has categorized the market based on type, component, organization size, and vertical.
Type Insights:
- Virtual Desktop Infrastructure (VDI)
- Desktop-as-a-Service (Daas)
- Remote Desktop Services (RDS)
The report has provided a detailed breakup and analysis of the market based on the type. This includes virtual desktop infrastructure (VDI), desktop-as-a-service (DaaS), and remote desktop services (RDS).
Component Insights:
- Software Solutions
- Services
A detailed breakup and analysis of the market based on the component have also been provided in the report. This includes software solutions and services.
Organization Size Insights:
- Small and Medium Enterprises
- Large Enterprises
The report has provided a detailed breakup and analysis of the market based on the organization size. This includes small and medium enterprises and large enterprises.
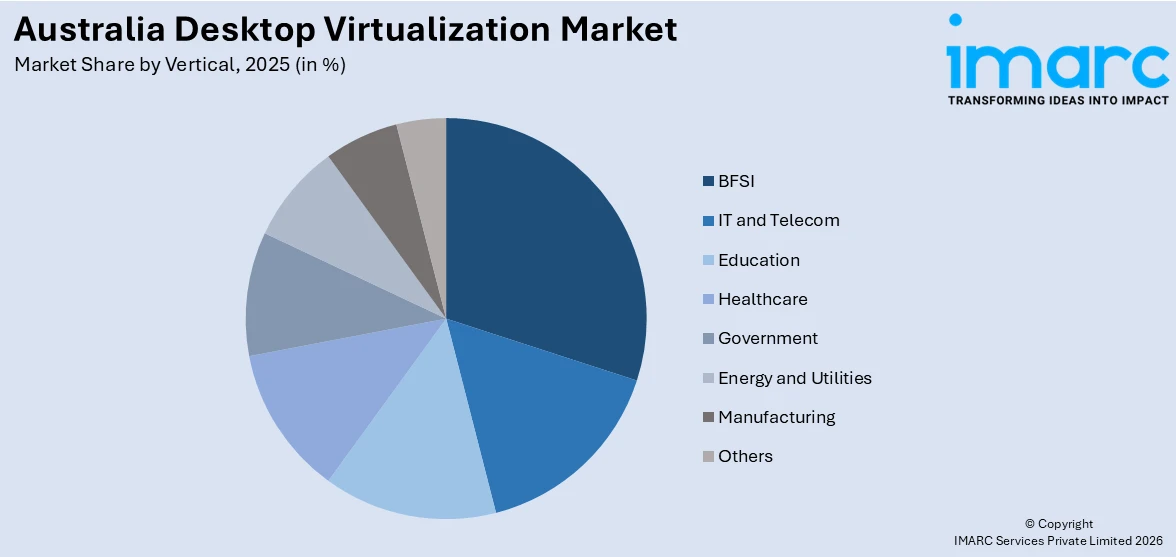
Vertical Insights:
Access the comprehensive market breakdown Request Sample
- BFSI
- IT and Telecom
- Education
- Healthcare
- Government
- Energy and Utilities
- Manufacturing
- Others
A detailed breakup and analysis of the market based on the vertical have also been provided in the report. This includes BFSI, IT and telecom, education, healthcare, government, energy and utilities, manufacturing, and others.
Regional Insights:
- Australia Capital Territory & New South Wales
- Victoria & Tasmania
- Queensland
- Northern Territory & Southern Australia
- Western Australia
The report has also provided a comprehensive analysis of all the major regional markets, which include Australia Capital Territory & New South Wales, Victoria & Tasmania, Queensland, Northern Territory & Southern Australia, and Western Australia.
Competitive Landscape:
The market research report has also provided a comprehensive analysis of the competitive landscape. Competitive analysis such as market structure, key player positioning, top winning strategies, competitive dashboard, and company evaluation quadrant has been covered in the report. Also, detailed profiles of all major companies have been provided.
Australia Desktop Virtualization Market News:
- June 2022: Australian Research Data Commons (ARDC) launched its Virtual Desktop Service, a desktop‑virtualization solution on the Nectar Research Cloud offering researchers a personal cloud‑based workspace. It functions like a remote PC that can be left running for up to 14 days, with renewals available, enabling easy, continuous access to research apps from anywhere. This service simplifies cloud uptake and enhances workflow flexibility.
Australia Desktop Virtualization Market Report Coverage:
| Report Features | Details |
|---|---|
| Base Year of the Analysis | 2025 |
| Historical Period | 2020-2025 |
| Forecast Period | 2026-2034 |
| Units | Million USD |
| Scope of the Report |
Exploration of Historical Trends and Market Outlook, Industry Catalysts and Challenges, Segment-Wise Historical and Future Market Assessment:
|
| Types Covered | Virtual Desktop Infrastructure (VDI), Desktop-as-a-Service (Daas), Remote Desktop Services (RDS) |
| Components Covered | Software Solutions, Services |
| Organization Sizes Covered | Small and Medium Enterprises, Large Enterprises |
| Verticals Covered | BFSI, IT and Telecom, Education, Healthcare, Government, Energy and Utilities, Manufacturing, Others |
| Regions Covered | Australia Capital Territory & New South Wales, Victoria & Tasmania, Queensland, Northern Territory & Southern Australia, Western Australia |
| Customization Scope | 10% Free Customization |
| Post-Sale Analyst Support | 10-12 Weeks |
| Delivery Format | PDF and Excel through Email (We can also provide the editable version of the report in PPT/Word format on special request) |
Key Questions Answered in This Report:
- How has the Australia desktop virtualization market performed so far and how will it perform in the coming years?
- What is the breakup of the Australia desktop virtualization market on the basis of type?
- What is the breakup of the Australia desktop virtualization market on the basis of component?
- What is the breakup of the Australia desktop virtualization market on the basis of organization size?
- What is the breakup of the Australia desktop virtualization market on the basis of vertical?
- What is the breakup of the Australia desktop virtualization market on the basis of region?
- What are the various stages in the value chain of the Australia desktop virtualization market?
- What are the key driving factors and challenges in the Australia desktop virtualization market?
- What is the structure of the Australia desktop virtualization market and who are the key players?
- What is the degree of competition in the Australia desktop virtualization market?
Key Benefits for Stakeholders:
- IMARC’s industry report offers a comprehensive quantitative analysis of various market segments, historical and current market trends, market forecasts, and dynamics of the Australia desktop virtualization market from 2020-2034.
- The research report provides the latest information on the market drivers, challenges, and opportunities in the Australia desktop virtualization market.
- Porter's five forces analysis assist stakeholders in assessing the impact of new entrants, competitive rivalry, supplier power, buyer power, and the threat of substitution. It helps stakeholders to analyze the level of competition within the Australia desktop virtualization industry and its attractiveness.
- Competitive landscape allows stakeholders to understand their competitive environment and provides an insight into the current positions of key players in the market.
Need more help?
- Speak to our experienced analysts for insights on the current market scenarios.
- Include additional segments and countries to customize the report as per your requirement.
- Gain an unparalleled competitive advantage in your domain by understanding how to utilize the report and positively impacting your operations and revenue.
- For further assistance, please connect with our analysts.
 Request Customization
 Speak to an Analyst
 Request Brochure
 Inquire Before Buying
Benefits of Customization
- Personalize this research
- Triangulate with your data
- Get data as per your format and definition
- Gain a deeper dive into a specific application, geography, customer, or competitor
- Any level of personalization
Get in Touch With Us
UNITED STATES
Phone: +1-201-971-6302
INDIA
Phone: +91-120-433-0800
UNITED KINGDOM
Phone: +44-753-714-6104
Email: [email protected]
Client Testimonials


.webp)


